Dempster–Shafer (D–S) evidence theory is more and more extensively applied in multi-sensor data fusion. However, it is still an open issue that how to effectively combine highly conflicting evidence in D–S evidence theory. In this article, a novel divergence measure, called pignistic probability transformation divergence, is proposed to measure the difference between evidences. The proposed pignistic probability transformation divergence can reflect the interaction between single-element and multi-element subsets by introducing the pignistic probability transformation, and satisfies the properties of boundedness, non-degeneracy, and symmetry. Moreover, the pignistic probability transformation divergence can degenerate as Jensen–Shannon divergence when mass function and the probability distribution are consistent. Based on the pignistic probability transformation divergence, a new multi-sensor data fusion method is presented. The proposed method takes advantage of pignistic probability transformation divergence to measure the discrepancy between evidences in order to obtain the credibility weights, and belief entropy to measure the uncertainty of the evidences in order to obtain the information volume weights, which can fully mine the potential information between evidences. Then, the credibility weights and the information volume weights are integrated to generate an appropriate weighted average evidence before using Dempster’s combination rule. The results of two application cases illustrate that the proposed method outperforms other related methods for combining highly conflicting evidences.
Multi-sensor data fusion is an information modeling process in which data from multiple sensors are comprehensively analyzed to realize decision-making. As we all know, the information collected by a single sensor cannot be used to describe a certain system in multiple levels and perspectives, so the results are not convincing. In contrast, multi-sensor data fusion can process data from multiple sensors comprehensively to obtain more reliable results than a single sensor. Thus, it is widely applied in massive applications in the real world. However, it is still an open issue that how to effectively combine the uncertain, inconsistent, or even conflicted data collected from different sensors. Many theories have been presented to solve this problem, including Dempster–Shafer (D–S) evidence theory,1,2 fuzzy set theory,3,4 rough sets,5,6Z-numbers,7,8D-numbers,9,10R-number,11,12 and so on.
The essence of D–S evidence theory is a generalization of probability theory. Compared with the traditional probability theory, it can more effectively express the random uncertainty. In addition, it also provides a powerful Dempster’s combination rule13 which satisfies the excellent characteristics of the associativity and commutativity, and can realize the fusion of evidences without prior information. Due to its flexibility and effectiveness on handling uncertainty, D–S evidence theory is widely applied in various fields of multi-sensor data fusion, such as target recognition,14,15 fault diagnosis,16,17 decision-making,18,19 and risk analysis,20,21. Whereas, Dempster’s combination rule leads to counter-intuitive conclusions when there is a conflict between evidences.7 Thus far, many methods have been developed in order to overcome the defect, which are mainly divided into two types.22 One is to modify Dempster’s combination rule.23,24 It is believed that the counter-intuitive conclusions are made as a result of some defects of Dempster’s combination rule, that is, the normalization process causes the conflicting information to be completely discarded. So, the key to modifying Dempster’s combination rule is the redistribution of conflicts. However, the modified combination rule cannot keep the excellent mathematical properties of Dempster’s combination rule, like commutativity and associativity. The other is to modify the original evidence. It is believed that Dempster’s combination rule itself is not wrong, that conflicts are caused by the instable evidence sources. The improvement method is first to preprocess the conflicting evidence in order to obtain the weighted average evidences. Then, the weighted average evidences are fused using Dempster’s combination rule to get reasonable results. In this article, we focus on the second method. Han et al.25 introduce the concept of evidence support based on the Jousselme distance function and take a weighted average of all the evidences. Xiao26 generalizes the traditional Jousselme distance to the complex evidence distance to measure the conflicts of complex the basic probability assignment (BPA) functions, and uses it as a weighted factor to revise the original evidence. Xiao27 utilizes belief Jensen–Shannon (BJS) divergence to measure the distance between evidences to generate the modified evidences. Whereas, BJS divergence measures the difference between evidences by treating multi-element subsets as single-element subset, which cannot reflect the interaction between single-element and multi-element subset. Although the reinforced belief divergence proposed by Xiao28 overcomes the shortcomings of BJS divergence, the multi-sensor data fusion method based on the divergence is still some room for improvement to achieve more high belief degree for the correct target. Besides, the new divergence proposed by Wang et al.29 also addresses the above deficiencies, but the time complexity of the multi-sensor data fusion method based on the new divergence is high.
In this article, we propose a novel divergence measure, called pignistic probability transformation (PPT) divergence, to measure the difference between evidences. The proposed PPT divergence can reflect the interaction between single-element and multi-element subsets by introducing the PPT, and satisfies the properties of boundedness, non-degeneracy, and symmetry. Moreover, the PPT divergence can degenerate as Jensen–Shannon (JS) divergence30 when the mass function and the probability distribution are consistent. Based on the PPT divergence and the Deng entropy, a new multi-sensor data fusion method is presented. This method takes advantage of PPT divergence to measure the discrepancy between evidences in order to obtain the credibility weights, and the Deng entropy to measure the uncertainty of the evidences in order to obtain the information volume weights, which can fully mine the potential information between evidences. Then, the credibility weights and information volume weights are integrated to generate an appropriate weighted average evidence before using Dempster’s combination rule. Two application cases are provided to illustrate the superiority of our method.
The rest of the article is organized as follows. Section “Preliminaries” introduces some relevant basic theoretical knowledge. Section “The PPT divergence measure” proposes the PPT divergence in D–S evidence theory, and the comparative analysis is conducted. In section “The multi-sensor data fusion method based on the PPT divergence,” the multi-sensor data fusion method is presented based on the PPT divergence and the Deng entropy. Section “Application” presents the two application cases of the proposed fusion method, and analyzes its results. Finally, section “Conclusion” concludes this article.
Preliminaries
In this section, some preliminaries are briefly introduced, including D–S evidence theory, the Deng entropy, pignistic probability transform, and several typical divergences for the purpose of understanding the descriptions in the rest of this article.
D–S evidence theory
Definition 1 (frame of discernment)
Assuming that is a set of mutually exclusive and exhaustive elements , and it can be defined as31
where is called the frame of discernment (FOD), and is named single-element proposition or subset. We define as a power set which contains elements and can be described as32
In the FOD , the BPA function is also called mass function and is defined as a mapping of the power set to [0,1]33
which satisfies
where mass function represents the degree of support to and is called the focal element or subset. The mass function is equal to 0 in classical D–S evidence theory.
Definition 3 (belief function)
Let be a hypothesis in the FOD . A belief function is defined as
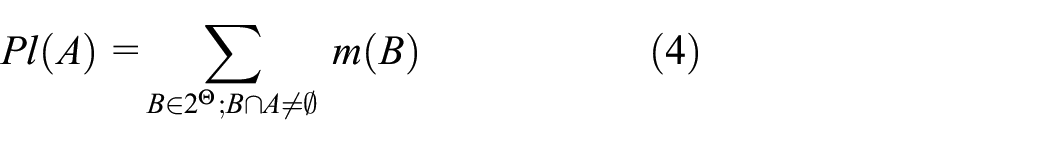
Definition 4 (plausibility function)
Let be a hypothesis in the FOD . A plausibility function : is defined as
Definition 5 (Dempster’s combination rule)
Assume and are the two independent BPAs on . Dempster’s combination rule, represented in the form , is defined as follows13
in which
where ⊕ represents Dempster’s combination rule. is called the conflict coefficient, and it has values between 0 and 1. The larger is, the more conflict between two evidences is.
Entropy
Definition 6 (the Deng entropy)
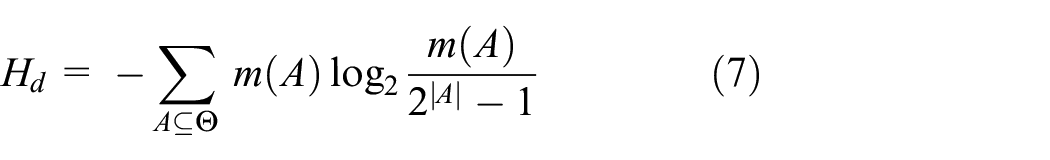
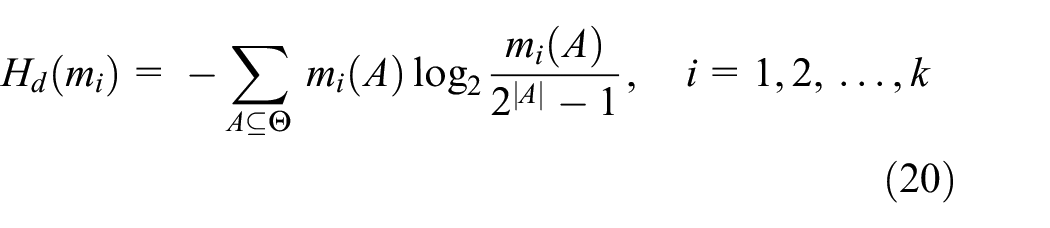
The Shannon entropy34 has a great contribution to the measurement of uncertainty, but it has some limitations when there is the BPA. Because it measures uncertainty based on probability. In order to solve this problem, Deng proposes the Deng entropy35 in the framework of D–S evidence theory. It is a generalization of the Shannon entropy, and is defined as
where is a mass function defined on the FOD , A is the focal element of and is the cardinality of .
Probability transform
Definition 7 (pignistic probability transform)
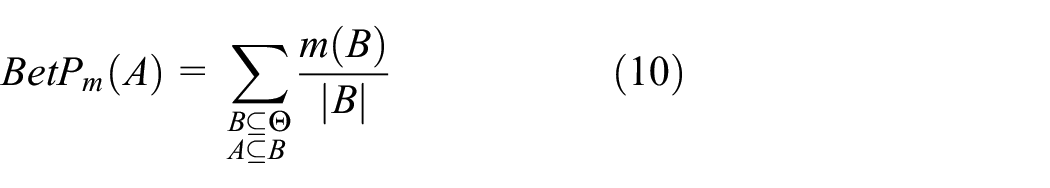
Suppose is a BPA, the pignistic probability transform is defined as follows36
where is the cardinality of the intersection of and . The mass function is equal to 0 in a closed world (i.e. in classical D–S evidence theory). So, it can be simplified to the following form
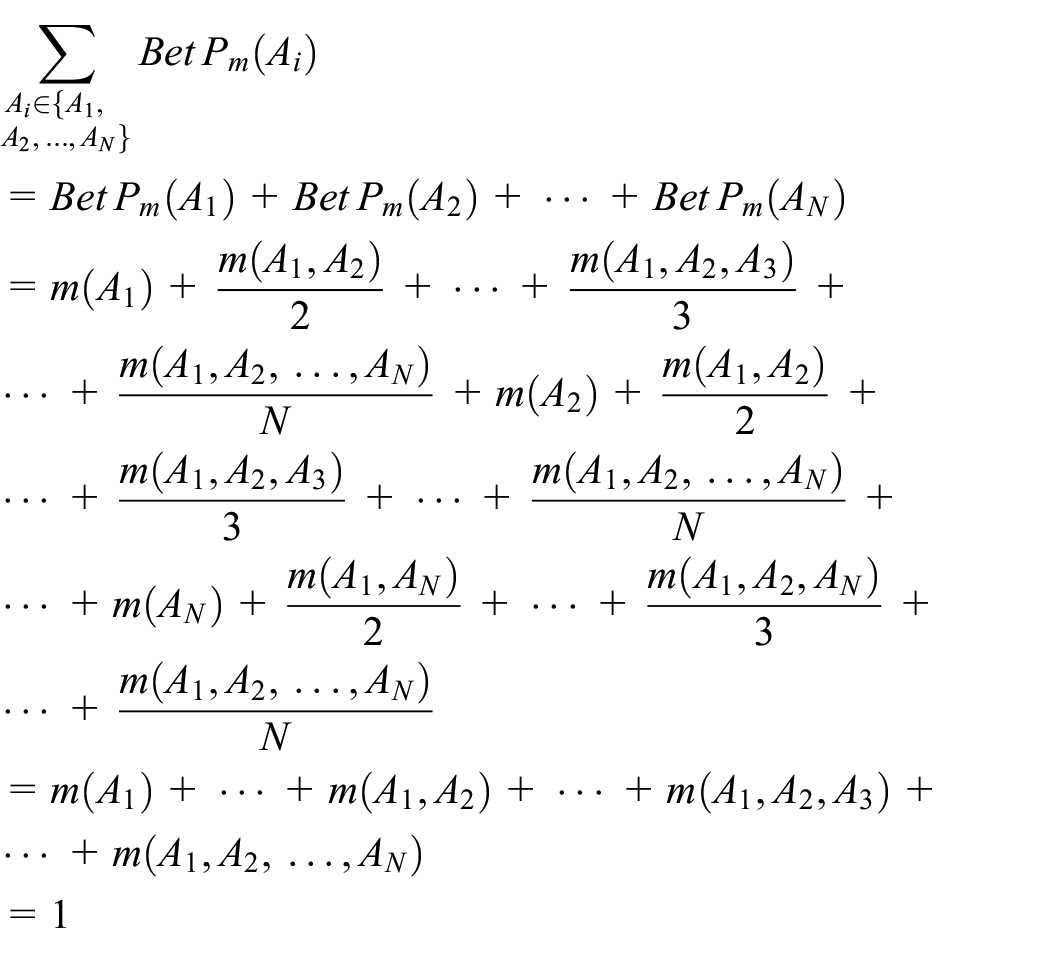
The essence of pignistic probability transform is to convert a BPA function into a probability distribution. It allocates the belief to each element equally. When is single-element subset, equation (9) can be simplified as
Divergence measures
Definition 8 (JS divergence)
Given two probability distributions and with . The JS divergence between and is denoted as30
Definition 9 (BJS divergence)
Given two independent BPAs and defined on , the BJS divergence between and is denoted as27
The essence of BJS divergence is to replace the probabilities distributions in JS divergence with BPAs, so that it can be applied to measure the discrepancy between evidences.
Definition 10 ( divergence)
Let be the FOD, which contains mutually exclusive and collectively exhaustive events. Let and be the two belief functions in . The divergence between the belief functions and is defined as28
where
Definition 11 (Wang et al.’s divergence)
Given two independent BPAs and defined on the new divergence proposed by Wang et al. between and is denoted as29
where
The PPT divergence measure
Although BJS divergence can measure the difference between evidences and achieve accurate fusing results, the multi-element subsets are treated as single-element subsets for divergence calculation, which ignores the influence of multi-element subsets on divergence measurement. A counter example is depicted in Example 1.
Example 1
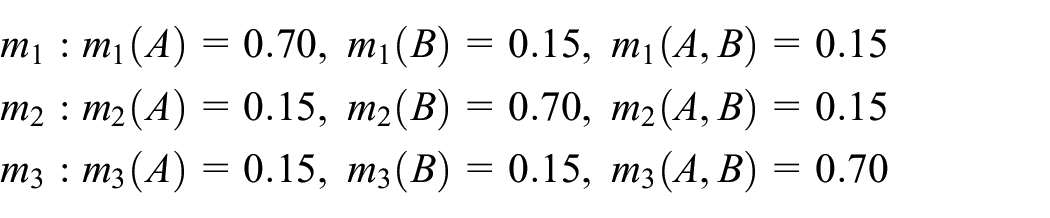
Given three BPAs , , and defined on , they are shown as follows
The divergence is calculated with BJS divergence as follows
As we know, object has the greatest reliability for , object has the greatest reliability for , and object has the greatest reliability for . Obviously, the difference between and is greater than that of and or and . Whereas, the results calculated by BJS divergence illustrate that there is no difference between , , and , which is contrary to common sense. Therefore, to solve above problem, we propose a novel divergence measure.
The definition of the PPT divergence
Let and be the BPAs in the FOD . The novel divergence between and is expressed as
where , and note that is single-element subset. represents the Kullback–Leibler (KL) divergence.37 Obviously, can also be described in the following form
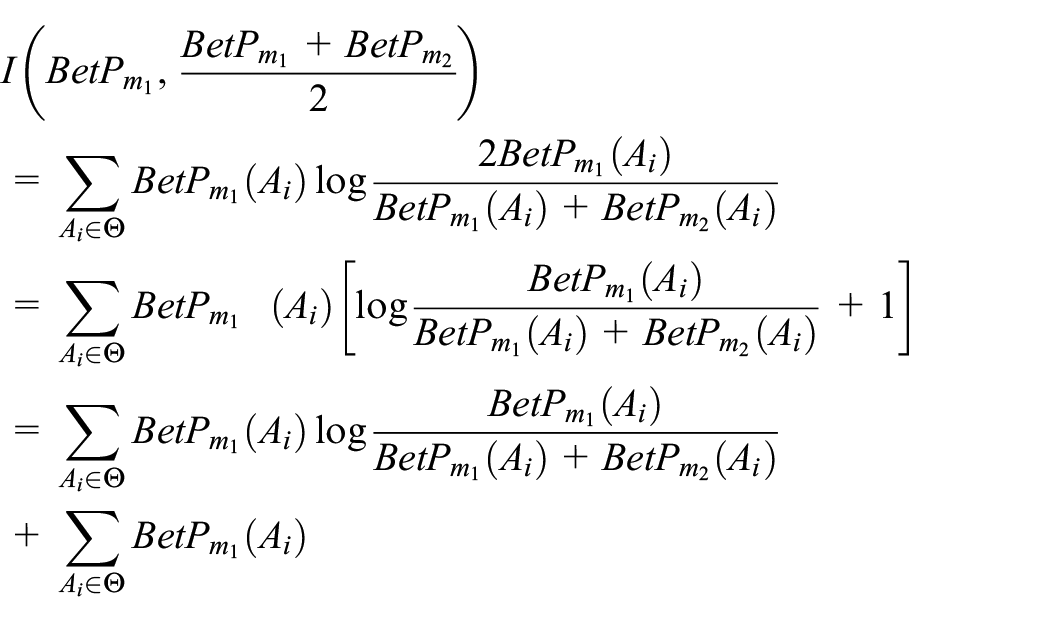
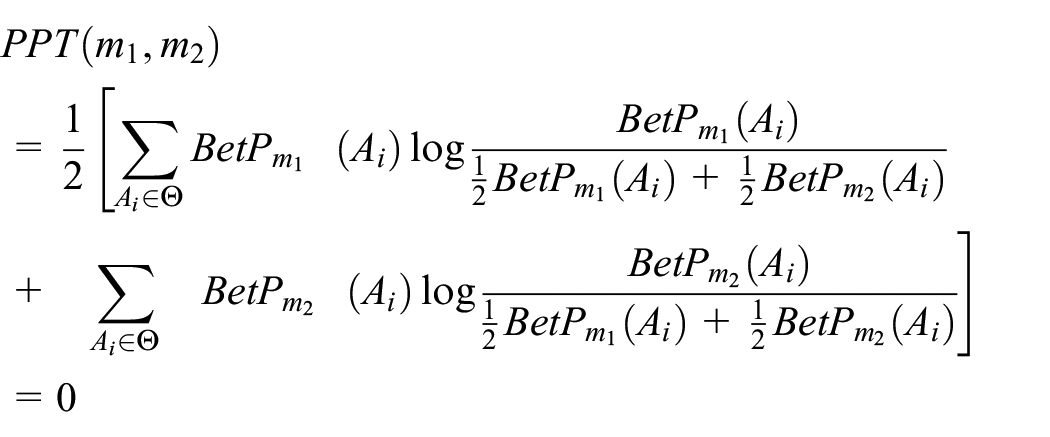
The pignistic probability transform is described as keeping the belief of the single-element subset unchanged and evenly allocating the belief of the multi-element subset to the included single-element subset. Essentially, the function transforms the BPA into a probability distribution. The proposed divergence, named PPT divergence, fully reflects the interaction between single-element and multi-element subsets, thereby effectively avoiding the situation that multi-element subsets are regarded as single-element subsets in calculating the divergence between evidences. Furthermore, when the BPA consists of only singleton subsets, the PPT divergence is degenerated as JS divergence.
The properties of the PPT divergence
There are some properties of the PPT divergence shown as follows:
Based on the Shannon inequality,38 we have , where are the two probability distributions. In equation (15), the transforms BPA into a probability distribution. Consequently, , , and are all the probability distributions. In the same way, and hold, so
Thus, we can conclude that the symmetry of PPT divergence holds.
Comparative analysis
In this section, numerical examples (Examples 1–4 from Wang et al.29) are used to illustrate the validity of PPT divergence and compare it with BJS divergence.
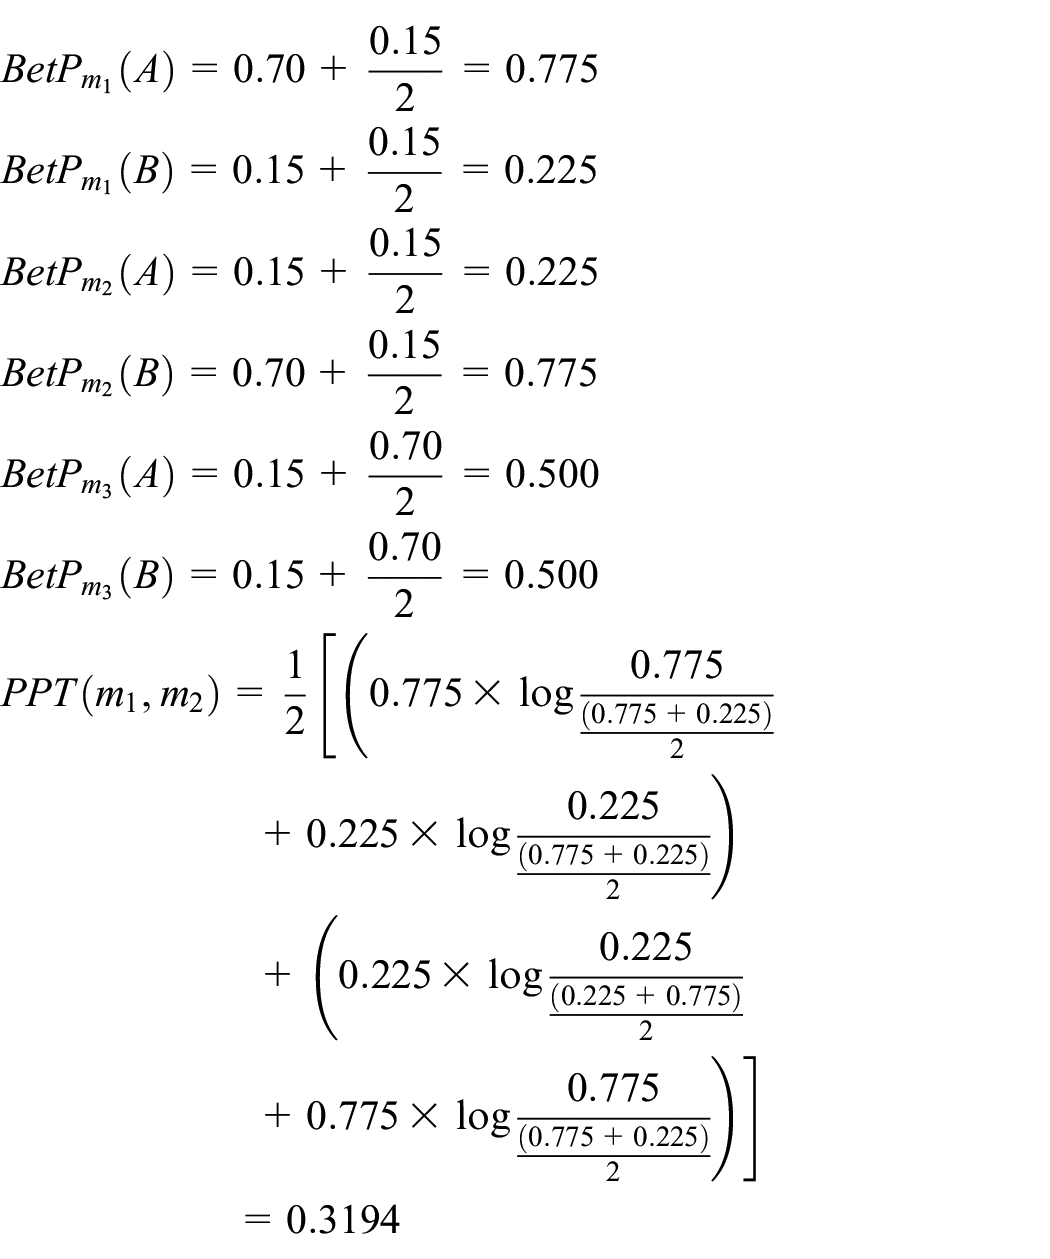
The divergence value, recalled Example 1, is calculated with the PPT divergence as follows
The results show that the divergence value is larger than that of and , which is in line with human intuition.
Example 2
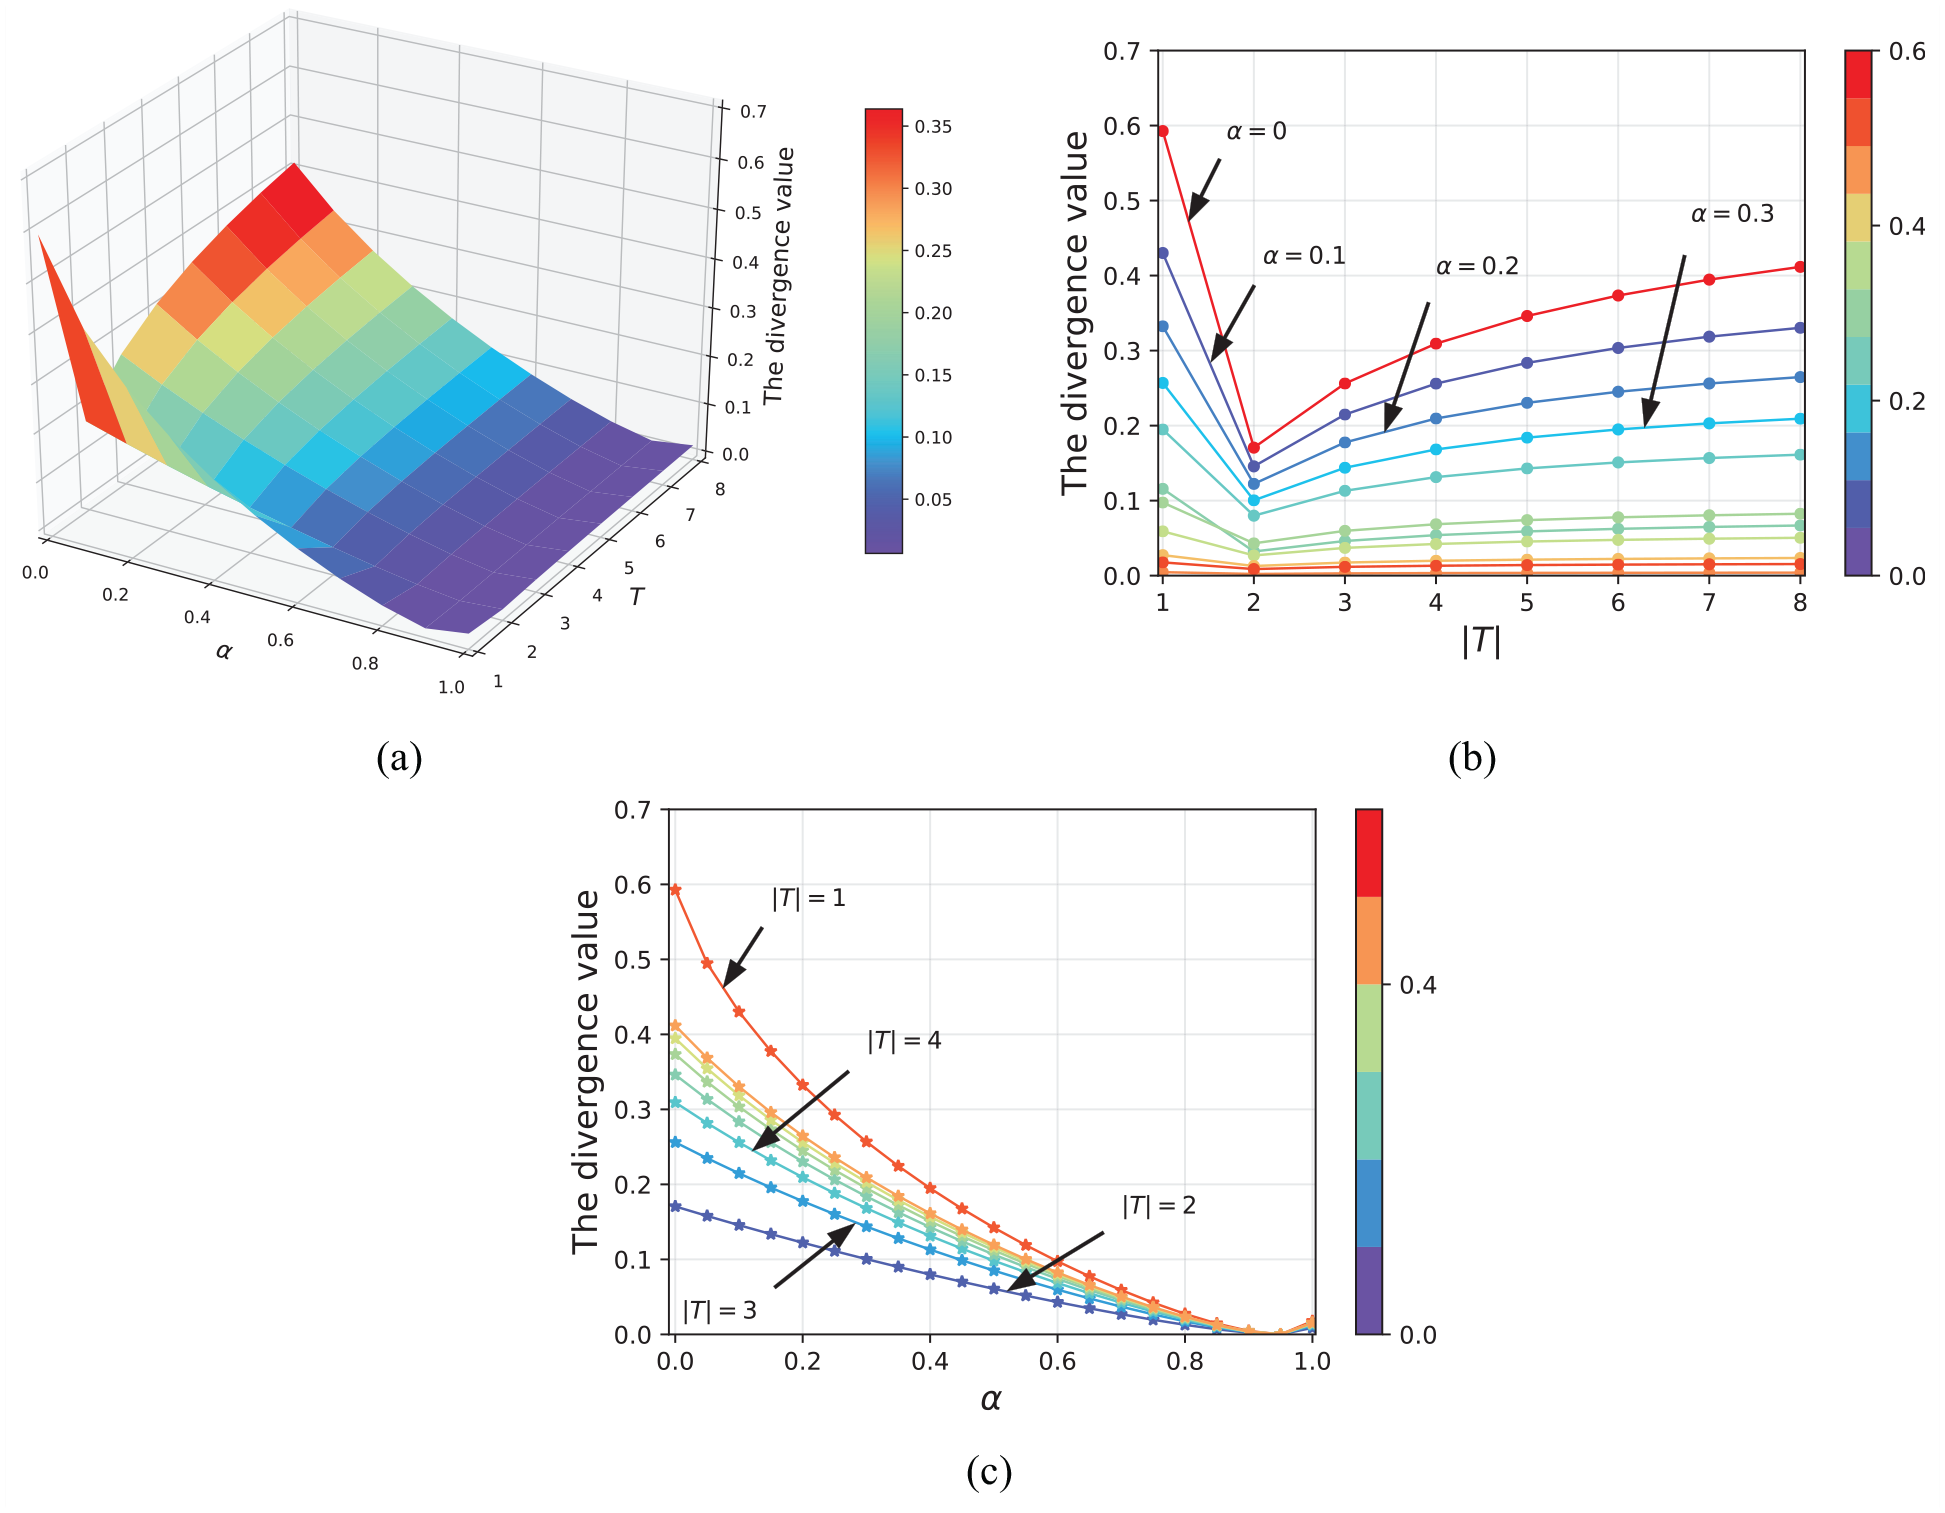
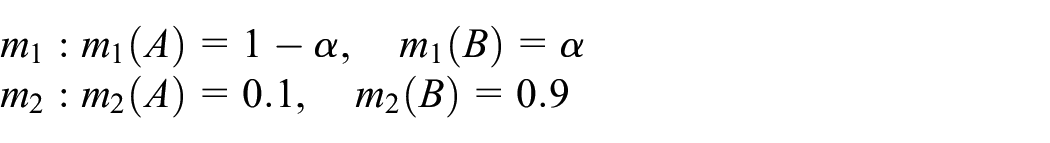
Suppose that there are two BPAs and in the FOD which is We change step by step from 0 to 1. In each step, increases . The cardinality of subset changes from 1 to 8, as shown in Table 1
The variable subset .
1
2
3
4
5
6
7
8
The PPT divergence value varying with and is shown in Figure 1. We can conclude from Figure 1(a) that the divergence value fluctuates from 0 to 1, no matter how and change. The boundedness of the PPT divergence is verified and its value is [0,1]. When , namely, the evidences and consist of singleton subsets, there is no intersection between the subsets. Thus, the divergence value is larger than that of other values in Figure 1(b). As the increases from 2 to 8, the divergence value increases accordingly. This is intuitive, because the cardinality extension of a multi-element subset must result in an increase in uncertainty. As shown in Figure 1(c), when is fixed, the divergence value decreases monotonically as increases from 0 to 0.9. This is also consistent with intuitive, because the belief distribution of the two BPAs is getting more and more similar. When , namely, , the divergence value is always equal to 0, no matter what the value of is. It proves once again that the non-degeneracy of PPT divergence holds.
The change of divergence value in Example 2. (a) The divergence value varying with and . (b) The divergence value varying with . (c) The divergence value varying with .
Example 3
Suppose that there are two BPAs and in the FOD which is . The cardinality of subset changes from 2 to 8, as shown in Table 1
The divergence values varying with are shown in Figure 2. Intuitively, with the increase in cardinality of multi-element subsets, the divergence value between two BPAs increases accordingly. However, the BJS divergence value always remains the same. The reason is that the BJS divergence treats the multi-element subset as single-element subset for calculation, which cannot reflect the influence of multi-element subsets on divergence measurement. On the contrary, the PPT divergence fully considers the interaction between single-element and multi-element subsets and obtains rational results, which illustrates the feasibility of the PPT divergence.
Comparison of the BJS and PPT divergence in Example 3.
Example 4
Suppose that there are two BPAs and in the FOD which is . We change step by step from 0 to 1. In each step, increases
For every change of , the PPT divergence and the BJS divergence achieve the same value as shown in Figure 3. This is reasonable, because can be simplified to when two BPAs only consist of singleton subsets, namely, the PPT divergence degenerates into the BJS divergence. In this case, the BJS divergence assigns the mass function’s hypothesis to the single element and the BPA is turned into probability. In fact, the BJS divergence also degenerates to JS divergence.
Comparison of the BJS and PPT divergence in Example 4.
We can conclude from the above examples that the results obtained by the PPT divergence are more reasonable than those obtained by the BJS divergence in measuring the divergence between BPAs.
The multi-sensor data fusion method based on the PPT divergence
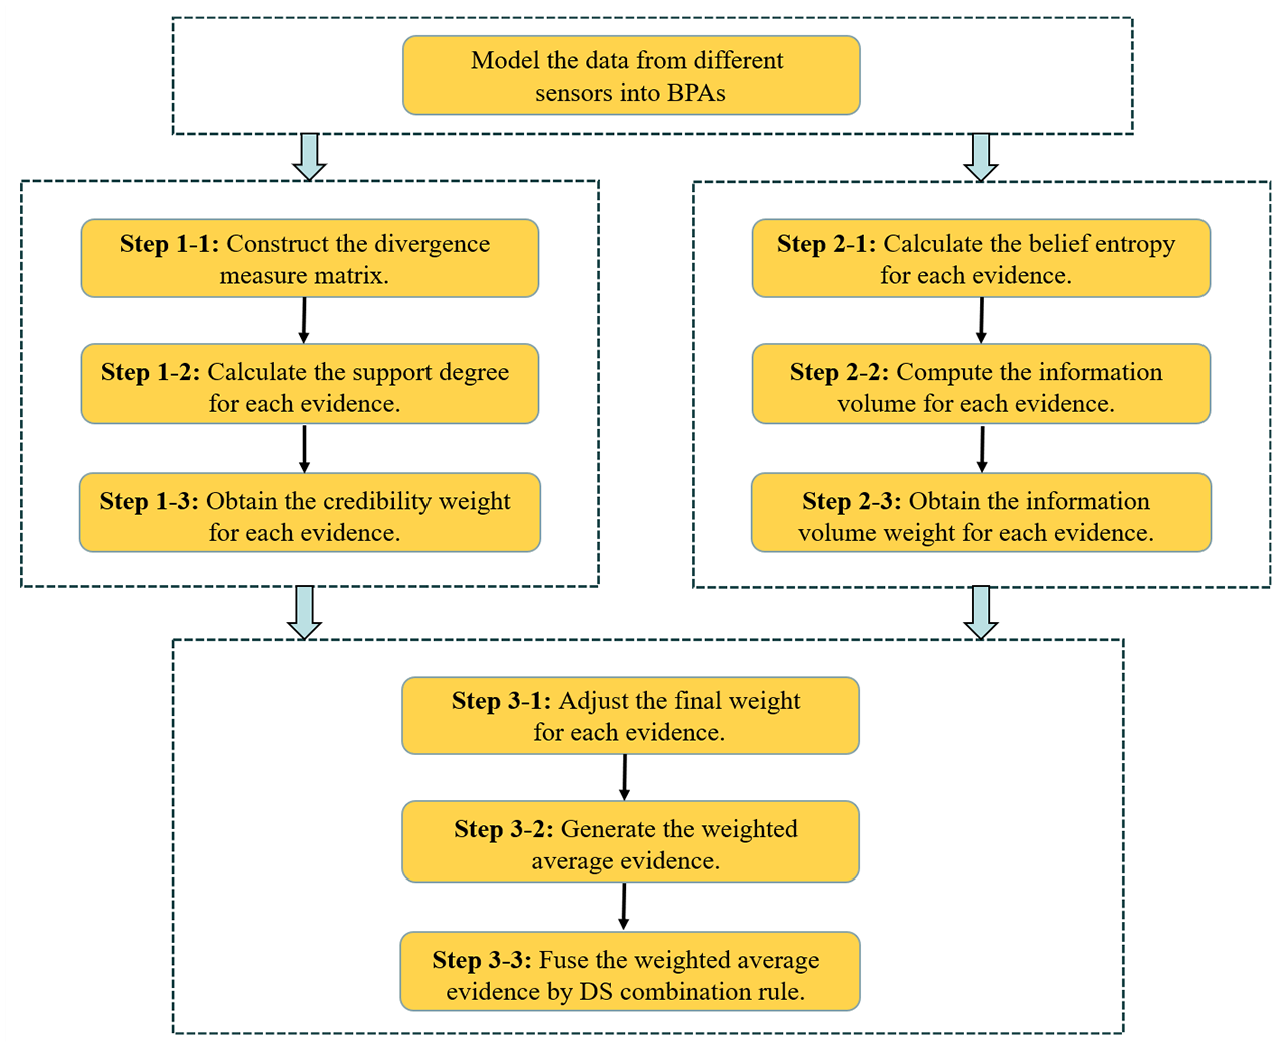
To combine highly conflicting evidence effectively, a new multi-sensor data fusion method is proposed based on the PPT divergence and the Deng entropy. In this proposed method, the PPT divergence is used to measure the discrepancy between evidences to obtain the credibility weight of evidence which is inversely proportional to the divergence value, and the Deng entropy is used to measure the uncertainty of evidence to obtain the information volume weight of evidence. The proposed method comprehensively determines the final weight of evidence from two aspects: difference and uncertainty, which fully excavates the potential information between evidences, so that it can deal with conflicting evidence more effectively. The flowchart of proposed method is shown in Figure 4.
The flowchart of proposed method.
Obtain the credibility weight of evidence
Step 1-1: assume there are independent BPAs on the same FOD that contains elements: . The divergence value between two BPAs is generated with equation (16). Then, a divergence matrix is constructed as follows
Step 1-2: the support degree of evidence is calculated as
Note that, to avoid that the support degree of evidence is meaningless, we need to replace with , if and only if there are identical pieces of evidence.
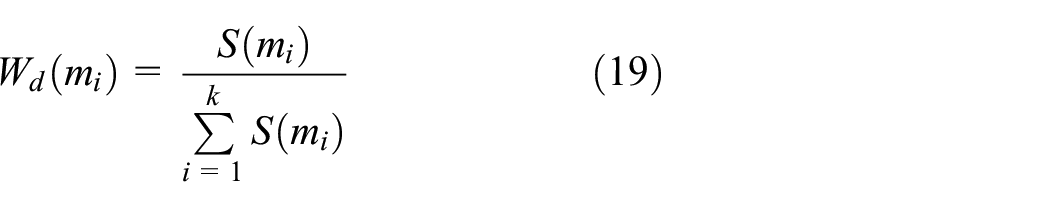
Step 1-3: the credibility weights of evidence are defined as
Obtain the information volume weight of evidence
Step 2-1: the Deng entropy of evidence is generated with equation (7)
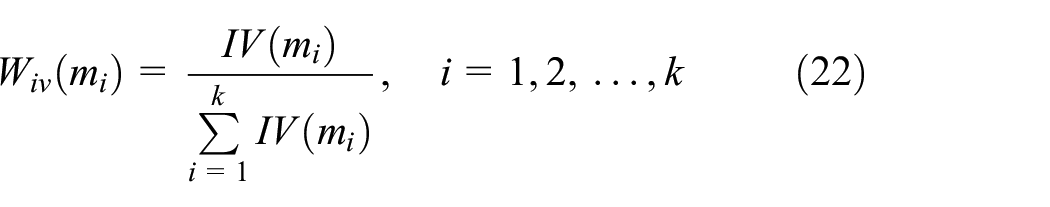
Step 2-2: to avoid assigning zero weight to the evidence whose belief entropy is zero, the information volume is defined as
Step 2-3: the information volume weights of evidence is calculated as
Generate and combine the weighted average evidence
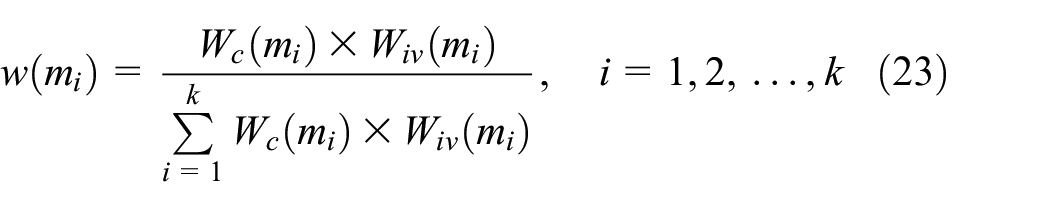
Step 3-1: the final weight of evidence is calculated as
Step 3-2: the weighted average evidence is calculated as
Step 3-3: Dempster’s combination rule is used k − 1 times to combine the weighted average evidence according to equation (5). Then, the final combination result is calculated as
Application
In this section, the proposed multi-sensor data fusion method is applied in two application cases of target recognition and fault diagnosis.
Application in target recognition
Problem statement
Consider a multi-sensor target recognition problem associated with the sensor reports that are collected from five different types of sensors , each of which is allocated to a different positions in order to monitor the objectives. The FOD which consists of three types target is given by . These sensors collect the target information and generate reports, which are modeled as BPAs, denoted by in Table 2. Obviously, the evidence highly conflicts with other evidences. The application is cited from Xiao.28
The collected sensor reports modeled as BPAs in the target recognition problem.
0.40
0.28
0.30
0.02
0.01
0.90
0.08
0.01
0.63
0.06
0.01
0.30
0.60
0.09
0.01
0.30
0.60
0.09
0.01
0.30
BPA: basic probability assignment.
Combine evidences by the proposed multi-sensor data fusion method
Step 1-1: establish the divergence matrix as follows
Step 1-2: calculate the support degree of evidence as follows
Step 1-3: calculate the credibility weight of evidence as follows
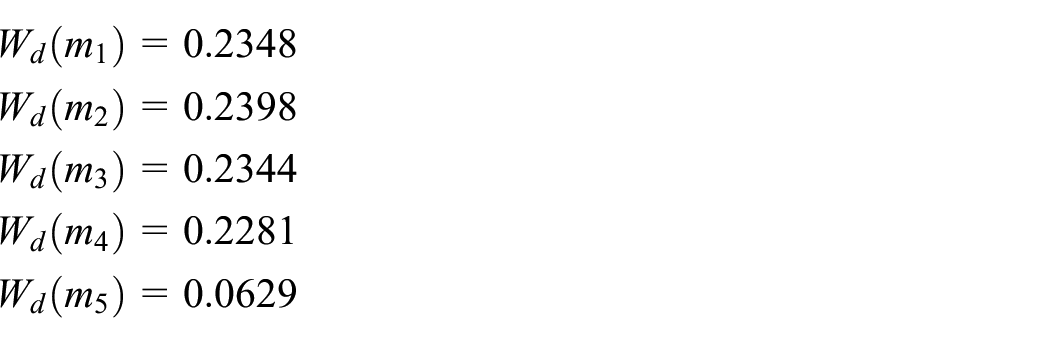
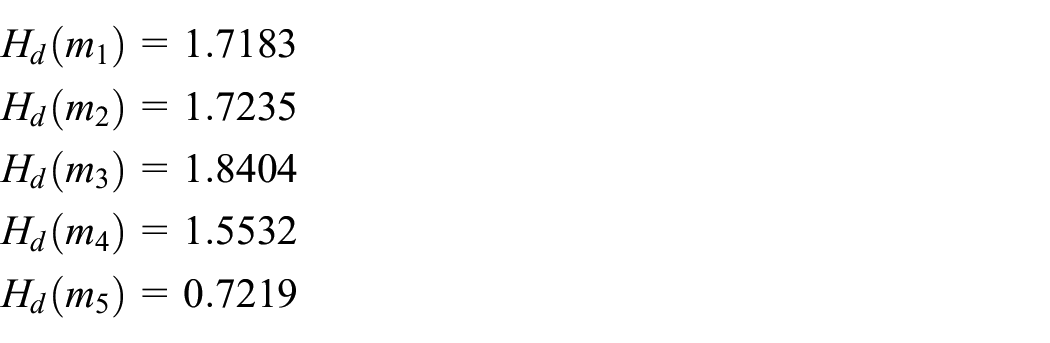
Step 2-1: compute the belief entropy of evidence as follows
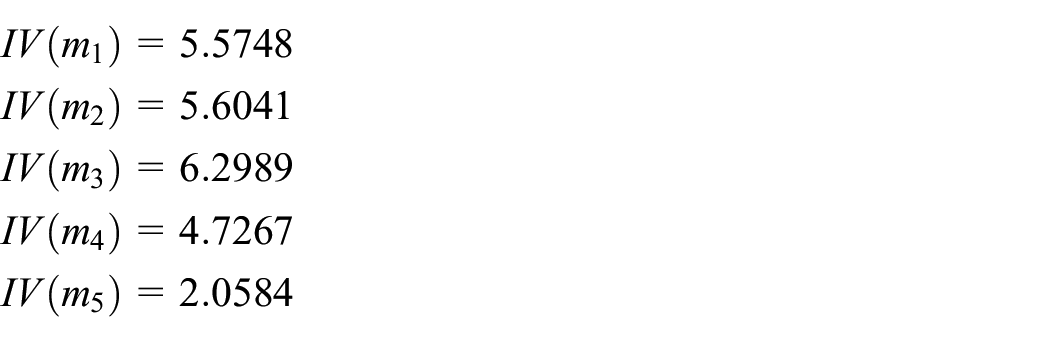
Step 2-2: the information volume of evidence is calculated as follows
Step 2-3: the information volume weight of evidence is calculated as follows
Step 3-1: the final weight of evidence is calculated as follows
Step 3-2: the weighted average evidence is calculated as follows
Step 3-3: use Dempster’s combination rule to fuse the weighted average evidence four times, and the final combination results are shown in Table 3 and Figure 5.
The fusing results by different methods in the target recognition.
The comparison of the BPAs generated by different methods for target recognition.
Discussion
The result of combining conflicting evidence with different methods is shown in Table 3. The comparisons of the BPAs generated by different methods are shown in Figure 5.
As shown in Table 3, although all of the methods can recognize the objective as the true target, the proposed method achieves a much higher belief value (0.9892) than Xiao’s27 method and Xiao’s28 method, which illustrates that the proposed method solves the shortcomings of Xiao’s27 method and has a greater improvement in the belief value for the correct target than Xiao’s28 method. The reason is that it not only reflects the interaction between single-element and multi-element subsets by introducing the PPT, but also uses the credibility weights and the information volume weights to determine the final weights of evidences. In real applications, a slight increase of the belief value for the correct target is significant to improve the performance of target recognition system. Comparatively, the proposed method and Wang et al.’s29 method similarly achieve the highest belief degree of the correct target. According to the time complexity calculation method presented in Li and Xiao,39 the proposed method calculates the divergence value between two evidences for times. Since , we need to process elements to obtain . The time complexity of calculation of divergence matrix is . The weighted average evidence will be combined for times. Consequently, the time complexity of combining the weighted average evidence is . The overall time complexity of the proposed method is , where and represent the number of evidences and elements in the FOD, respectively. Wang et al.’s method29 calculates the divergence value between two evidences for times. Since , we need to process elements to obtain . The time complexity of calculation of divergence matrix is . The weighted average evidence will be combined for times. Thus, the time complexity of combining the weighted average evidence is . The overall time complexity of Wang et al.’s method is . Obviously, the time complexity of the proposed method is lower than that of Wang et al.’s method. Therefore, the proposed method outperforms other four methods in target recognition application.
Application in fault diagnosis
Problem statement
Given the FOD , where represent the three kinds of faults in the automobile system: low oil pressure, air leakage in the intake system, and solenoid valve jam. The set of sensors which are positioned on different places for collecting the fault information in the automobile system is . is the evidence given by sensor . The collected sensor reports which are modeled as BPAs are provided in Table 4. According to the collected sensor reports, is damaged due to speed overload, so the evidence highly conflicts with other evidences. The application is cited from Xiao.28
The collected sensor reports modeled as BPAs in the fault diagnosis problem.
0.70
0.10
0
0.20
0.70
0
0
0.30
0.65
0.15
0
0.20
0.75
0
0.05
0.20
0
0.20
0.80
0
BPA: basic probability assignment.
Combine evidences by the proposed multi-sensor data fusion method
Step 1-1: establish the divergence matrix as follows
Step 1-2: compute the support degree of evidence as follows
Step 1-3: calculate the credibility weight of evidence as follows
Step 2-1: compute the belief entropy of evidence as follows
Step 2-2: the information volume of evidence is calculated as follows
Step 2-3: the information volume weight of evidence is calculated as follows
Step 3-1: the final weight of evidence is calculated as follows
Step 3-2: the weighted average evidence is calculated as follows
Step 3-3: use Dempster’s combination rule to fuse the weighted average evidence four times, and the final combination results are shown in Table 5 and Figure 6.
The fusing results by different methods in the fault diagnosis.
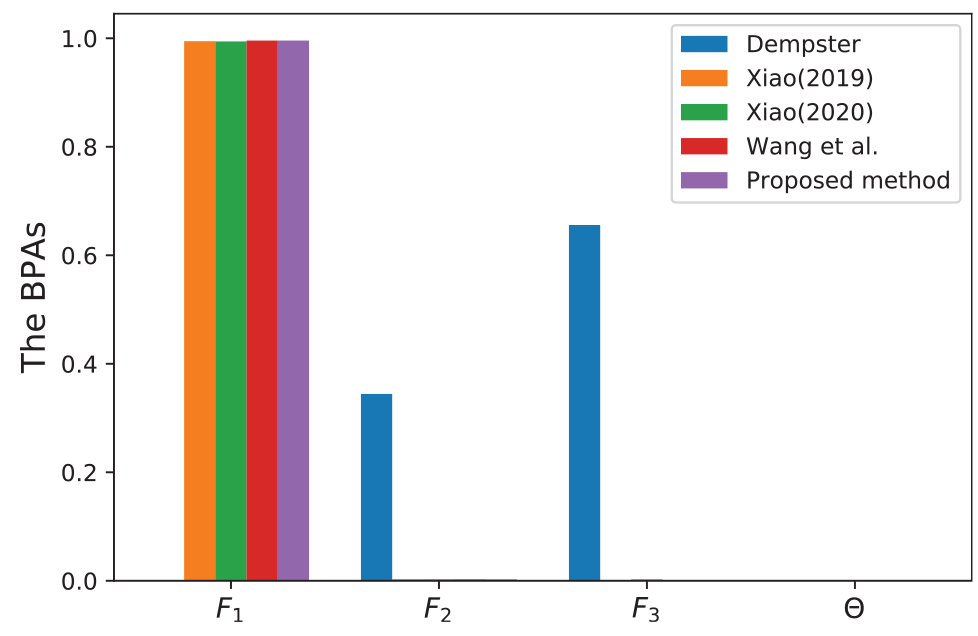
The comparison of the BPAs generated by different methods for fault diagnosis.
Discussion
As shown in Table 5 and Figure 6, facing the conflicting sensor report , Dempster’s method fails to combine the highly conflicting evidence, which generates counter-intuitive result and treats the fault type as the true fault type, even if the other four evidences support the fault type . Whereas, the proposed method, Xiao’s27 method, Xiao’s28 method, and Wang et al.’s29 method can handle the highly conflicting evidence and recognizes the fault type correctly. Furthermore, compared with Xiao’s27 method, the proposed method is more effective in managing conflicting evidence, and has the higher belief value (0.9957) of the correct fault type as shown in Table 5. The main reason is that the PPT divergence reflects the interaction between single-element and multi-element subsets by introducing PPT. Meanwhile, the proposed method has more room for improvement in the belief value of the correct target than Xiao’s28 method. The reason is that the proposed method not only makes use of the PPT divergence to obtain the credibility weight, but also considers the uncertainty of the evidences by adopting the Deng entropy to obtain the information volume weight. Then, these two kinds of weights are used to determine the final weight comprehensively. The proposed method and Wang et al.’s29 method similarly achieve the highest belief value for the correct fault types, but the time complexity of the proposed method is lower than that of Wang et al.’s29 method. The above analysis fully demonstrates the effectiveness and superiority of the proposed method in fault diagnosis application.
Conclusion
In this article, a novel divergence measure, called PPT divergence, is proposed to measure the difference between evidences. The proposed PPT divergence can reflect the interaction between single-element and multi-element subsets by introducing the PPT, and overcome the shortcomings of the BJS divergence which treats multi-element subset as single-element subset for calculation. Furthermore, the PPT divergence satisfies the properties of boundedness, non-degeneracy, and symmetry, and can degenerate as JS divergence when the mass function and the probability distribution are consistent. Comparative analysis shows that the PPT divergence can obtain more reasonable results than the BJS divergence in measuring the discrepancy between evidences. Based on the PPT divergence, a new multi-sensor data fusion method is presented. The proposed method takes advantage of PPT divergence to measure the discrepancy between evidences in order to obtain the credibility weights, and the Deng entropy to measure the uncertainty of the evidences in order to obtain the information volume weights, which can fully mine the potential information between evidences. Then, the credibility weights and the information volume weights are integrated to generate the weighted average evidence before using Dempster’s combination rule. Through two application cases analysis, compared with Xiao’s and Wang et al.’s multi-sensor data fusion method, our proposed method has higher belief degree for the correct target and lower time complexity, respectively. In general, the proposed method outperforms other four methods for combining highly conflicting evidences.
Footnotes
Handling Editor: Dr Peio Lopez Iturri
Declaration of conflicting interests
The author(s) declared no potential conflicts of interest with respect to the research, authorship, and/or publication of this article.
Funding
The author(s) disclosed receipt of the following financial support for the research, authorship, and/or publication of this article: This work was supported by the National Natural Science Foundation of China (grant nos 61903373 and 61921001).
ORCID iD
Shijun Xu
References
1.
DengY.Information volume of mass function. Int J Comput Commun Control2020; 15(6): 3983.
2.
LiuFGaoXZhaoJ, et al. Generalized belief entropy and its application in identifying conflict evidence. IEEE Access2019; 7(1): 126625–126633.
3.
ZadehLA. Fuzzy sets as a basis for a theory of possibility. Fuzzy Set Syst1999; 100(1): 9–34.
4.
BaykasoğluAGölcükİ. Development of a novel multiple-attribute decision making model via fuzzy cognitive maps and hierarchical fuzzy TOPSIS. Inform Sci2015; 301: 75–98.
5.
AhAAsAHnA. Distributed approach for computing rough set approximations of big incomplete information systems. Inform Sci2021; 547: 427–449.
6.
ZhangPLiTWangG, et al. Multi-source information fusion based on rough set theory: a review. Inform Sci2021; 68: 85–117.
7.
JiangWHuangCDengX. A new probability transformation method based on a correlation coefficient of belief functions. Int J Intell Syst2019; 34(6): 1337–1347.
8.
HuangJXuDHLiuHC, et al. A new model for failure mode and effect analysis integrating linguistic Z-numbers and projection method. IEEE T Fuzzy Syst2021; 29(3): 530–538.
9.
XiaJFengYQLiuLN, et al. On entropy function and reliability indicator for D numbers. Appl Intell2019; 49(9): 3248–3266
10.
MoHM. A SWOT method to evaluate safety risks in life cycle of wind turbine extended by D number theory. J Intell Fuzzy Syst2021; 40(3): 4439–4452
11.
SeitiHHafezalkotobAMartínezL. R-Sets, comprehensive fuzzy sets risk modeling for risk-based information fusion and decision-making. IEEE T Fuzzy Syst2021; 29(2): 385–399.
12.
MouXZhangQ-ZLiuH-C, et al. Knowledge representation and acquisition using R-numbers Petri nets considering conflict opinions. Expert Syst2021; 38(3): 604–617.
13.
DempsterAP. Upper and lower probabilities generated by a random closed interval. Ann Math Statist1968; 39(3): 957–966.
14.
WangJLiuFX. Temporal evidence combination method for multi-sensor target recognition based on DS theory and IFS. J Syst Eng Electron2017; 28(6): 1114–1125.
15.
LiuMChenS. SAR target configuration recognition based on the Dempster–Shafer theory and sparse representation using a new classification criterion. Int J Remote Sens2019; 40(11–12): 4604–4622
16.
ChenLDiaoLSangJ. A novel weighted evidence combination rule based on improved entropy function with a diagnosis application. Int J Distrib Sens N2019; 15(1): 1–13.
17.
XiaoFCaoZJolfaeiA. A novel conflict measurement in decision-making and its application in fault diagnosis. IEEE T Fuzzy Syst2021; 29(1): 186–197.
18.
DenœuxTShenoyPP. An interval-valued utility theory for decision making with Dempster-Shafer belief functions. Int J Approx Reason2020; 124: 194–216.
19.
ZhangRXuZGouX. An integrated method for multi-criteria decision-making based on the best-worst method and Dempster-Shafer evidence theory under double hierarchy hesitant fuzzy linguistic environment. Appl Intell2021; 51(2): 713–735.
20.
PanYZhangLWuX, et al. Multi-classifier information fusion in risk analysis. Inform Sci2020; 60: 121–136.
21.
PanYZhangLLiZ, et al. Improved fuzzy Bayesian network-based risk analysis with interval-valued fuzzy sets and D–S evidence theory. IEEE T Fuzzy Syst2020; 28(9): 2063–2077.
22.
SongYDengY. A new method to measure the divergence in evidential sensor data fusion. Int J Distrib Sens N2019; 15(4): 1–8.
23.
SmetsP. The combination of evidence in the transferable belief model. IEEE T Pattern Anal1990; 12(5): 447–458.
24.
LefevreEElouediZ. How to preserve the conflict as an alarm in the combination of belief functions?Decis Support Syst2013; 56(12): 326–333.
25.
YongDWenKangSZhenFuZ, et al. Combining belief functions based on distance of evidence. Decis Support Syst2004; 38(3): 489–493.
26.
XiaoF. CED: a distance for complex mass functions. IEEE T Neur Net Lear2020; 32: 1525–1535.
27.
XiaoF. Multi-sensor data fusion based on the belief divergence measure of evidences and the belief entropy. Inform Fusion2019; 46: 23–32.
28.
XiaoF. A new divergence measure for belief functions in D–S evidence theory for multisensor data fusion. Inform Sci2020; 514: 462–483.
29.
WangHDengXJiangW, et al. A new belief divergence measure for Dempster–Shafer theory based on belief and plausibility function and its application in multi-source data fusion. Eng Appl Artif Intel2021; 97: 104030.
30.
LinJ. Divergence measures based on the Shannon entropy. IEEE T Inform Theory1991; 37(1): 145–151.
31.
ZhangHDengY. Entropy measure for orderable sets. Inform Sci2021; 561: 141–151.
32.
HonghuiXuYong Deng. Dependent evidence combination based on decision-making trial and evaluation laboratory method. Int J Intell Syst2019; 34(7): 1555–1571.
33.
HeZWenJ. An evidential Markov decision making model. Inform Sci2018; 467: 357–372.
34.
ShannonCE. A mathematical theory of communication. Bell Syst Tech J2001; 5(3): 3–55
35.
DengY. Deng entropy. Chaos Soliton Fract2016; 91: 549–553.
36.
SmetsPKennesR. The transferable belief model. Artif Intell1994; 66(2): 191–234.
37.
KullbackS. Information Theory and Statistics. Mineola, NY: Dover Publication, 1997
38.
CampbellLL. On measures of information and their characterizations. SIAM Review1977; 19(3): 577–579.
39.
LiHXiaoF. A method for combining conflicting evidences with improved distance function and Tsallis entropy. Int J Intell Syst2020; 35(11): 1814–1830.