
Abstract
Vascular dementia, secondary to Alzheimer’s dementia, ranks as one of the most frequent dementia types. The process of vascular dementia is divergent with other neurodegenerative dementias and thus reversible at the early cognitive disorder or mild dementia stages. The encephalography and neuroimaging data mining at different stages would bring neuromodulation strategies in practice; 15 mild cognitive impairment patients and 16 mild vascular dementia patients as well as 17 cognitive healthy controls were screened in this study. Cognitive tests such as Mini-Mental State Examination, Montreal cognitive assessment, voxel-based morphometry, electroencephalography, and standardized low-resolution brain electromagnetic tomography connectivity network were conducted. Compared with healthy group, voxel-based morphometry analysis showed a decrease in gray/cerebrospinal fluid ratio (p < .05) in mild dementia group; the energy power of gamma band decreased (p < .05) in mild dementia group; and electroencephalography standardized low-resolution brain electromagnetic tomography analysis showed wider frontal and temporal lobe involvement in mild dementia patients (p < .05). Network topological analysis screened top 10 key Brodmann areas (44R, 7R, 8L, 22L, 47L, 27L, 1L, 1R, 7R, 43L), which could be underlying neuromodulators for dementia patients. Electroencephalography as well as structural magnetic resonance imaging could be used for the evaluation of cognitive disorder patients. The spectrum-specific standardized low-resolution brain electromagnetic tomography analysis and connectivity network analysis could shed light on the neuromodulator targets in the early phase of dementia.
Keywords
Introduction
Dementia is becoming a growing burden for the aging society in the worldwide.1,2 Vascular dementia (VaD) secondary to Alzheimer’s dementia (AD) ranks as one of the most frequent dementia types in China, the prevalence of which is 1.7% in the population above the age of 60 years.3,4 The early stage of dementia such as mild cognitive impairment (MCI) and mild dementia should be well explored for the clinic observation and therapy strategy.5,6
Imaging methods, including computed tomography (CT) and magnetic resonance imaging (MRI), are the most popular and convenient examinations for neurology diseases. Parietal lobes were found to be impaired in the VaD patients in the MRI-based observational study. 7 Interestingly, some structural characteristics such as voxel-based morphometry (VBM) could help to differentiate dementias from different racial and ethical groups, in which white matter volume and hippocampal volume presented different styles in African Americans and non-Hispanic Whites and Hispanics. 8 Besides structural abnormalities, the cognitive tests and functional assessment such as electroencephalography (EEG) are more sensitive to evaluate the severity of the dementias. The temporal lobe atrophy was correlated with delayed P300 in a group of cognitive dysfunction and brain atrophy group. 9 The spectrum-specific analysis and standardized low-resolution brain electromagnetic tomography (sLORETA) connectivity construction could screen the key modules of dementias. EEG-based sLORETA analysis showed that Alpha-1 relative power current density in parietooccipital brain areas, Beta-1 in the frontal lobe, and delta relative power current density were found to be altered in vascular cognitive impairment, no dementia (VCIND) patients. 10 However, no significant differences were found between progressive MCI (pMCI) and stable MCI (sMCI), but the largest difference in duration was found for microstate. 11 Also, the EEG method was used to test the treatment efficiency, and slow theta activity in parietal–occipital lobes was found in cognitive enhancer treatment of rats. 12
However, these studies did not show a consistency spectrum of cognitive healthy, cognitive impairment, and mild dementia patients. In this study, brain structure and EEG sLORETA network analysis were used to detect the brain network alterations for the cognitive decline.
Materials and methods
Subjects
In this study, 15 (63.1 ± 8.3 years old, 37% female) MCI and 16 (74.3 ± 7.6 years old, 35% female) mild VaD patients as well as 17 healthy controls (62.83 ± 5.9 years old, 30% female) from the clinic of neurology department in Hainan General Hospital were screened. Patients’ inclusion criterion was to fulfill the diagnosis of MCI and mild dementia by two neurologists. All the patients were grouped into subcortical lacunar infarctions without recent acute cerebral infarction. Exclusion criteria were as follows: (1) use of drugs targeting central nervous system (CNS), (2) diagnosis of epilepsy, (3) post-radiotherapy of operative nasopharyngeal carcinoma, and (4) other complications such as schizophrenia or neurodegenerative agents.
Structural MRI and data processing
All the subjects were scanned by 3.0 Tesla whole-body MRI scanner (Magnetom Tim Skyra, Siemens Medical Solutions, Erlangen, Germany) with a 32-channel phase array head coil used for image acquisition. Subjects’ head were immobilized using a foam pad and a Plexiglas head cradle. High-resolution T1-weighted three-dimensional (3D) anatomical images were acquired with a sagittal magnetization-prepared rapid gradient echo sequence for later co-registration and normalization (repetition time/echo time = 2300/1.97 ms, flip angle = 9°, field of view = 256 mm × 256 mm, matrix = 256 × 256, 176 slices, slice thickness = 1 mm, total time points = 353 s). Preprocessing of the imaging data was carried out using Statistical Parametric Mapping (SPM, http://www.fil.ion.ucl.ac.uk/spm/) software. The SPM8 and the toolbox such as VBM in the MATLAB context were used to calculate the gray matter, white matter, and cerebrospinal fluid (CSF) volume. 13 The gray matter, white matter, CSF, gray matter/white matter, gray matter/CSF, white matter/CSF, and gray matter–white matter/CSF were calculated and compared between groups for the information of brain atrophy.
EEG recording
EEGs were recorded between 8:00 and 10:00 in the morning. 14 Patients and control group subjects were placed in a semi-sitting position and asked to keep the eyes closed at the EEG recordings. A 21-ch EEG recording, using Ag/AgCl electrodes, was continuously gathered for 2 min in the period of the experiment with the Nihon Kohden EEG Equipment. EEG data were sampled at 500 Hz, and electrode impedance was kept lower than 5 kΩ.
EEG spectrum power analysis
Letswave7 in MATLAB context was used to calculate and compare the EEG spectrum energy. A continuous microwave time window method was selected for time–frequency analysis. EEG data were filtered with 0.5 to 100 Hz bandpass filter off-line and were subjected to epoching (2 s each), linear-detrend, and artifact rejection preprocessing. The artifact rejection methods consisted of exclusion in epoch with large amplitude (over ±80 µV), direct current bias, and blinks. “Bad electrodes” were replaced with the extrapolated virtue values from the neighboring electrodes. After rejection of electrooculography contamination and non-specific artifacts, each set of EEG data (2-epoch) was subjected to Fast-Fourier Transform (FFT) analysis to obtain the absolute EEG band power (µv2) at each electrode in the following seven bands: Delta (0.5–3.5 Hz), theta (4–7 Hz), Alpha-1 (7.5–9.5 Hz), Alpha-2 (10–12 Hz), Beta-1 (14–24 Hz), Beta-2 (24–34 Hz), and Gamma (35–45 Hz). At each 2-min period, EEG was analyzed in 2-s epochs, resulting in 60 epochs. Around 50 to 58 valid epochs in each study condition, on average, were subjected to further analyses. The valid epochs were averaged after the continuous wavelet transform procedure. 15
sLORETA and functional network analysis
sLORETA was used to estimate the intracerebral electrical sources that generated the scalp-recorded activity in specific bands. sLORETA computes electric neuronal activity such as current density (A/m2) without assuming a predefined number of active sources. The sLORETA solution space consists of 6239 voxels (voxel size: 5 mm × 5 mm × 5 mm). sLORETA and functional network analysis were performed by the sLORETA software. Region of interest (ROI) making 2 of Brodmann areas were selected for connectivity analysis. Liner lag ratio was adopted for the connectivity analysis.10,12
The topological characteristics were plotted by Cytoscape 3.60 with the app of MCODE and CytoNCA.16,17 Modules inferred using the default settings that the degree cutoff was set at 2, node score cutoff was set at 0.2, K core was set at 2, and maximum depth was 100. A plug-in Cytoscape CytoNCA, which integrated calculation, evaluation, and visualization analysis for multiple centrality, was proposed to screen essential ROIs. Network topological structure and relationship characteristics, including Betweenness Centrality (BC), Closeness Centrality (CC), Degree Centrality (DC), Eigenvector Centrality (EC), Local Average Connectivity–based Centrality (LAC), Network Centrality (NC), Subgraph Centrality (SC), and Information Centrality (IC), were calculated. 17 The appropriate minimum threshold varies and is determined by the distributions of network nodes and edges. Top 10 essential ROI nodes were screened. Cytoscape and BrainNet Viewer were used to visualize according to the results.
Statistical analysis
The statistical program SigmaStat (SPSS, Inc., Chicago, IL, USA) was used for statistical measure. The p < .05 was considered statistically significant for all tests. Chi-square test was used to analyze gender distribution, and one-way analysis of variance (ANOVA) was performed for education years, Montreal cognitive assessment (MoCA), and Mini-Mental State Examination (MMSE) scores. Statistical analysis for each of the seven EEG bands from 21-ch of EEG and the site/electrode of power was isolated with its value calculated. The raw values, that is, without logarithmic transformation of the EEG values were used for straightforward interpretation of EEG values. Repeated-measures analysis of variance (RM-ANOVA) was used to assess the variation of EEG spectral powers. For the VBM analysis, one-way ANOVA was used to access the variance (p < .05) for values.
Results
The subjects’ cognitive demographic information was listed in Table 1. Subjects were classified into MCI, mild dementia, and healthy control groups. The gender (t = –1.012, df = 193, p = .313) and education years (p > .05) were not significantly different between groups, and the MMSE and MoCA scales were obtained. Mild dementia and MCI groups presented lower MMSE and MoCA scores compared to healthy controls (p < .05).
Demographic characteristics of subjects during groups.

MCI: mild cognitive impairment; MoCA: Montreal cognitive assessment; MMSE: Mini-Mental State Examination.
Indicated dementia and healthy control groups were significantly different.
To obtain the brain atrophy information, a high-resolution 3.0 MRI scan was used for the T1 VBM scans. The digital imaging and communications in medicine T1 files were transformed into neuroimaging informatics technology initiative format for VBM analysis. The gray matter, white matter, and CSF volumes were calculated. T1 structural characteristics of MCI, dementia, and control groups were shown in Table 2.
T1 structural characteristics between groups.
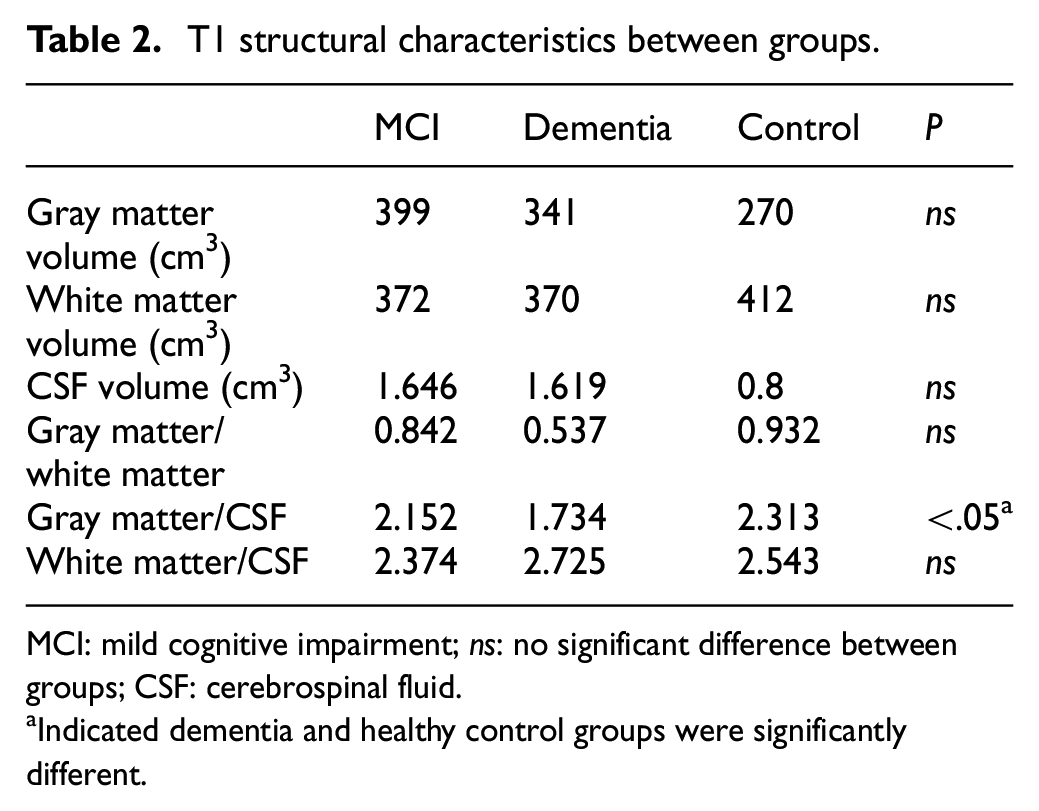
MCI: mild cognitive impairment; ns: no significant difference between groups; CSF: cerebrospinal fluid.
Indicated dementia and healthy control groups were significantly different.
Seven-band spectrum analyses were carried for the MCI, dementia, and control groups. A quantitative analysis of seven-band EEG power showed that the energy power of gamma band increased in mild dementia group compared with the healthy control group (p < .05); the result was shown in Table 3. The gamma band showed statistical significance between the dementia and healthy control groups.
Friedman’s results for each of the three measurements for EEG 7 bands absolute spectral powers (median, µV2).
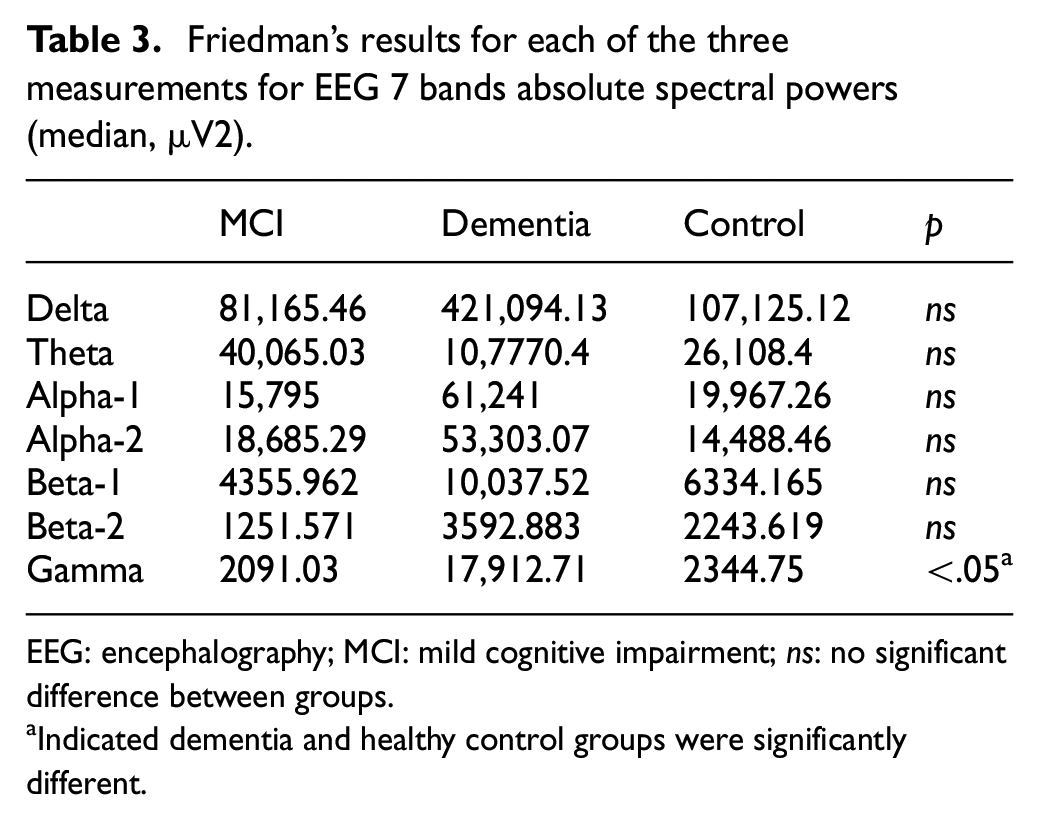
EEG: encephalography; MCI: mild cognitive impairment; ns: no significant difference between groups.
Indicated dementia and healthy control groups were significantly different.
The sLORETA analysis of gamma band, compared with the healthy control group, was shown in Figure 1. As the figure is shown, the gamma power of dementia patients increased in frontal and temporal lobes (p < .05).
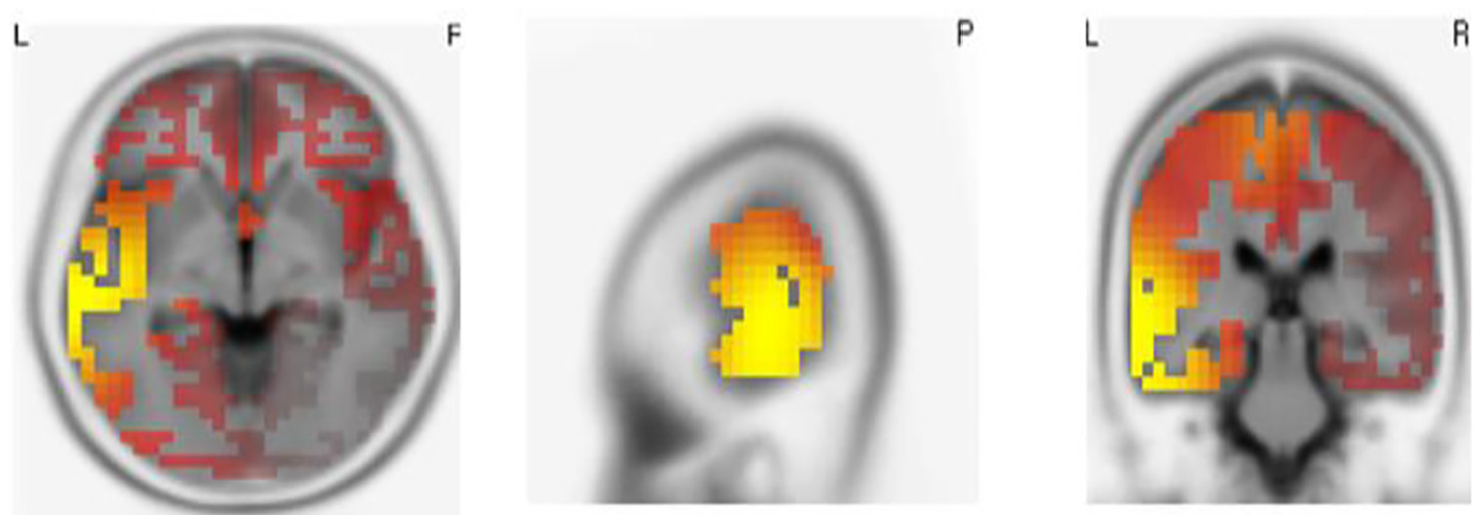
Significant distribution differences of gamma-band sLORETA in mild dementia group compared with the healthy control group. The red and yellow color indicated increased gamma-band power distributions in frontal and bitemporal lobes.
The gamma-band sLORETA was further put into connectivity analysis. The gamma-band sLORETA connectivity network was shown in Figure 2. The dementia group showed more decreased connectivity than increased connectivity compared with the healthy control group.

Significant connectivity of 84 Brodmann areas in gamma-band sLORETA in mild dementia group compared with the healthy control group. Blue edge indicated decreased connectivity, while the red edge indicated increased connectivity in mild dementia group compared with the healthy control group.
For the topological characteristics of the brain network, cluster and degree-based analysis were performed. The network topological analysis was shown in Figures 3 and 4.

Topological distribution of gamma-band sLORETA connectivity network in mild dementia patients compared with the healthy control group. (a) The figure indicates the whole network of gamma-band sLORETA network. The 10 key modules were screened by the topological analysis of the network; BrainNet Viewer was used to visualize the result of the network (shown in Figure 4). (a) Node in the network indicated Brodmann areas; yellow node indicated 10 key nodes screened by CytoNCA. (b, c) Node in the network indicated the subcluster of the whole network.

The 10 key modules screened by topological analysis of the network, BrainNet Viewer were used to visualizing the result of the network. The blue node indicated 10 key nodes, including Brodmann areas: 44R, 7R, 8L, 22L, 47L, 27L, 1L, 1R, 7R, 43L.
Discussion
Dementia refers to the decay of the whole brain, and the underlying pathological process, such as amyloid deposition in AD, often happens before the onset of cognitive dysfunction.18,19 In this study, the VaD patients were adopted; however, the acute stroke and multi-domain stroke were not included in this study. We did not classify MCI into vascular MCI and amnestic MCI (aMCI), for the overlap of the early stage of those pathological process were not further estimated by the molecular dementia biomarkers either in imaging or in CSF. 20 Even most studies follow the routine to classify the patients into distinct pathologies; most of the diagnosis was based on symptom and clinical characteristics instead of hard proof of the pathology or molecular basis. 21 Thus, the functional decay mechanism in dementia in different stages could bring a more systematic and unbiased view of the dementia process. 22
Also, cognitive dysfunction happened before the brain atrophy was discernible or statistically significant.23,24 In our study, the gray matter atrophy was not statistically significant until the gray matter/CSF parameter was adopted. Once the cognitive dysfunction became detectable or recognizable, the instrumental abnormalities could also be traced, 25 and the combination of imaging and EEG dataset was established in a recent study. 26 EEG as a functional aspect, the early correlation changes of cognition had been raised by the previous studies.9,27,28 For example, alpha and delta powers were found to be manifestations of cognitive decline, including MCI and dementia. Cognitive estimation is an objective way of evaluating cognitive decline. In our study, gamma-band power increase and connectivity decrease exit at the same time for the mild dementia patients compared with the healthy control group. The phenomenon indicated the brain conserves aspect to increase the electrophysiological activity but failed to build effective electoral connectivity.
Brain network, such as a sLORETA connectivity network, is composed of nodes and edges. The inherent connections of those nodes and edges could be clustered into subgroups, and the nodes could be screened as hub nodes with high centrality parameters in the similar way the protein–protein interaction network was analyzed. 29 Topological analysis from the network could also be used in the brain network in a more vivid 3D aspect. In this study, the interhemispheric Brodmann areas, such as 44R, 7R, 8L, 22L, 47L, 27L, 1L, 1R, 7R, 43L, were screened as high centralized nodes (as shown in Figure 4). The left hemisphere of the brain weighed more cognition reserve than the right hemisphere,15,30 but the temporal lobe in both hemispheres was involved. The screened module could opt for the neuromodulators in-clinic therapy such as transcranial magnetic stimulation (TMS).10,31 However, our result is based on a comparatively small group, which needs further exploration with larger sample and multi-stage dementia patients to obtain the whole network picture of the transition of the dementia process. Also, the subgroup of aMCI and VCIND patients should be specifically with behavioral observations for the future studies.
Conclusion
Neuroimaging with functional EEG estimates, which employed the bioinformatic analysis frame, could bring a multiple aspect of cognitive disorder patients at different stages. EEG method as well as structural MRI could be used for the evaluation of cognitive disorder patients. The specific sLORETA analysis and connectivity network analysis could shed light on the neuromodulator targets in the early phase of dementia.
Footnotes
Handling Editor: Yuedong Xie
Declaration of conflicting interests
The author(s) declared no potential conflicts of interest with respect to the research, authorship, and/or publication of this article.
Ethical approval and consent to participate
Written informed consent was obtained from each subject in accordance with the Helsinki Declaration; the study was approved by the Hainan General Hospital Medical Ethics Committee (Ethical Approval No. Med-Eth-Re[201957]).
Funding
The author(s) disclosed receipt of the following financial support for the research, authorship, and/or publication of this article: This work was supported in part by grants from the Key Science and Technology Project of Hainan Province (ZDYF2018141). The funding supported the collection, analysis, and interpretation of data. This study was supported by multi-department cooperation.