
Abstract
The terrestrial laser scanning technology is increasingly applied in the deformation monitoring of tunnel structures. However, outliers and data gaps in the terrestrial laser scanning point cloud data have a deteriorating effect on the model reconstruction. A traditional remedy is to delete the outliers in advance of the approximation, which could be time- and labor-consuming for large-scale structures. This research focuses on an outlier-resistant and intelligent method for B-spline approximation with a rank (R)-based estimator, and applies to tunnel measurements. The control points of the B-spline model are estimated specifically by means of the R-estimator based on Wilcoxon scores. A comparative study is carried out on rank-based and ordinary least squares methods, where the Hausdorff distance is adopted to analyze quantitatively for the different settings of control point number of B-spline approximation. It is concluded that the proposed method for tunnel profile modeling is robust against outliers and data gaps, computationally convenient, and it does not need to determine extra tuning constants.
Keywords
Introduction
A variety of research has been carried out in the engineering field to recognize and reconstruct three-dimensional (3D) objects. 1 Terrestrial laser scanning (TLS) has been increasingly applied in the deformation monitoring of tunnel structures, since it can acquire full-field point cloud quickly instead of sparing single points, which is a typical traditional measurement manner. 2 Deformation analysis usually requires the estimation of an analytical model, which could be, for example, a mesh model, cylinder or free-form curve and surface in the case of tunnels. 3 It is sometimes difficult to avoid the existence of outliers and data gaps in the point cloud data obtained by TLS measurement. 4 When gaps or blank exists in the measurement data, the filtering process will not fill the gap area since there is no data obtained with the scanning measurement. 5 The decreased resolution and density can result in a higher uncertainty of deformation analysis. 6 Therefore, a precise approximation is essential for the reliable deformation analysis in the field of engineering applications.
Surface approximation has been employed to establish a surface model and to extract deformation information for the analysis of structures. 7 The benefits of surface approximation lie mainly in the global parametrization and avoidance of noisy and scattered data points. 8 Since free-form B-spline is an indispensable method for global parametrization, the influence of outliers and data gaps on B-splines should be a concern. Outliers can deteriorate the result of B-spline approximation, with the consequence that the result of deformation analysis is inaccurate and unreliable. In adition, data gaps in a point cloud are harmful in B-spline fitting, because the missing data brings about oscillation near the gap area. 9
A traditional way to assure the precision is to delete outliers in advance of the approximation. 6 Some methods used frequently to eliminate point cloud outliers for tunnel deformation monitoring are listed here. Obvious outliers could be removed manually in certain software, and others could be reduced according to the distribution analysis of, for example, longitudinal, surrounding, and random errors of the measurement data. 10 Smoothing techniques were also used to filter the outliers, where segmentations were smoothed by averaging adjacent points. 5 Panholzer and Prokop 11 filtered disturbing objects in the point cloud data using the wedge absolute method, where adjacent points are connected to a laser source and the angle formed was checked with a previously defined angular threshold value to determine disturbing objects. Moreover, a stability test was employed to distinguish outliers and the real deformation, which was performed on a local approximation of the overall analytical model. 11 Segmented planes were computed through principle component analysis and Hough transformation to preserve the main shape of some rocky surfaces. 12 However, these procedures were mostly local, time- and labor-consuming, and relied on the expertise of operators, which could be a problem when processing data of a large-scale, kilometers-long structure. 13
The performance of B-spline approximation with contaminated data was studied in the literature. Predefined parameters of B-splines, such as the number of control points, can affect the performance of B-splines against noise,14–22 and the optimal parameters can be obtained as the values associated with the extremum of the likelihood ratio. 23 Decreasing the model complexity using fewer parameters can filter some noise, but this sacrificed the accuracy of the description of the local shape. A suitable selection of B-spline parameters balances noise resistance and local shape information preservation better compared with polynomials. 24 Combining data from other sensors helped to validate the precision of B-splines constructed from complex point cloud data. 25
Control points determination of B-spline approximation could be counted as one of the most vital steps for point cloud processing. Although plenty of methods of fitting B-splines to measurement data have been introduced,26–28 only a few dealt with a robust method of control point placement which is immune to outliers and gaps in the measurement data, and which, moreover, satisfies a certain tolerance regarding the real shape. To date, the control point positions are obtained mostly through least squares (LS) estimation. 29 Some researchers determined the optimal number of control points, which was usually a model selection problem, by means of the Akaike Information Criterion, the Bayesian Information Criterion, or statistical learning theory. 30 The quality of the control point positions estimated was evaluated by the average estimated standard deviation, which focused on the quality of estimation procedure regarding datasets instead of the real shape of the object. 31 Minimizing energy function has recently been adopted to adjust control points which could be applied in smoothing and gap filling. 32 Xu et al. 33 employed an adaptive robust estimator based on Student’s t-distribution to fit a B-spline curve to measurement data. This estimator involves the degree of freedom of the t-distribution as a parameter or tuning constant, which is adapted to the data given according to the outlier characteristics.
Statistical method based on ranking was first proposed for simple location problems by Wilcoxon 34 and Hettmansperger and McKean. 35 R-estimators have gained increasing attention in geodetic science.36,37 Kargoll 38 described an algorithm for computing R-estimates of the parameters of a general linear model with satellite gravity gradiometer data. Duchnowski 39 adapted the theory of R-estimation to the adjustment of leveling networks with homoscedastic observations in the context of deformation analysis. To the best of our knowledge, the rank-based method has not been studied in the underground space reconstruction and TLS data processing.
Actually, there are not plenty of research works on robust 3D model reconstruction for tunnels. The geometries of tunnels are macroscopic range, from several meters to kilometers. The resolution of tunnel measurement by TLS is ca. several millimeters. This requires a specific B-spline model which could adapt the characteristics of such a structure scale and measurement resolution. Furthermore, measurement data of such structures contain occlusions and blanks, disturbing objects, and coexisting sparse and dense points. This may result in the instability of B-spline approximation, which is unacceptable for the automation process. In this article, we propose a robust solution of such problems based on the rank methods.
The contents of the article are arranged as follows: section “Introduction” introduces the background and the state of the art. Section “Method” is a detailed description of the proposed method, which includes B-spline algorithm, rank-based Wilcoxon method, and the Hausdorff distance method as a metric of the B-spline modeling. In section “Data analysis,” we analyze the tunnel profile based on the proposed method, and compare with LS B-spline approximation and the manually denoised data. The comparative results are presented in section “Results.” Finally, we draw the conclusion of the article in the final section.
Method
B-spline algorithm
The B-spline curve is adopted to reconstruct a 3D model describing the real geometry of the profile. A B-spline curve is defined after equation (1) 40
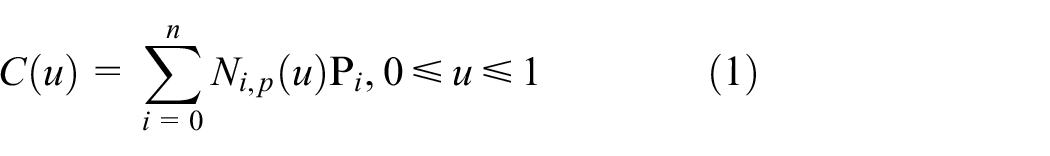
where C(u) is a B-spline curve,

The number of knots is m + 1 and related to the number of control points n + 1 and the degree p by

The control points

The second step for B-spline curve approximation is the knot vector determination. We employ a knot placement technique
41
in this article because it can reflect the distribution of

With
Based on the parameterization and knot vector determination, the basic functions are computed through Cox-de Boor recursion formulas 41

and assembled for design matrix

The unknown control point matrix is obtained through the Gauss-Markov model

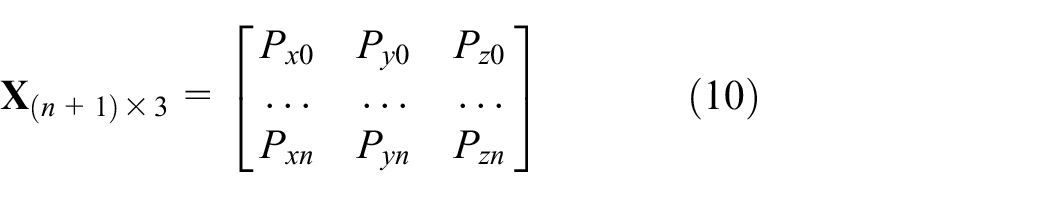
where the observation matrix consists of x, y, and z coordinates of N data points

and the unknown control point matrix is written as
The B-spline method is advantageous for deformation data processing since it is capable of modeling the shape of a structure flexibly. Control point determination is an important step in B-spline approximation, which is usually realized by means of the LS method. This article improves the control point adjustment by employing an R-estimator based on Wilcoxon scores in order to obtain robust B-splines. The main computational framework is shown in Figure 1, where iterative steps are carried out to optimize the control point positions. First of all, we compute the parametrization, knot vector, and control points according to standard methods introduced in Piegl and Tiller.
41
Thereafter, the results of the parametrization and knot vector determination are input into the computing package of the aforementioned R-estimator, which also requires the specification of the design matrix

Framework of rank-based B-spline modeling.
Rank-based Wilcoxon method
B-spline models can be expressed in the form of a linear model

where

is obtained by minimizing the L2 norm

of the residuals

The rank function R assigns to each residual

Thus, the ranks become centered and standardized to emulate the behavior of residuals for any given number n of residuals given in a practical situation. The point of minimizing

regarding the rank-based method much more clearly than in the (leveled) estimated residuals

regarding the LS estimates. Using initial values

with

An iteratively reweighted LS algorithm is formed based on the weight matrix
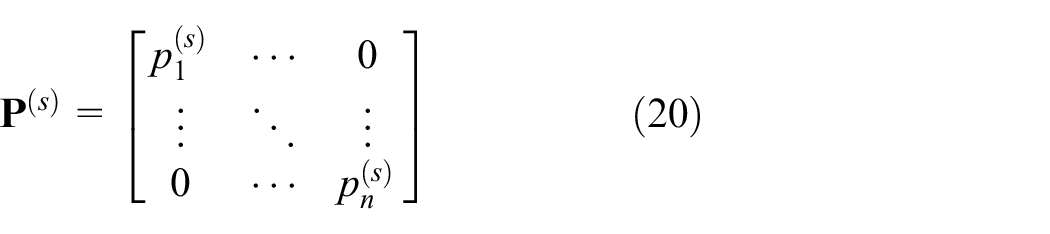
whose individual weights are determined by

where

The Wilcoxon scores used in this article are generated by

where the median
B-spline approximation algorithm is investigated and developed by adopting the R-estimator. Figure 1 presents the framework of rank-based B-spline modeling which involves methods to determine the weight matrix (fw) and the weighted LS fit (fv). 38 An additional weight matrix is estimated based on the initial control points, by executing the weight computing routine fw. Then, the improvement matrix for control points is obtained through the improvement computing routine fv. Subsequently, a decision is made based on the criteria values of improvement and iteration times. If the values pass the criteria, optimal control points will be gained, otherwise, the control points will be updated with the aforementioned improvement matrix.
The key step in the framework is the rank-based Wilcoxon method, which includes weight and improvement computation, as well as the decision-making criteria.
Hausdorff distance
The Hausdorff distance is suitable for many areas, especially for the problem of shape comparison and matching. 44 Hossain et al. 45 investigated a linear time algorithm for computing the Hausdorff distance in the context of content-based image analysis, which is a significant metric in computer vision including image matching, shape retrieval and moving-object detection.
A robust approximation is supposed to be able to eliminate the influence of outliers automatically. Therefore, the performance of robustness is assessed by agreement of the adjusted observations with sets of data which are denoised beforehand (i.e. from which the outliers are removed). The Hausdorff distance is employed to measure the distance between the denoised point cloud and the approximation results. It is defined by equation (24), where a and b are points in two different sets of points A and B, and


The different sequences of point sets A and B express different physical meanings and result in a different distance value. When assessing the B-spline approximation, we consider the denoised data as a reference and match the approximation to the reference.
Data analysis
The original point cloud data is approximated by using the rank-based and LS method, where a comparison is carried out between the two. The algorithm of the rank-based B-spline modeling is presented in Figure 2, where the input data is the measurement data named
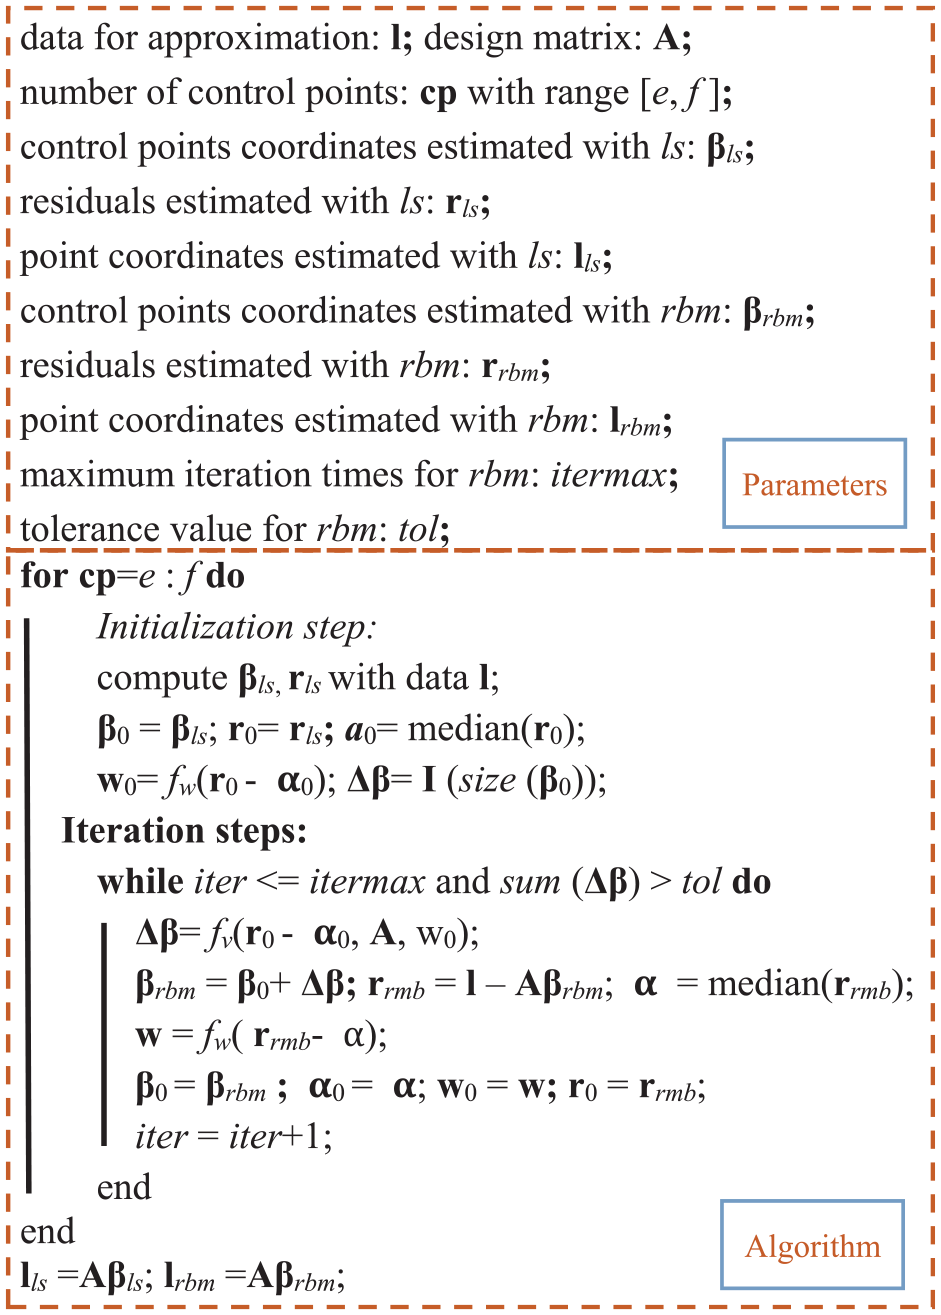
Algorithm of the rank-based B-spline modeling.
The improvement of the rank-based method from the point of infrastructure measurement is shown in Figure 3, where the point cloud depicts the tunnel profiles. The dimensions of the tunnel is 2.5 m in height and 5.5 m in width. The tolerance value tol adopted for rank-based B-spline modeling for the tunnel profiles is 10e-6. In order to bring out the difference between the rank-based and the LS method visually, the B-spline approximations involving different numbers of control points (cp) are shown for the same point cloud in Figures 3(a)–(c), where the cp is varied from 7 to 9. In each of these figures, the blue points represent the point cloud data with noise (including outliers) and the red and green lines represent the B-spline fitted by means of the rank-based and the LS method, respectively.

Comparison between the rank-based and LS method: (a) cp = 9, (b) cp = 8, and (c) cp = 7.
It can be observed in Figure 3(a) that the rank-based method produces a solution that is practically unaffected by the outliers, whereas the LS solution is clearly attracted by the outliers near the bottom of the region indicated by the dashed blue line. As the tunnel structure itself does not sag in reality, the former solution is much more realistic than the latter, especially in the virtual box of Figure 3(a). It is concluded that under the same conditions, the rank-based method is more robust than the LS method when cp = 9.
According to the virtual box of Figure 3(b), the LS method is more sensitive to noise than the rank-based method when cp = 8. However, the rank-based solution for cp = 8 is notably less smooth than the rank-based solution for cp = 9. It is, thus, revealed that the rank-based method is rather insensitive to the outliers but quite sensitive to the choice of the number of control points.
It can be discovered that the rank-based method is still more robust than the LS method when cp = 7, as indicated by the virtual box of Figure 3(c). In comparison to the Figures, the difference between the rank-based and the LS method is diminished. It means that if the number of control points are fewer, the under-fitting condition of the B-spline will affect the optimization effect of the rank-based method. Thus, it is qualitatively confirmed that the rank-based method has superior robustness than the mostly adopted ordinary least square (OLS) in current literature works, and under the same conditions, the optimization performance of the rank-based method is related to the number of control points.
Results
The Hausdorff distance, which describes how far away two subsets of a metric space are from each other,46,47 is employed to quantitatively analyze the improvement of the rank-based over the LS solution. The numerical values of this distance measure are shown in Table 1 for three different point clouds (“Data1,”“Data2,” and “Data3”).
Comparison of the rank- and LS-based B-spline modeling.

cp: control point; rbm: rank-based method; LS: least squares.
The improvements of the rank-based method over the LS method are calculated by means of the formula (
Considering the accuracy of the B-spline modeling highly depends on the number of control points, the optimal parameters selection are significant for the deformation analysis based on TLS measurement. Table 1 reveals that these three data have reached the maximum value of improvement when cp = 10. Taking the fitting speed of large structures into consideration, the optimal number of control points for the tunnel cross section is 10. In future, we will carry out model selection method in order to check the optimal number of control points of the B-spline modeling. The benefit of the proposed method is the automation and robustness in the parametric surface modeling without point cloud preprocessing which could significantly reduce time- and labor-consuming for large-scale structures.
Conclusion
In this article, a rank-based algorithm, which is a robust and intelligent method immune to outliers and data gaps, was adopted for B-spline approximation and applied in the context of tunnel profile analysis. Outliers and data gaps of point cloud data generally lead to imprecision of the fitted B-spline model. The traditional method of deleting the outliers before the approximation is time- and labor-consuming for large scale structures. To alleviate these burdens, we use the rank-based Wilcoxon method to adjust B-spline control points, which can automatically be immune to the influence of outliers and data gaps, thus, reconstruct robustly the tunnel models. In summary:
To date, less consideration has been given to the robustness of control point determination. In this article, the rank-based Wilcoxon method is employed in the particular context of approximating tunnel profile measurements, and the results are compared with those obtained via the LS method.
Qualitative comparisons between the rank-based and LS methods are presented with various numbers of control points. The result imply that the rank-based method has a comparative advantage in the large projects, especially for high requirements of time-consuming and at the same time need to consider the robustness.
Hausdorff distance is involved to analyze the improvement of the rank-based to LS method quantitatively and the relation between the improvement and the number of control points was investigated.
The rank-based method can reduce the time and labor cost of denoising for mass point cloud data fitting, thereby this method can improve the fitting efficiency significantly, especially for many large projects, such as extra-long tunnels and bridges.
Consequently, the robustness of the rank-based Wilcoxon method contributes significantly to the intelligence of the free-form modeling to the computational efficiency of handling large-scale projects. In a future study, we will investigate the parameters of the rank-based method and compare them with other robust methods. Artificial intelligence technology will be combined for an automatic identification of parameters of the rank-based method for intelligent modeling.
Footnotes
Acknowledgements
The authors would like to acknowledge the support of Natural Science Foundation of Jiangsu Province (No. BK20160558). The authors also wish to acknowledge the support of all the colleagues in Geodetic Institute of Leibniz University Hannover.
Handling Editor: Vittorio Memmolo
Declaration of conflicting interests
The author(s) declared no potential conflicts of interest with respect to the research, authorship, and/or publication of this article.
Funding
The author(s) disclosed receipt of the following financial support for the research, authorship, and/or publication of this article: The publication of this article was funded by the Open Access Fund of the Leibniz Universität Hannover.