
Abstract
Advanced robotic systems will encounter a rapid breakthrough opportunity and become increasingly important, especially with the aid of the accelerated development of artificial intelligence technology. Nowadays, advanced robotic systems are widely used in various fields. However, the development of artificial intelligence-based robot systems for structural health monitoring of tunnels needs to be further investigated, especially for data modeling and intelligent processing for noises. This research focuses on integrated B-spline approximation with a nonparametric rank method and reveals its advantages of high efficiency and noise resistance for the automatic health monitoring of tunnel structures. Furthermore, the root-mean-square error and time consumption of the rank-based and Huber’s M-estimator methods are compared based on various profiles. The results imply that the rank-based method to model point cloud data has a comparative advantage in the monitoring of tunnel, as well as the large-area structures, which requires high degrees of efficiency and robustness.
Introduction
Intelligent robotic systems will achieve significant development utilizing the rapid breakthrough of artificial intelligence (AI) technology and it will become increasingly important in various fields.
Background
Nowadays, advanced robotic systems and AI-based approaches are being investigated in many fields, constantly integrating and changing human lives profoundly, especially in the field of intelligent transportation. For example, autonomous fusion of vision and laser based on convolutional neural network (CNN) was applied for vehicle environment 1 ; a hardware platform was employed for an intelligent vehicle based on a driving brain 2 ; multi-view clustering was studied based on graph regularized nonnegative matrix factorization for object recognition 3 ; and a framework was investigated for road traffic risk assessment with a prediction model. 4 Vision-based measurement is an important input for skills of robots, such as real-time object recognition, 5 simultaneous localization and mapping, 6 and guidance and control of vehicles 7 . It is noteworthy that vision-based robotic systems are gaining increasing attention for health monitoring of large-scale structures like tunnels and rails, where one important issue is to detect automatically deformations and damages of the structures monitored. This requires not only the recognition and localization of object but also the refined modeling of structures indicating the change of structure itself with time.
Intelligent modeling which are robust, highly adaptive, and reliable show great prospects in the field of structural health monitoring. Finotti et al. 8 employed artificial neural networks and support vector machines to model structural changes and suggested the adoption of statistical indicators for structural alteration assessment. The effectiveness and computational cost of various AI-based models were investigated for structural damage detection. 9 A support vector machine algorithm was developed based on point clouds for the semantic analysis of spatial design support and security domains. 10 The AI-based modeling and interpretation from point cloud data is applied in monitoring roads, buildings, and so on. 11 Concerning tunnel modeling based on point cloud data, high-accuracy models mainly rely on removing the noisy and disturbing points with filtering strategies. For example, Schotte et al. 12 used commercial software to discard noisy points before model construction. Delaloye et al. 13 adopted averaging method to remove the noises beforehand. Arastounia 14 refined tunnel models by residual analysis and Baarda’s data snooping method to eliminate outliers. These filtering methods need extra time consumption and human labor as well as expertise. The issue of intelligent and robust point cloud modeling for the structural health monitoring of tunnels is still challenging.
Motivation
In this study, terrestrial laser scanning (TLS) technology, which is a noncontact spatial data acquisition method with high precision, speed, and resolution, characterizes the tunnel structures using massive 3D points. High-accuracy model reconstruction of the tunnel is carried out based on the 3D points. Considering the noise and uncertainties which could result in the instability of the 3D modeling, the rank-based method (RBM) has been adopted to obtain the most robust model parameters. Reliable structural health monitoring relies on sufficient data collection to capture the status of the structures.
The statistical learning theory has been developed as a branch of machine learning since the last century and has made a great contribution to AI theories. This article focuses on AI-enabled structural health monitoring with laser scanning technology and the nonparametric statistic method, which could improve the robustness, reliability, and efficiency of geometric modeling. We aim at a geometric inspection of tunnel structures, which contain, for example, noises, data gaps, and disturbing points; therefore, the prompt and accurate assessment of the tunnel structures is challenging. In this article, the rank-based model is integrated into geometric parametrization to construct efficient and accurate geometric models which could be applied to recognize deformations and damages.
The TLS technology performs in an area-oriented measurement manner, offering full-field measurement data and acquiring more comprehensive structural information to compare with traditional single-point measurement technology. The theories and methods of TLS have been widely studied to solve the assignments of the structural health monitoring which is employed for various monitoring tasks, for example, tunnels, bridges, and rails. 15 –22 The TLS combined with robotic systems have great prospects, especially for application in the area of intelligent health monitoring. 23 –29
This article is structured as follows: the first section gives an introduction of the research background and motivation; the second section presents the mathematical methods of robust modeling using B-spline surface; the third section describes the details of data used in this study, including simulated data and tunnel measurement data; the fourth and fifth sections show the analysis results of the simulated and measurement data; lastly, the sixth section draws conclusion of the study.
Robust modeling with B-spline surface
The B-spline curve approximation, which is defined as equation (1), 30 is applied for geometric modeling based on point cloud data

where C(u) is corresponding to a B-spline curve defined on parameter value u,

where the

where

is obtained by minimizing the L 2-norm

of residual ri , where N is the total number of residuals. The RBM is used in this article, which is shown in equations (6) to (9). 31 The RBM minimizes the linear combination of ri with the aid of Wilcoxon score

where

In order to solve the minimizing function regarding
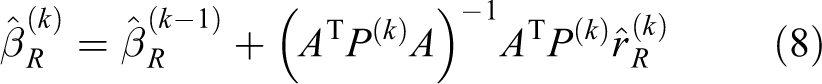
In equation (8), the weight matrix

where the
Data introduction
Simulated data and profile measurements are investigated in this article where noises of normal and Rayleigh distribution are considered in comparing the B-spline modeling performance of RBM, Huber’s M-estimator (HUB), and LS method.
Simulation data
In the simulated data, normally distributed noise is generated to test the performance of robust modeling method. Ground truth points consisting of x and y coordinates are computed after cosine equation (10)

The range of x coordinates is [1, 7.5], so that the shape generated is about 6.5 m of width and 4.5 m of height, which is comparable to the size of the tunnel profiles. Thereafter, zero-mean normal distribution noise is added to the ground truth data. One set of simulated data with normally distributed noise is presented in Figure 1.
The blue curve is the ground truth and the black points are the generated points with normally distributed noise in Figure 1 where standard deviation

Simulated data with normally distributed noise.
More data are generated with normally distributed noise and listed in Table 1, where DA and DB are the data sets generated, given specified mean value (denoted by mean) 0 mm, standard deviation (denoted by
Overview of generated data.

In order to compare the noise resistance of RBM, more complex noise of Rayleigh distribution is simulated whose probability density function is given by equation (11)

It could be synthetized based on a uniformly distributed random matrix through equation (12)

where U(0,1) is the uniformly distributed noise whose mean is 0 and variance is 1.
Tunnel profile
The rank-based B-spline approximation is tested on various data sets of tunnel profiles. The scanned point cloud data containing approximately 10 million points are shown in Figure 2, where the green color indicates that the points have higher intensities of laser reflectivity and the blue color corresponds to a lower intensity. The point cloud data are preprocessed in MATLAB to extract equal-distance 100 profiles, where it is assured that the points in each profile are coplanar.
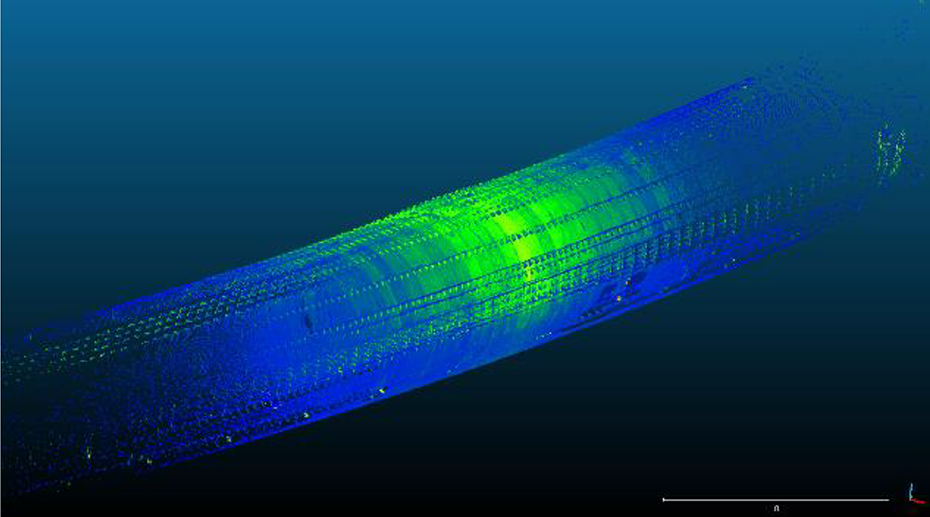
3D point cloud data tunnel with TLS measurement. TLS: terrestrial laser scanning.
Overview of the tunnel data sets is described by range noise and the total number of points. The range noise is related closely to the intensity by 32

Here a and b are estimated parameters of a specific laser scanner. Using the laser scanner Z+F IMAGER 5006 manufactured by Zoller+Fröhlich company, we have the parameter a = 1.617 m and the parameter b = −0.571. 32
A figure of range noise is presented in Figure 3(a), where the X-axis is intensity data and the Y-axis is the range noise computed by equation (13). It is hinted in Figure 3(a) that the range noise decreases with increasing intensity value. The mean intensity value of each extracted profile is shown as the blue line in Figure 3(b), where the X-axis is the tunnel profile sequence along the central axis of the tunnel. It is noticeable through Figure 3(a) and (b) that the range noise in the middle part of the tunnel could be as small as several millimeters, but it increased to about 40 mm at the two ends of the tunnel. Another metrics of the data is the total number of points. Because all the tunnel profiles are of the same scale, the larger number of points means the higher point density. The orange line in Figure 3(b) indicates the number and density of points are very high in the middle part and decrease sharply toward the two ends of the tunnel. It is hinted that there is a high percentage of sparse data which will challenge the approximation tasks.
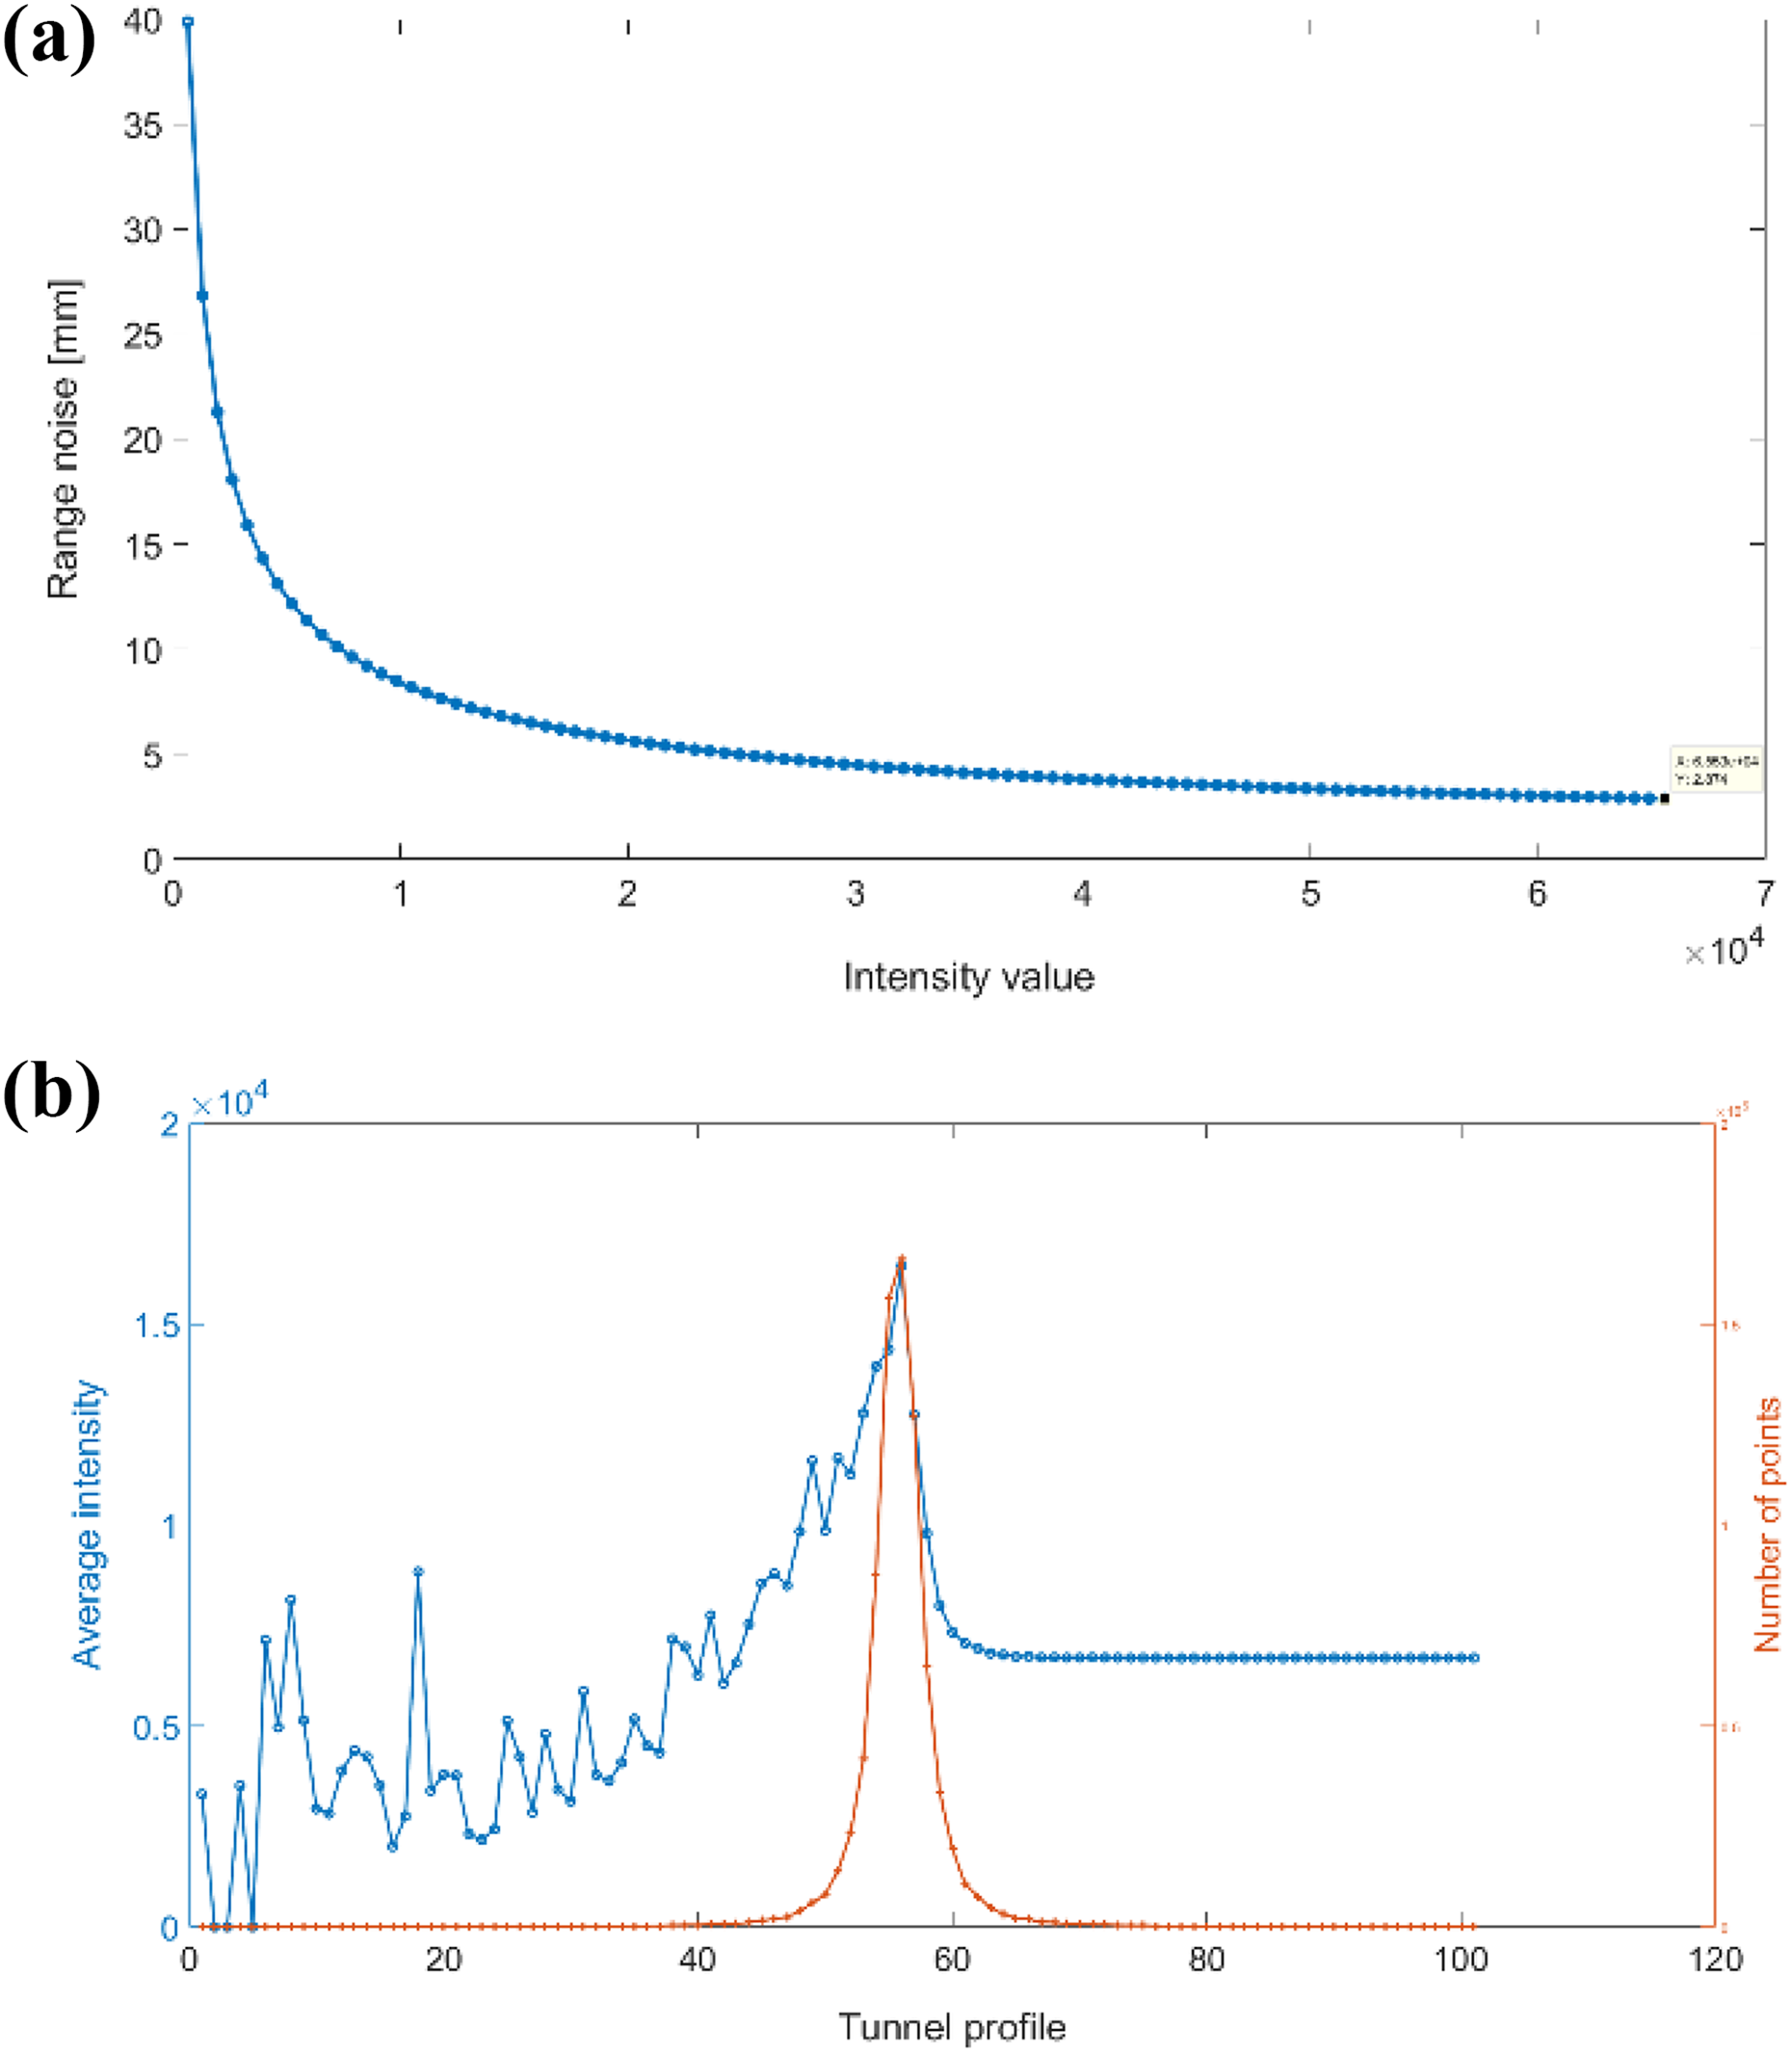
Tunnel profile description: (a) relation of range noise and intensity and (b) profile intensity and number of points.
Simulation results
Criteria of accuracy assessment
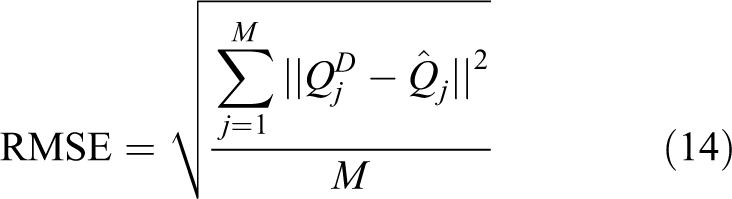
Root-mean-square error (RMSE) was computed as a quantitative metric of quality to acquire a rigorous accuracy assessment. Suppose there is a data set of M denoised points
Simulation data analysis results
The simulated data with normally distributed noise are analyzed and the results show similar trends, and thus one result corresponding to Figure 1 is selected as a representative. B-spline estimation with RBM, HUB, and LS are investigated and compared based on the simulated data. The result of RMSE for the simulated data with varying

RMSE for the simulated data with varying
Figure 4 shows the RMSE of three approximation methods on the simulated data, where the X-axis is the
Considering the complexity of the actual project, Rayleigh distributed noise is also involved to judge the superiority and advantage of the RBM and HUB method which is compared and presented in Figure 5.

RMSE with Rayleigh distributed noise. RMSE: root-mean-square error.
It is observed in Figure 5 that the RBM is obviously better than the Huber method when the point cloud data contain more complex noise such as Rayleigh noise.
Tunnel analysis results and discussion
Three profiles are adopted to compare RMSE and time consumption in Table 2.
Comparison of tunnel profiles data.

RBM: rank-based method; LS: least squares; HUB: Huber’s M-estimator; RMSE: root-mean-square error.
The RBM-based method is tested with tunnel profile data sets and the RMSE and computational cost are compared among the RBM, HUB, and LS, which are listed in Table 2. According to Table 2, the RBM and HUB methods have smaller RMSE than the LS method, which can both improve significantly the robustness of the model. Furthermore, compared with the HUB method, the RBM method has the advantage in terms of time consumption which can be observed from the bold font in Table 2. The computer has a 3.4 GHz CPU and 8.0 GB of RAM, the version of MATLAB adopted is R2017a. According to Table 2, the superiority is in turn HUB, RBM, and LS method in terms of RMSE, but it is in turn LS, RBM, and HUB method in terms of time consumption. It reveals that the Huber method may obtain better robustness, but the RBM gain lower time-consuming performance than Huber method. Therefore, it is implied that the RBM has a comparative advantage in the large projects, especially for high requirements of time-consuming and at the same time need to consider the robustness.
According to the comparative analysis of RBM, HUB, and LS methods, the RBM is more suitable for the higher requirement of efficiency and robustness, especially for the large-scale engineering projects, such as tunnel structures. Therefore, the RBM is adopted to optimize the surface approximation of tunnel structures. The B-spline surface modeling is presented in Figure 6, where the yellow surface corresponds to the rank-based B-spline surface, the blue surface is the LS-based B-spline surface, and the red point denotes point cloud data. The black curves are the approximated curves of the netted points in two directions, which are illustrated in the bottom left of Figure 6. The point cloud data were originally scattered, which may cause disorder in the B-spline surface if adopted directly. In order to obtain the smooth surface model of tunnel structures, the points are sampled in two directions: one is along the tunnel axis and the other is in the plane of the tunnel profile.

Comparison of RBM and LS methods. RBM: rank-based method; LS: least squares.
A novel sampling method is proposed based on a vertical rectangular network which divides the tunnel into two symmetrical parts to obtain the sample points intelligently. The two sides of the rectangular are marked with red arrows in Figure 6, where the vertical and horizontal sides are divided equally to form a network. The parameters of the network can be automatically adjusted according to the requirements of arbitrary segmentation surface models. With the aid of a projection of the point cloud onto the network surface, the sampling points are achieved by means of searching for the closest point to each of net point. The data are rotated so that the tunnel axis is parallel to the Y-axis to achieve an efficient projection of the point cloud.
Considering the high efficiency and robustness requirements of large-area structural geometry modeling, the free-form surface modeling of a 10 m long tunnel structure is shown in Figure 7, where the blue surface is the rank-based B-spline surface and the red point is the point cloud data. In Figure 7, the red points are denser in the middle of the top side of the tunnel, because this area is the standpoint of the TLS scanner, and more point cloud data are gathered. The black curve is the approximated curve of the two directions of B-spline surface, which is curved due to the nature of the points sampled.

B-spline modeling of tunnel structures with RBM. RBM: rank-based method.
In order to investigate the accuracy of surface modeling of tunnel structures, the residuals are studied and described in Figure 8, which corresponds to the residuals of the X-direction.

Residual of surface modeling of tunnel structure.
The blue lines in Figure 8 depict the residuals of the approximated surface in an X-axis direction, which is the length direction of the tunnel, and the point index denotes the numbering of the B-spline surface points, which traverses each tunnel profile successively. According to Figure 8, it can be observed that the residuals achieve the minimum value around the middle of the point index, which is probably due to the varying data qualities along the tunnel axis. Higher intensity will reduce the residuals because the intensity of the point cloud decreases when the scanning distance increases. Therefore, it is hinted that intelligent robotic systems can effectively improve the surface modeling accuracy and time consumption.
According to the comparison of tunnel profile data, the B-spline surface modeling based on the RBM is more suitable than the HUB method for high-efficiency and robust surface modeling of large-area structures. Since the efficiency of B-spline surface modeling based on the LS method is the highest, it is also recommended that the B-spline surface modeling with the LS method is adopted when the model accuracy requirements are not critical.
The comparison of the RBM and LS method for B-spline surface modeling is shown in Figure 9, where the blue and yellow surfaces are the RBM and LS-based B-spline surfaces, respectively, and the red point denotes the data point. It can be observed that the B-spline surface model of the tunnel exhibits regional symmetry according to Figure 9. It may be found that some disturbing objects are covering the tunnel structures. Considering the specific distribution of the point cloud, there could be cable channels in the corresponding regions of the tunnel. It is hinted that B-spline surface modeling with various robustness methods can achieve the intelligent clustering of 3D point cloud data through combining deep learning theory.

Model comparison of RBM and LS methods. RBM: rank-based method; LS: least squares.
Conclusions
The structural health monitoring of large-scale construction structures is becoming more intelligent and convenient, incorporating the fast development of robotic systems and AI technology. This article proposed an RBM B-spline surface modeling method which could reconstruct an automatic and robust surface model based on the laser scanning point cloud data to improve the quality of 3D parametric as-built modeling and the efficiency of detecting the structures’ deformation. The contributions and conclusions are summarized as follows: A novel method is proposed to search the sample points taking advantage of the point cloud projection and network to reconstruct a flexible tunnel surface model. Adjustment of the network parameters is possible to reach the requirement of modeling arbitrary segmentation of the tunnel structure. An integrated B-spline surface modeling method is proposed by means of nonparametric rank theories to achieve a robust surface model. The Wilcoxon score is employed to model the residuals and reweighted LS is used to solve the unknown parameters of the B-spline. The RMSE and time-cost are adopted to survey the performances of various methods for tunnel profile modeling. It is proved that the B-spline surface modeling based on the RBM is more suitable than the HUB method for high-efficiency and robust surface modeling of the long-distance tunnel. The RBM is adopted in the tunnel data where both the curve and the surface model are constructed and the RMSE and time consumption of the RBM and HUB method are compared with various profiles.
In summary, we propose the rank-based B-spline method, which has a comparative potentiality in the modeling of large structures, especially for the high requirements of efficiency and robustness of modeling.
Footnotes
Declaration of conflicting interests
The author(s) declared no potential conflicts of interest with respect to the research, authorship, and/or publication of this article.
Funding
The author(s) disclosed receipt of the following financial support for the research, authorship, and/or publication of this article: This work was supported by the Natural Science Foundation of Jiangsu Province (no. BK20160558) and the Geodetic Institute. The publication of this article was funded by the Open Access Fund of the Leibniz Universität Hannover.