
Abstract
This article presents an easy-to-deploy and low-cost Internet of Things infrastructure for gait characterization based on a set of wireless inertial sensors, called nodes, connected to the same local area network. These nodes allow acquiring inertial raw data from the trunk of each frail elder involved in explicit gait trials carried out directly in the elderly care homes. The Internet of Things infrastructure has been validated for Quantitative Gait Analysis showing an adequate accuracy in the demarcation of relevant gait events and in the estimation of stride interval variability. The latter, in combination with other characteristics that are commonly used to assess the state of frail elders and which come from anthropometric, biological, nutritional, functional, and mobility domains, allows us to perform a cross-sectional cohort study and a subsequent multiple logistic regression to evaluate their impact on cognitive functioning. The cohort study and the multivariate regression are performed using a sample of 81 frail elders from two nursing homes in Spain. The results obtained indicate that frail elders aged 90 years or older, with moderate dependence in daily functioning and with a stride interval gait variability greater than 6%, were most likely to suffer cognitive impairment, representing what is called cognitive frail.
Keywords
Introduction
Limitations in mobility, the ability to move one’s body, interfere with functioning and are a cause of loss of independence. 1 Gait is the most relevant manifestation of mobility capacity and, in this sense, there is plenty of research that has addressed gait characterization as a widely used physical marker to assess the onset of functional dependence.2–7
In the particular context of frailty assessment in the elderly, gait characterization also plays a major role to describe physical functioning.8–10 Frailty can be understood as a geriatric multifactorial syndrome recognizable by an increased risk of adverse health outcomes due to cumulative decline of multiple physiological systems. 11 The Fried frailty phenotype, 12 which is considered the most standardized definition of this syndrome, also encloses the observation of gait changes, specifically slowness in gait as a relevant variable related to functional decline.
Without a doubt, preserving functional capabilities becomes a crucial objective in the elderly and gait exercise is the most effective non-pharmacologic intervention to promote active aging and to delay functional decline which leads to frailty. 13 Beyond functional and gait domains, the frailty phenotype proposed by Fried relies on other dimensions, such as anthropometric, nutritional, and physiological to characterize the progression of frailty, which includes energy dysregulation, chronic undernutrition examination, loss of muscle mass combined with grip strength estimations, and self-reporting of exhaustion and weakness. However, it does not consider the cognitive functioning dimension and mental state. In this sense, the relationship between frailty and cognition (and vice versa) remains unclear in the Fried phenotype. 12
Although studies focused on the relationship between frailty and cognition are still scarce, some contributions can be found looking for associations. Research efforts in this regard have reported that correlations between the severity of cognitive impairment and frailty syndrome become stronger as the frailty state gets worse, also increasing the occurrence of other adverse health outcomes (functional disability, hospitalization, and mortality).14–17 In fact, there is evidence that cognitive impairment improves the predictive validity of the operational definition of frailty, because it increases the risk of adverse health outcomes. According to the study carried out by Ávila Funes et al. 18 involving 421 frail elders, those with cognitive impairment are significantly more likely to develop disability in activities of daily living (ADLs) and instrumental ADLs over the following 4 years than those frails without cognitive impairment. This mutual influence between frailty and cognitive impairment has been referred to as the cognitive frail state. 19
Mainly, these associations in the cognitive frail state are found in longitudinal studies that consider a full-range of frailty and cognitive impairment conditions and also mild and moderate dementias in their samples of elders. The Fried phenotype is generally used to characterize the frailty state (non-frail, prefrail, and frail). Regarding cognition, the Mini-Mental State Examination (MMSE) 20 is commonly used in screening tests for cognitive impairment. The original tool introduced by Folstein et al. in 1975 is a 30-point questionnaire, which examines functions such as registration (repeating named prompts), attention and calculation, recall, language, ability to follow simple commands, and orientation. It is used extensively in clinical and research settings. For instance, the 35-point variation from Lobo et al. 21 is very popular in Spain.
However, cognitive assessment is less standardized than frailty evaluation, leading to the development of many specialized cognitive tests for particular situations. 22 Cognitive assessment depends more on conditions such as the elder’s educational level, the elder’s daily functioning, and whether he or she is living in community or not. Furthermore, it relies upon other aspects such as the specificity of the assessment tool, for instance, if it is focused more particularly on screening for dementia (e.g. the Isaacs Set Test (IST)), 23 or if it is intended for cognitive impairment assessment to follow the course of cognitive changes over time (MMSE).
Some of the screening tests are directly administered to the elders (this is the case of the MMSE), while others consist of patient interviews and a reliable informant or collateral source (e.g. formal/informal caregiver). An example of the latter is the Clinical Dementia Rating Scale (CDR), 24 which is based on a semi-structured interview enclosing not only cognitive aspects but also aspects about daily functioning.
The CDR has six different domains (memory, orientation, judgment and problem solving, community affairs, home and hobbies, and personal care). In this case, the functional dimension is approached with a high level of abstraction not taking into account mobility or aspects such as gait characterization. The CDR test has been used, together with other cognitive impairment predictors, to analyze the annual conversion from Mild Cognitive Impairment (MCI) to dementia from various recruitment sources and living environments. 25 The related studies reflect differences in the rate of conversion from MCI to dementia, ranging from 10% to 15% in those that use clinic samples,26,27 while conversion rate in community-based studies is substantially lower,28,29 ranging from 3.8% to 6.3%. The studies conclude that functional state estimation (regardless of using CDR or other similar functional marker) is the only objective manner that helps to account for this bias in the nature of the sample. 25
Therefore, after introducing, (1) the associations between frailty and gait characterization (from a functional perspective), (2) the associations between frailty and cognition, and (3) the most relevant cognitive impairment screening tools and the importance of functional assessment in the diagnosis of cognitive impairment are discussed. In such a context, the need also arises to study the relationship between gait and cognition.
Related work
While, at first glance, gait might appear an automated task, it is connected to the executive brain functions that allow the adequate performance in simultaneous actions. Gait requires inputs from the motor cortex, cerebellum, and the basal ganglia, as well as feedback from visual, vestibular, and proprioceptive sensors to produce the coordinated muscle firings and limb movements that comprise the gait cycle. 30 With this in mind, gait is not a simple (physical) task, but a high cognitive complexity task involving nervous system, muscle activation, and joint movements.
Neurophysiological changes due to the effect of aging affect gait and, particularly, they produce a high impact on the correlation patterns between strides.31,32 In the same way, changes in neurological function related to pathological issues also affect gait variability. There are several studies that investigate the effect of neurodegenerative diseases such as Huntington’s disease, 31 Parkinson, 33 or some types of dementia 34 in gait variability. In the same vein, there are also works focused on the relation between the onset of cognitive impairment and gait disturbances, such as increasing gait variability 35 or gait slowing. 36
In the study of gait variability, most researches have focused on stride-to-stride fluctuations, also named stride-to-stride variability, or simply gait dynamics. 37 Many works quantify the magnitude of the stride interval variability by using linear estimators (e.g. coefficient of variation (CV) or standard deviation).38,39 Overall level of consistency in the gait cycle is estimated by these dispersion measures. 34
There are different quantitative approaches to estimate stride intervals, from arrays of pressure sensors embedded in insole-based devices 40 or in sensitive walkways, 41 to networks with multiple inertial devices arranged on the body, known as Body-Area Networks (BANETs) or, even, a single inertial device attached to the trunk.42,43 There are also solutions based on Computer Vision, 44 which are able to segment heel-strike (HS) events that mark the beginning of strides from RGB or depth cameras.
As outlined in the “Introduction” section, there is a peer influence between frailty and cognition. Particularly, it has been proven that daily functioning capabilities directly affect cognitive assessment, which is remarkable in the prediction of conversion from MCI to dementia. Also, it has been pointed out in this section that the appearance of gait disturbances may be related to the onset of cognitive impairment and its progression.
As part of this contribution, we attempt to characterize the elder’s daily functioning capabilities in a holistic way: first, through the administration (via formal caregiver) of a functional assessment scale to examine the performance in ADLs (Barthel scale) 45 and, second, through another functional scale of lower level of abstraction focused on examining the mobility capacity (Tinetti Performance Oriented Mobility Assessment (POMA)). 46 Both are complemented by quantitative gait characterization through the developed IoT (Internet of Things) infrastructure. We have focused our attention on elderly in assisted living facilities (elderly care homes). That is why we have developed an easy-to-deploy and low-cost IoT infrastructure for gait characterization in these environments. Functional domain is complemented with other characteristics from anthropometric, nutritional, and physiological domains to go deeper into the frail state characterization.
Objective
The proposed IoT infrastructure is one more tool in the study of associations between characteristics used to describe frail condition and mental state in frail (elders diagnosed as frail according to the Fried frailty phenotype) elderly people.
Specifically, we try to infer which is the impact on mental state of several characteristics that help to go deeper into the specific frail condition. These characteristics come from functional and mobility (gait characterization), anthropometric, biological, and nutritional domains. Cognitive state is determined by the Spanish variation of the MMSE test (Lobo et al 21 ). The set of variables for the rest of the domains will be introduced in the cross-sectional study detailed in the subsequent section.
The main contributions of this work can be described as follows:
The development and validation of an IoT infrastructure for gait characterization. It consists of wireless inertial sensors (nodes) attached to the trunk of each elder, specifically to the thoracic area. The nodes only require a Wireless Local Area Network (WLAN) in order to acquire inertial raw data during explicit gait trials performed in the elderly care homes. Inertial raw data are processed offline to demarcate relevant gait events and to segment stride intervals. Mean and CV of the stride intervals are computed to characterize gait.
Performing a cross-sectional cohort study (descriptive statistics) focused on elders previously diagnosed as frail according to the Fried frailty phenotype. The sample of frail elders is divided based on the presence of cognitive impairment, estimated by the 35-point MMSE variation. 21 The study allows to statistically analyze the prevalence and the effect on mental state of separate variables from functional and mobility domains, including gait characterization through the IoT infrastructure (1), and also anthropometric, biological, and nutritional domains.
Fitting a multidimensional logistic regression model (inferential statistics) used to infer information about the combined impact on the mental state of domains, variables, and categories that were considered in the cross-sectional cohort study (2).
The following sections address each of these contributions.
IoT infrastructure for gait characterization
The specifications of the IoT infrastructure developed for QGA (quantitative gait analysis) are presented in this section. The infrastructure will be used to assess gait variability (stride interval variability) in frail elders through explicit gait trials carried out in the elderly care home’s facilities. Objective information about gait variability, gathered using the infrastructure, will serve to characterize elder’s mobility, together with other scores obtained in functional scales. These variables, along with others from the rest of the domains considered, will be used in the descriptive statistical and in the logistic regression studies to analyze and discover associations between frailty and cognition (mental state).
An overview of the IoT infrastructure for QGA is shown in Figure 1. The infrastructure can be divided into three different layers: Sensor layer, Analytics and Intelligence layer, and Communication layer.
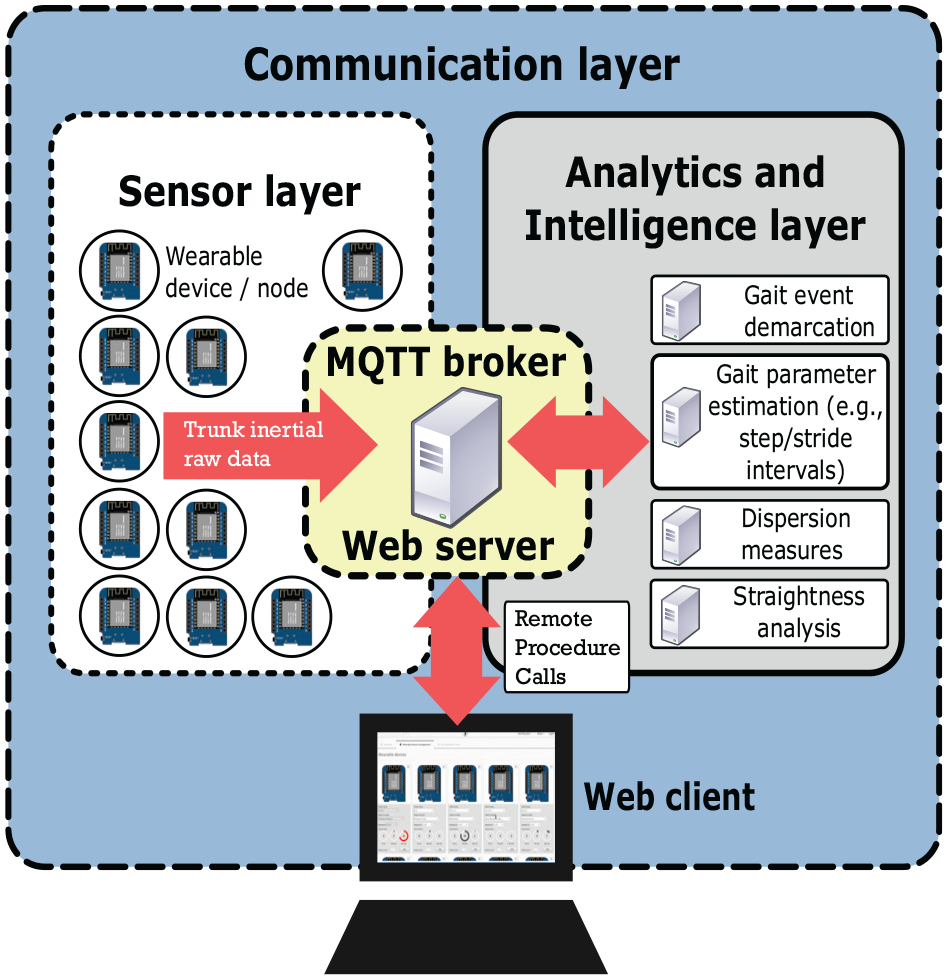
Overview of the IoT infrastructure for QGA.
The Sensor layer contains a set of wearable inertial sensors (nodes) connected to the same WLAN. Each of the nodes is attached to the upper cloth of one elder, close to the T1 thoracic vertebra. A two-piece magnetic gripper is used for clamping, as shown in the scheme in Figure 2 and in the bottom-right corner in Figure 3(a). Each wearable device is equipped with an ESP826612E (Espressif Systems Inc., Shanghai, China) SoC (System on Chip), which integrates a 32-bit RISC Tensilica Xtensa LX106 micro-controller and a 802.11 b/g/n Wi-Fi transceiver. This configuration enables serial I2C communication with a single InvenSense MPU-6050 6DoF IMU (6 Degrees of Freedom Inertial Measurement Unit (tri-axial accelerometer + tri-axial gyroscope)) (InvenSense Inc., CA, USA).
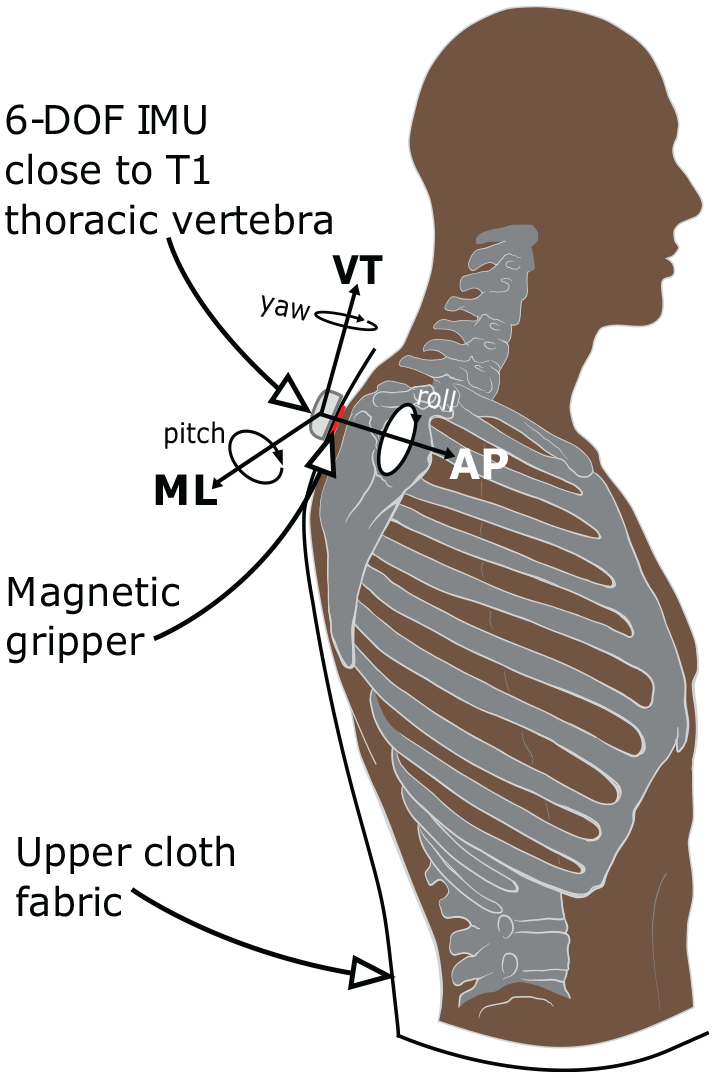
Scheme showing the position of each wearable device (node) attached using the magnetic gripper. Vertical (VT), antero-posterior (AP), medio-lateral (ML) axes, and Euler angles are displayed.

Details of the nodes in the sensor layer: (a) hardware inside each wearable device and image of the magnetic gripper used to attach it to the upper cloth, (b) inertial-based node placed in the T1 thoracic region (upper back). It was used to acquire trunk accelerations and orientation angles during explicit gait trials.
The MPU-6050 includes an onboard Digital Motion Processor (DMP) in its chip. The DMP fuses the accelerometer and gyroscope data together to minimize the effects of errors inherent in each sensor. The DMP computes orientation after data fusion in terms of quaternions and then converts it to Euler angles avoiding gimbal locks. All this processing is done internally (by the DMP) without intervention of the ESP826612E connected via I2C, freeing it from that computing load. InvenSense does not reveal the fusion algorithm used to combine the data and to estimate orientation angles from accelerometer and gyroscope data.
Finally, the wearable device is powered by a 1000mAh Li-Po battery. Figure 3(a) shows the hardware that makes up one node which is enclosed in a three-dimensionally (3D) printed ABS plastic case. Figure 3(b), for its part, shows one node placed in the right position during an explicit gait trial performed by one elder involved in the study.
The Sensor layer makes possible to acquire trunk accelerations and orientations from each elder during explicit gait trials in the elderly care homes and transmit these raw data to a local server (broker) using the MQTT (Message Queuing Telemetry Transport, a lightweight application protocol on top of the TCP/IP protocol based on publication/subscription policies to defined messages, known as topics) messaging protocol. MQTT is commonly implemented in IoT networks for managing sensor data transmissions between machines. The IoT infrastructure is capable of transmitting trunk accelerations and orientations from various nodes simultaneously to the broker at 50 Hz uniform sample rate. This frequency is adjusted on the basis of the results obtained by Antonsson and Mann, 47 where the recommended minimum sampling rate is higher than 30 Hz to clearly demarcate gait events.
We get to use two inertial nodes working simultaneously in the explicit gait trials carried out in the elderly care homes. Therefore, two elders were performing the gait trial simultaneously most of the time.
The Analytics and Intelligence layer communicates with the MQTT broker to perform different processes, as shown in Figure 1. The Gait event demarcation service is subscribed to the sensors/imu_raw_data/# topic, acquiring trunk accelerations and orientation angles (Euler angles) from the nodes, together with corresponding timestamps and node identifiers. It is an offline service which implements an algorithm to demarcate HSs (the gait events that occur when heels contact the ground for the first time, which marks the beginning of new strides) and toe-offs (TOs) (the gait events that occur when toes lift off the ground, which represents the final period of foot contact followed by a swing phase).
The algorithm for gait event demarcation from trunk accelerations was presented in our previous paper. 43 It allows us to identify HS and TO events from acceleration signals through the scale-space filtering idea. Cut-off points between filtered acceleration signals as a result of convolving with varying levels/scales of Gaussian filters and other features against temporal variation and noise are used to identify peaks that correspond to these gait events.
The algorithm in González et al. 43 was tested on an LSM330 digital tri-axial accelerometer and digital tri-axial gyroscope (STMicroelectronics; Geneva, Switzerland) embedded in an Android mobile phone. The sampling rate was set to 70 Hz and the mobile phone was positioned lower than the nodes of this infrastructure, specifically over the second lumbar vertebra (L2) using a customized belt with the screen facing away. This algorithm has been reused in the Analytics and Intelligence layer of this infrastructure to demarcate gait events from data gathered by the nodes. Its behavior is adequate, according to the validation performed with different participants without apparent problems on the gait and ranging from 25 to 65 years old. Validation is explained in detail in the following section.
The algorithm works practically “out of the box” at the new position of the IMU (vertebra T1 instead of L2) and with the new sampling rate (50 Hz instead 70 Hz). The new configuration does not require to modify the scale-space filtering procedure nor the kernels of the Gaussian filters, independent of this change in frequency. It is only necessary to adjust the predefined energy threshold, originally set to 0.13, to 0.11 according to the new higher position of the IMU to avoid the loss of possible local maxima when gait is not so energetic. Please see the algorithm details in González et al. 43
In addition to the gait event demarcation, other processing stages are performed in the Analytics and Intelligence layer. Step and stride intervals are computed by simply counting the time difference between demarcated HSs. This is done by another offline service after gait event demarcation. Furthermore, the step/stride interval time series from the last processing stage are used to obtain averages and dispersion measures: mean, cadence (number of steps per minute), and CV, all useful for gait characterization.
Finally, abrupt changes in the time series of the yaw orientation angle (angle on vertical axis, as shown in Figure 2) can be determined for straightness analysis. This serves to segment straight paths and to discard turns within explicit gait trials. The screenshot in Figure 4(a) shows the viewer tool provided by the developed Web client (Communication layer). Particularly, a fragment of an explicit gait trial is appreciated in the figure. The first plot shows trunk accelerations in the three axes (with interactive option to zoom in/out), as well as the instants of demarcation of HS and TO events. For its part, the second plot shows the trajectory of changes over time followed by the yaw orientation angle. The segments with slope close to zero (horizontal) correspond to fragments in which the participant who performed the trial was following a rectilinear trajectory. Inflection points and steeper slope segments correspond to turns when the end of the straight path was reached and the participant had to turn around and continue walking.

Details of an explicit gait trial: (a) the viewer tool included in the Web client application. Trunks accelerations and changes in the yaw angles are displayed together with demarcated heel-strikes and toe-offs. (b) Older woman walking at natural pace during an explicit gait trial. The Web client appears in the image controlled by an operator in charge of stopping the gait trial.
A snapshot made during an explicit gait trial performed in one of the elderly care homes can be seen in the Figure 4(b). An older woman, who participated in the study of associations between frail and mental state, walks at a natural pace following a straight line from one end to the other of a 10-m long room.
The Web application in the Communication layer concludes the specifications of the IoT infrastructure for QGA, see Figure 1. The client side is implemented combining HTML5, CSS3, and JavaScript and it incorporates AJAX (Asynchronous JavaScript And XML) calls to make the necessary HTTP requests to the Web server (running on the same machine as the MQTT broker). The server side implements a set of RPCs (Remote Procedure Calls) in a Java EE (Java Enterprise Edition) application to respond to the client requests. The Web application provides an interface to add or remove nodes and to manage the nodes connected in order to start/stop a new gait trial. Moreover, it allows us to navigate between the explicit gait trials carried out previously and to see the details and gait characteristics of any of them, as shown in Figure 4(a).
Infrastructure validation for gait characterization
The validation of the IoT infrastructure is necessary to test the accuracy achieved by the reimplementation of the algorithm from González et al. 43 with a different IMU (MPU-6050), different sampling rate (50 Hz), and a higher position on the trunk (T1 vertebra).
For this purpose, a setup composed by a 6.5-m hall with an RGB camera (camera using the Red, Green, and Blue color model) mounted orthogonally to the gait trajectory is used. The camera captures a side/lateral view of the gait trials. Specifically, the video acquisition device is the Kinect version 1 (Microsoft Corporation; Redmond, WA, USA), because of the wide-angle lens that mounts its RGB camera. The Kinect has a sampling rate of 30 frames per second.
Using the described setup, recorded gait trials are then reproduced in slow motion (at 0.25× playback speed) using VLC media player software 48 to manually identify HS and TO events. Timestamps from gait events, marked by hand, are considered the ground truth source for the accuracy comparison. Manual marking has an approximate error margin of ±1 frame (±33.3 ms) with regard to the real gait event occurrence.
A test operator is in charge of manually starting or stopping the explicit gait trial by using the Web client application of the IoT infrastructure (Communication layer). The first HS inside the field of view of the camera is used to manually synchronize gait event occurrences.
A total of 16 gait trials have been recorded for this experimentation. The differences in milliseconds between the ground truth (manually marked gait events) and the estimations made by the algorithm from González et al. 43 (reused in the IoT infrastructure) are analyzed. Each participant carried out two gait trials. The 16 gait trials are broken down as follows: four male participants in the 25–35 age range (eight gait trials), two female participants in the 45–55 age range (four gait trials), and two male participants in the 60–65 age range (four gait trials). All participants have a healthy gait cycle without any gait pathology or known problem.
An example of the results of a gait trial is shown in Table 1. The differences in milliseconds between the considered ground truth timestamps and those from the algorithm are exposed. As can be seen in this particular test, there are overestimates of the HS and TO around 70 ms and underestimates of the TO over –50 ms, in the worst case.
Example of results of a gait trial from a 48-year-old female participant without visible gait impairments.

Figure 5 details the differences found for all the explicit gait trials, between the ground truth and the gait event estimations made by the algorithm in the IoT infrastructure. One HS and two TO events are undetected or missed in the experimentation and there are no false positives in the whole set of gait trials. Considering all participants have a healthy gait cycle (without any visible gait disturbance to the naked eye when walking), the average difference in HS estimation is 35.6 ± 21.5 ms and the average difference in TO estimation is 43.5 ± 18.2 ms. Thus, the results are adequate holding this average. As can be seen in the graphs in Figure 5, only few samples are over a difference of 70 ms in both cases, HS and TO event estimations. The accuracy achieved is similar, slightly worse in TO estimation.

Gait event demarcation differences between the ground truth and the IoT infrastructure: (a) heel-strike absolute differences, (b) toe-off absolute differences.
Once the IoT infrastructure has been validated for offline gait event demarcation through explicit gait trials, we decided to integrate QGA and, specifically, stride interval mean and stride interval variability characteristics together with other functional and mobility assessment scales in the descriptive statistical (cross-sectional) and in the logistic regression studies detailed below.
Cross-sectional cohort study
The aim is to describe the sample of frail elders who participated in this cohort study and in the logistic regression model fitted later. The sample is analyzed, in statistical terms, observing the prevalence and the effect on mental state of separate variables from functional and mobility domains, including gait characterization through the validated IoT infrastructure, in addition to anthropometric, biological, and nutritional domains. The sample of frail elders is divided into two groups based on the presence of cognitive impairment or not (cohort variable). This is determined by the criterion followed by the Spanish variation of the MMSE test: 21
MMSE score
Summary description of the elders, the dimensions, the variables considered, and the protocol followed to accomplish the explicit gait trials are specified below.
Subjects, variables, and protocol
Figure 6 provides a visual overview of the sample of participants. A much more complete and exhaustive description of the sample can be seen in our conference paper. 49 The sample consists of 81 older people diagnosed as frail, according to the Fried frailty phenotype, from two elderly care homes: Residencia Andamarc and Residencia Asistida de Ancianos, both in Ciudad Real (Spain).

Bar chart describing the distribution of the sample of frail elders according to different variables from anthropometric-, biological-, nutritional-, functional-, and cognitive-related characteristics.
Multiple dimensions used for frail state characterization are assessed. Specifically, age and sex are included, in addition to the BMI (body mass index) from the anthropometric dimension. Nutritional domain is considered through the Mini Nutritional Assessment (MNA) test. 50 The biological domain is also taken into account by obtaining proteins, cholesterol, leukocytes, and lymphocytes levels. Moreover, criteria for estimating the elder’s performance in ADL are taken into account through the Barthel test. 45 Mobility performance is evaluated through the POMA. 46 It should be emphasized that POMA test not only examines gait but also balances abilities in its score.
The Tinetti test is complemented by quantitative gait analyses performed in both elderly care homes using the IoT infrastructure. In particular, stride intervals are computed from the demarcated gait events while walking at natural pace on a 10-m long path. Each explicit gait trial lasts 1 min 30 s long per elder, so that an appropriate number of strides is acquired to estimate the stride interval average and variability. When the end of the walking path is reached, the elder turns around and continues on its way in the opposite direction until the time of the trial is over (see Figure 4(a) and (b)).
Segments of inertial raw data that correspond to turns are discarded from each explicit gait trial, as stated before in the IoT infrastructure specifications. This is done in this manner since accelerations and decelerations carried out during the turns distort the strides performed at normal pace, skewing the normal gait pattern of each elder.
Finally, MMSE is included as the variable that differentiates the cohort groups, as indicated before, see Figure 6. All variables are categorized as shown in that figure. Categorization of characteristics is a required procedure in order to move from continuous values to discrete sets of states for the multiple logistic regression analysis conducted afterward.
Descriptive analysis
Because the sample size consists of 81 participants, which is not too much to deal with the subsequent regression procedure using continuous variables, the categorization allows us to reduce data complexity and extract latent summarized information with greater power meaning. In other terms, the categorization makes possible to cut down data complexity from continuous variables to “singular units of meaning” (categories), highlighting the systematic structure behind the original dataset and retrieving conceptual meaning from the acquired data. This preprocessing is appropriate because of the small sample size of this study. As will be explained in the multidimensional regression model section, our efforts were first directed to use a multiple linear regression with continuous variables; however, the moderate linear correlations between variables and the small sample made this model not to converge. For this reason, descriptive analysis and subsequent regression have been performed with categorized variables.
The bar chart in Figure 6 provides the description of the sample of this study at a single glance. Each bar in the graph represents the stratification of the sample in terms of percentages or relative frequencies for each of the 13 categorized variables considered, 12 independent variables plus the dichotomous variable MMSE, which will be the dependent variable in the subsequent logistic regression.
The sample is made up of 81 participants, all older than 75 years, with the group of 90 years of age or older being the largest (≈35%). Practically, half of the sample were men and the other half (48%) were women. Regarding the BMI, it was categorized according to the standard classification into percentage ranges from normal state (<25% of BMI) to obese (≥30%) state, passing through intermediate percentages that indicated the overweight state. Looking at the bars on the graph for this anthropometric characteristic, the percentage of elders with normal weight was lower (≈18%) than those with overweight and obesity, both categories around 40% of the sample.
Moving from anthropometric to nutritional domain, the 30-point MNA scale 50 has been used to characterize nutritional state. This scale and the characteristic derived from it in this descriptive analysis comprise three groups: normality (≥24 points), risk of malnutrition (17 ≤ MNA ≤ 24), and malnutrition (<17). Figure 6 shows that approximately 40% of the sample was at risk of malnutrition, while the remaining had a normal nutritional condition. There were no malnourished elders. Within the biological domain, the following characteristics obtained from blood tests have been considered: levels of leukocytes and lymphocytes measured in microliters, proteins measured in grams per deciliter, and cholesterol level in milligrams per deciliter. The four variables were divided into three categories (low, normal, high) according to reference values accepted by health specialists. The categories are shown in the bar chart in Figure 6. It can be seen that around 70%–75% of participants had normal concentrations of leukocytes and lymphocytes, while ≈20% had low concentrations, which could be risky depending on how far they deviate from normal values. Also, there were proteins deficiencies (≤6 g/dl) in approximately 20% of the sample. For cholesterol, almost 90% of the sample was within the normal range. 51 The rest of the elders had high cholesterol ([200, 240]).
As for the Barthel index, severe functional dependency was not represented by the sample. Thus, moderate and mild dependencies and functional independent categories were included. No category prevailed over the rest, with the functional independent being the smallest number in the sample (28.4%), compared with 37% of the mild dependence and 34.6% of the moderate dependence category. Because of particularities of the sample, the Tinetti test had more discriminatory power than the Barthel scale between the participants. In particular, 44.4% of frail elders had moderate risk of fall, while 22.2% reflected an increased severe risk of falling. One-third of the sample had more than 24 points in the Tinetti test, which indicates proper gait and balance. Again, categories predetermined by the test were used. In order to reinforce mobility assessment with more quantitative techniques for gait characterization, and taking into account the importance of stride-to-stride (stride interval) variability in the related work looking for associations between gait performance and cognitive impairment, 52 we incorporated stride interval mean and CV as two more explanatory variables in the functional and mobility domains. These gait parameters were obtained by using our validated IoT infrastructure and the explicit gait trials. Stride interval mean was divided into four categories. The lower and upper ones were determined according to the stride interval series observed in our previous empirical study involving an elderly population and gait trials. 44 Elders without gait impairments carried out explicit gait trials providing stride intervals ranging from 900 to 1550 ms in that work. With that in consideration, two categories, <1000 and ≥1400 ms, were included in addition to two inner equidistantly separated categories in [1000, 1200) and [1200, 1400) ms for the current study. The bar chart in Figure 6 concludes that frail elders with stride interval means within the <1000 ms category was the emptiest (≈15% of the sample).
Categories for the stride interval CV were also selected based on CVs collected from works about stride interval variability in elders with/without falling history.38,44,53 These studies provided comparable results. Elders with a history of falls with CV values around 3.0% ± 2.8%, and those without falling history (adequate gait and balance) ranging from 1.7% to 2.6% for the stride interval CV. Thus, stride interval variability above 6% of CV is considered high. Only about 12% of the sample had it.
Finally, the 35-point MMSE variation 21 showed that ≈70% of the sample was likely out of cognitive decline risk regarding the MMSE criterion (MMSE ≥ 23). On the contrary, about 30% had a score below 23 points, which reflects a high probability of cognitive problems.
Before accomplishing the logistic regression, the categorical variables reflected in the chart in Figure 6 have been individually compared to the MMSE through the chi-square test of independence. It has allowed us to discover whether there are significant dependencies between each explanatory variable (separately) and the MMSE.
The null hypothesis (independence) is rejected if the p-value is less than 0.05, which means a 5% significance level is adopted. Null hypothesis rejection means that there is association between the explanatory variable being checked and the MMSE. Those variables showing relationship with MMSE are the ones that will be considered later in the multiple logistic regression analysis.
Comparison of mental state (represented by the MMSE dichotomous variable) and the rest of explanatory variables
Table 2 contains the comparison of mental state, represented by the MMSE discrete variable (high presence of cognitive impairment when MMSE score is below 23 points) and the rest of explanatory variables used in frailty assessment. Each row in Table 2 contains details for each explanatory variable. The distribution of participants in the different categories that make up the explanatory variable, together with a more detailed bar chart containing the presence of cognitive impairment for the considered categories, is illustrated in each row. Finally, the p-value estimated after the chi-square test between the explanatory variable and the MMSE is provided for each case.
Results of comparison between explanatory variables and MMSE (mental state).

MMSE: Mini-Mental State Examination; CV: coefficient of variation.
The p-values from chi-square tests are provided to study significant associations. BMI = body mass index; MNA = Mini Nutritional Assessment.
Chi-square test.
Significant associations.
Individual correlations are marked with an asterisk in the table (*) according to the chi-square test results. We found relevant separate correlations between (1) age and mental state (MMSE), obtaining a p-value = 6.6 × 10⁻⁵; (2) Barthel scale and mental state, obtaining a p-value = 0.0008; (3) Tinetti test and mental state, obtaining a p-value = 0.003; and (4) stride interval CV and mental state, obtaining a p-value = 0.0006. In other terms, being 90 years or older was strongly correlated with the presence of cognitive impairment; being moderately dependent on the Barthel scale, scores in the [61, 91) interval, correlated individually with the presence of cognitive impairment; also elders in moderate and severe risk of falling (scores ≤ 24 in the Tinetti test) correlated individually with the presence of cognitive impairment; and finally, large stride interval variability correlated individually with the presence of cognitive impairment marked by the MMSE.
The other variables were not related to the MMSE (not rejecting the null hypothesis in the chi-square tests) and excluded from the subsequent multidimensional logistic regression.
Multidimensional regression model
At first, our intention was to use the sample to fit a linear regression model for the MMSE variable considering it continuous (uncategorized). This inference model would serve to analyze the combined impact on mental state (MMSE score) of domains, variables, and categories considered in the cross-sectional cohort study.
Factor analysis (FA) technique was tested in an attempt to construct the regression model. FA can find latent relations (factors) between explanatory variables simplifying the multiple linear regression model and reducing its dimensionality. Factors may be interpreted as patterns of association between these resultant variables with particular influences on the dependent variable (MMSE score). These patterns are easily human-readable.
Nevertheless, this method requires a high linear relationship among explanatory variables and no multicollinearity. For our study sample, the analysis of linear correlations showed that there were low to intermediate correlations (
Once FA was ruled out, binomial logistic regression 54 was considered to fit the regression model for the MMSE score. Logistic regression is better placed to deal with non-highly correlated variables than FA. In addition, it also fits better when the sample is not large, as in this case (n = 81). Despite this, binomial logistic regression has the disadvantage of providing a single binary categorical response (MMSE dependent variable) from multiple explanatory variables which can be discrete or continuous. For that reason, we adjusted the binary categorical response to match the threshold that determines whether there is cognitive impairment or not, according to the criterion followed by the 35-point MMSE variation.
Beyond being used for inference purposes, the binomial logistic regression model allows us to analyze the impact of explanatory variables (characteristics to go deeper into the frail state) on the probability of cognitive impairment, which is the main goal of this section.
Particularly, the multidimensional logistic regression has been performed for age, Barthel, Tinetti scoring, and the stride interval CV in contrast to the MMSE dependent variable. The first was the explanatory variables that had significant (individual) associations with MMSE during the Chi-square tests.
The R software (a free environment for statistical computing and numerical analysis) 55 has been used to fit the multidimensional logistic regression model. As set out in the “Results” section, the model did not converge at the first time using the implementation of the binomial logistic regression algorithm in the R package. It gave large standard errors. The issue was solved through the bias reduced method of logistic regression proposed by Firth 56 implemented in the brglm package.
Results
Since the results of the validation of the IoT infrastructure for gait characterization have already been presented in its particular section, the current one is focused exclusively on detailing the results of the multiple logistic regression. It explains which is the combined impact on mental state, specifically on the presence/absence of cognitive impairment, of the characteristics related to the frail state. These results are inferred from the study sample. In essence, they help to discover associations between frailty and cognition.
The binomial logistic regression algorithm implemented in R (glm() function) suffered from the phenomenon known as “perfect separation,” when feeding it with our data. It failed to fit the regression model at the first attempt. The standard errors for the parameter estimates became very large, which was indicating the occurrence of the perfect separation issue. This problem is common in unbalanced binary models 57 where the separation manifests itself if one (or more) independent variables divides equally zeroes and ones values in the dependent one (MMSE in our particular case). A form of penalized regression was used to solve the separation issue allowing the model convergence, generating suitable deviation standard errors. Specifically, the probabilistic method created by Firth 56 helped us to minimize the bias of maximum likelihood estimations.
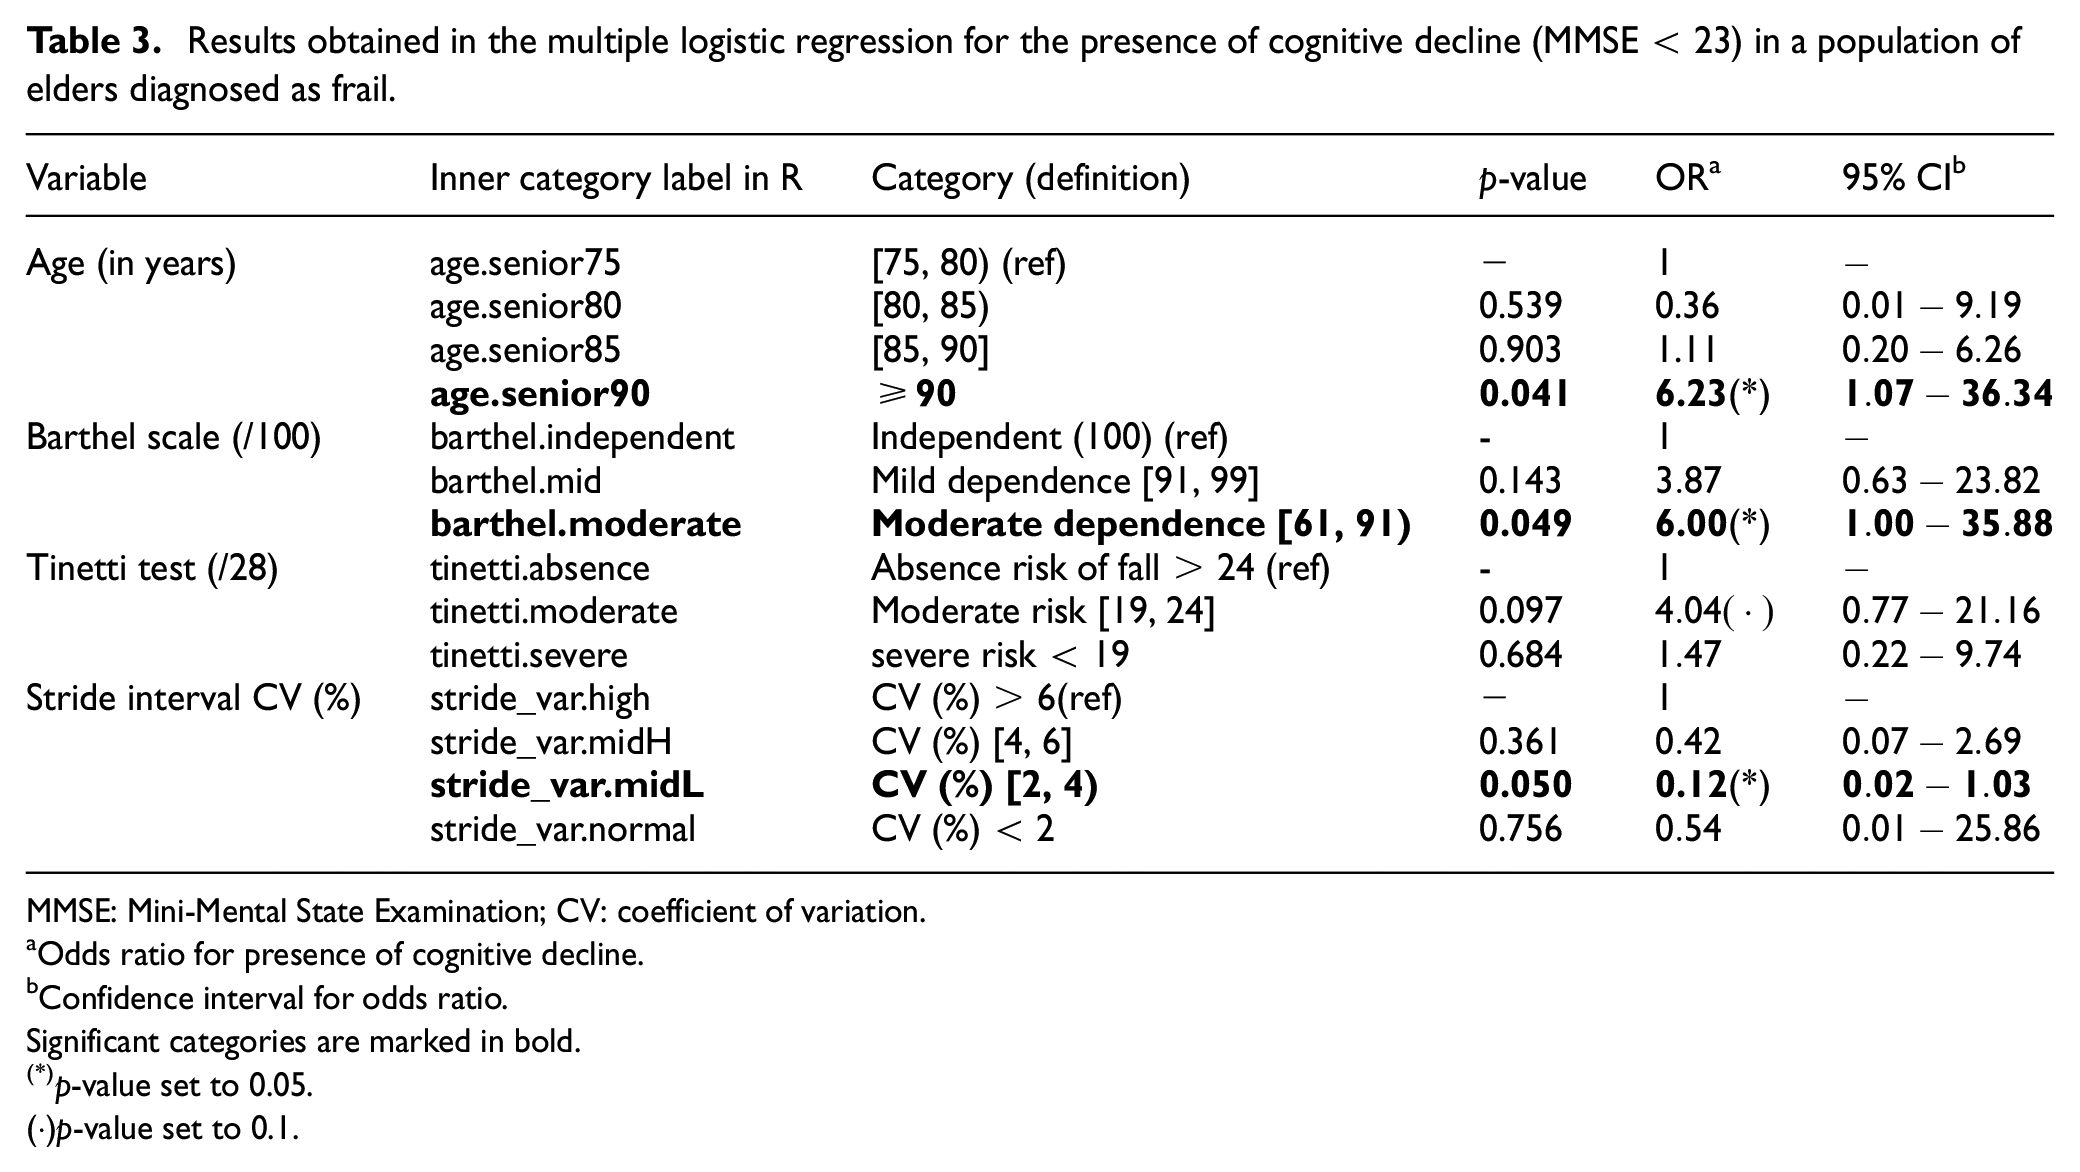
The Firth’s method was used to fit a logistic regression model for the MMSE related to the selected variables (age, Tinetti and Barthel marks, and the stride interval CV). Outcomes are presented in Table 3. It can be seen from the table that the odds ratio (OR) for the elders with high probability of mild cognitive decline was 6.23 greater in elders aged 90 years or above, unlike others aged 79 years or below. According to the p-value, set to p = 0.05, the level of significance for the remainder categories of age was over this value in the consequent model; thus, associations with MMSE could not be determined.
Results obtained in the multiple logistic regression for the presence of cognitive decline (MMSE < 23) in a population of elders diagnosed as frail.
MMSE: Mini-Mental State Examination; CV: coefficient of variation.
Odds ratio for presence of cognitive decline.
Confidence interval for odds ratio.Significant categories are marked in bold.
p-value set to 0.05.
(·)p-value set to 0.1.
Concerning the Barthel functional test, frail elders with moderate dependency level, with rating values within the [61, 91) interval, had OR six times higher than those with a score of 100 in the Barthel functional scale. It means that these elders had six times more probabilities of suffering cognitive impairment (MMSE < 23) than those without functional issues. The significance level of mild dependence category (see Table 3) raised a value of 0.143 which is higher than the 0.05 p-value threshold, avoiding the existence of associations between the occurrence of cognitive impairment and mild dependence in Barthel scale.
Every OR in the Tinetti test categories exceeded the significance level (>0.05). Scores in the range of [19, 24] had an OR close to 4; however, assumptions should not be done because the p-value for the moderate risk was above 0.05 (p-value = 0.097), as indicated previously. Nonetheless, a larger study sample would probably made this category fit in the 0.05 p-value. Looking at the moderate risk of falling category in the Table 3, adopting a significance level below 0.1 could confirm a probability four times higher of having cognitive impairment in comparison with those participants without risk of falling (>24).
Paying attention to the stride interval CV variable, once the logistic regression is performed, it can be seen that the [2, 4) category falls within the significance level (p-value = 0.050), rejecting the null hypothesis. Therefore, it can be inferred a potential association, in relation to cognitive decline, between the categories of frail elders with stride interval variability above 6% (chosen as the reference category) and stride interval variability within the [2, 4) range, as a result of the regression. However, the association is negative, as reflected by the OR which is <1 (OR = 0.12). An OR equals to 0.12 means that the [2, 4) category is
It should be noted that the presence of an OR <1, for the particular case of the stride interval CV, is the result of executing the implementation of the bias-reduced logistic regression method, proposed by Firth, and included in the R package brglm. This implementation takes the inner labels used in R to name the different categories in each variable (see Table 3) and chooses the first category label in alphabetical order as the reference one for each of the dependent variables in the regression. In the specific case of the stride interval CV, the reference category (the first category label in alphabetical order) encloses frail elders with a stride interval variability above
Another way of interpreting the previous OR can be performed by alternating and taking as reference the [2, 4) category, which shows lower risk of cognitive impairment. In this sense, it is required to simply invert the OR (take the reciprocal of OR). That is, frail elderly population with a stride interval variability greater than 6% has 1 / 0.12 = 8.33 times more likely to suffer cognitive impairment in comparison with frail elders in the [2, 4) range.
Discussion about the discovery of associations between frail state and cognitive impairment
The multiple logistic regression has resulted in a set of significant ORs which were highlighted in Table 3 and detailed in the previous section. This information, inferred from the sample of frail elders, has been used to evaluate the impact on mental state, in terms of the presence/absence of cognitive impairment, of domains and candidate variables that were included after the cross-sectional study. As it will be explained below, not all were significant.
Starting with the anthropometric domain, the chi-square tests did not provide significant relationships that could be generalized to the population of frail elders between [sex and MMSE] and [BMI and MMSE]. Conversely, age characteristic had significant association with MMSE, being the only anthropometric characteristic considered in the regression analysis. Specifically, the results showed an increased tendency to suffer cognitive impairment in frails aged 90 years old and above, in contrast to elders aged 80 years old and below.
According to the chi-square tests, neither the nutritional domain (MNA characteristic) nor the biological (leukocytes, lymphocytes, proteins, and cholesterol) provided associations with the MMSE that could be generalized to the population of frail elders. They were not taken into account in the regression analysis.
Performance in ADLs, measured using the Barthel test, yielded associations that could be extrapolated to the frail elders. The logistic regression showed a higher tendency of cognitive impairment in frail elders with moderate dependence (<90 points in the Barthel test), in contrast to those completely independent.
Concerning mobility assessment domain, QGA through the validated IoT infrastructure (estimation of stride interval variability) and Tinetti assessment scoring provided separated associations with the mental state in the chi-square tests. Conversely, stride interval mean did not yielded significant association with the MMSE.
It should be noted that there were other gait characterization features which might be gathered by the IoT infrastructure (such as cadence and step interval mean and variability), although they were discarded due to multicollinearity issues at the beginning of the study. Stride interval was the chosen candidate because of its importance in the related work associating gait with cognitive impairment, as stated in the “Introduction” section.
The fitted model after the regression analysis showed the relationship between stride interval variability and MMSE. In fact, large stride interval variability (CV > 6%) was the most influencing factor associated with cognitive impairment in the entire model. On a lesser association level, but still significant, age and Barthel scale have also similar potential to be congruent with the evolution of cognitive impairment, according to the significant p-values and the comparable OR obtained for the presence of cognitive decline. However, the fitted model did not confirm any relationship between the MMSE and the Tinetti test, since the resultant p-value did not reject the null hypothesis. When the significance level is expanded to <0.1, the category for moderate risk of falls [19, 24] could be taken into account. In this hypothetical case, the OR would reflect four times more probabilities of having cognitive impairment than in normal mobility condition (without risk of falling > 24).
Conclusions and future work
An easy-to-deploy and low-cost IoT infrastructure for gait characterization has been presented and validated in this article. It is based on a set of wireless inertial sensors (nodes) connected to the same local area network. These nodes allow acquiring inertial raw data from the trunk of frail elders during explicit gait trials carried out directly in the elderly care homes. QGA, achieved using this infrastructure, has made it possible to obtain objective and measurable information on the stride intervals of frail elders, specifically their average and the stride interval variability. In particular, this last characteristic is presented in the related literature as a factor that can be affected by the onset of cognitive impairment, age, dementia, neurological diseases, and so on, and as a potential functional marker for the early detection of the onset of cognitive impairment when used in combination with other classical scales of cognitive impairment assessment.
This work analytically supports the trend set out in the preceding paragraph by inferring, through logical regression, which characteristics of those commonly used to assess the state of frail elders are the ones that maintain the strongest associations with the presence/absence of cognitive impairment. It is shown that stride interval variability (used as a quantitative indicator of gait performance) is the most influential factor, in combination with advanced age and moderate dependence on the performance of ADLs. On the contrary, the subjective mobility assessment through the Tinetti test (POMA) does not appear reflected as a significant factor in the model fitted by multiple logistic regression.
However, a constraining issue of this contribution is the sample size used in the studies (n = 81). Adding new participants to the logistic regression might achieve greater distinctiveness in the MMSE (in charge of characterizing the mental state). The performed analysis is a binary logistic regression; therefore, we can only separate MMSE into two categories, one for cognitive decline (MMSE < 23) and one for the absence (MMSE ≥ 23). Adding more frail elders to the sample allows us to attempt a multinomial logistic regression so that a categorically distributed MMSE variable could be possible, separating cognitive impairment state into mild, moderate, and severe categories.
Footnotes
Acknowledgements
The authors want to thank the participants and healthcare professionals who helped them to perform the explicit gait trials and tests in the elderly care homes. Moreover, they also acknowledge the Plan Propio de Investigación from Castilla-La Mancha University for its support.
Handling Editor: Luis Castro
Declaration of conflicting interests
The author(s) declared no potential conflicts of interest with respect to the research, authorship, and/or publication of this article.
Funding
The author(s) received no financial support for the research, authorship, and/or publication of this article.