
Abstract
Thermal comfort control for indoor environment has become an important issue in smart cities since it is beneficial for people’s health and helps to maximize their working productivity and to provide a livable environment. In this article, we present an Internet of things–based personal thermal comfort model with automatic regulation. This model employs some environment sensors such as temperature sensor and humidity sensor to continuously obtain the general environmental measurements. Specially, video cameras are also integrated into the Internet of things network of sensors to capture the individual’s activity and clothing condition, which are important factors affecting one’s thermal sensation. The individual’s condition image can be mapped into different metabolic rates and different clothing insulations by machine learning classification algorithm. Then, all the captured or converted data are fed into a predicted mean vote model to learn the individual’s thermal comfort level. In the prediction stage, we introduce the cuckoo search algorithm, which converges rapidly, to solve the air temperature and air velocity with the learnt thermal comfort level. Our experiments demonstrate that the metabolic rates and clothing insulation have great effect on personal thermal comfort, and our model with video capture helps to obtain the variant values regularly, thus maintains the individual’s thermal comfort balance in spite of the variations in individual’s activity or clothing.
Keywords
Introduction
Nowadays, people spend most of their time in enclosed environment, especially vulnerable seniors and younger population. 1 The indoor environment has great impact on people’s health and life comfort. One of the most common requirements of human beings for indoor environment is thermal comfort, which is defined as the subjective satisfaction evaluation of the surrounding thermal environment. 2 It has been reported that thermal comfort is of great importance to health, happiness, creative ability, and working efficiency.3,4 For these reasons, indoor thermal comfort control by optimal setting has become an increasing concern in both scientific and industrial communities.2–6 However, due to the non-linear mapping between various environmental variables and personal preferences, as well as the complexity of thermodynamics of human body, the thermal comfort environment control is still a challenging task.
Considering an optimal thermal comfort control system that predicts an individual’s thermal comfort in an indoor environment automatically, we compare the predicted thermal comfort value with the ideal value and make calibrations in time by adjusting the set point (such as air temperature and air velocity) of an air conditioning system of a building. It is tremendously useful to maintain the thermal comfort, protect the citizens from hypothermia or hyperthermia condition, and avoid them from getting cold, especially for kids, elder people, or persons absorbed in work and study, who have delayed perception of thermal sensations.
The key to the system is a thermal comfort model that simulates the individual’s thermal sensation accurately. Existing thermal comfort models can be roughly divided into three types: predicted mean vote (PMV) model, adaptive model, and data driven model.
Fanger’s PMV model2,7 is the dominant model, which has been adopted as an international standard in ISO 7730. It is represented by a heat balance equation describing the heat energy transfer from the body to the environment. Depending on the mean vote of thermal comfort from a group of individuals exposed to certain thermal conditions for some time, the model will consider a PMV index comfortable only when at least 95% of respondents are satisfied to this condition. Here, the thermal vote is scaled into seven integer levels between −3 and 3 on the ASHRAE (American Society of Heating, Refrigerating and Air-Conditioning Engineers) scale, which is a standard for PMV calculation using this model. Despite being widely accepted, the model has some limitations in practice. For example, the model often needs the user’s feedback about his or her activity and allocates the corresponding assumption constant for this user. This is not convenient for elder or younger people. It is often the same case to obtain user’s clothing information regularly.
Adaptive model8,9 takes physiological, behavioral, and psychological factors into account in a thermal comfort model. Adaptation is an important factor to be considered when people interact with their environment. 4 Adaptive thermal comfort models are based on data obtained from field studies, which aim to clarify the effects of “real” environment on thermal comfort. This type of model is generally employed for the naturally ventilated buildings and has become part of ASHRAE (2013) Standard 55 act as an optional method for naturally ventilated buildings. Thus, the adaptive model may not be suitable for air conditioning system in enclosed environment.
Data-driven models have been proposed recently,3–5 these approaches consider the thermal comfort model as a classification problem. In this type of model, data are often viewed as a resource. 10 Most of them integrate various environmental conditions as well as personal information captured by wearable devices or user’s feedback together as the input features and then try to learn a classifier taking a feature vector as input and a corresponding thermal sensation class as output. On one hand, the thermal comfort scales is often limited. On the other hand, wearable devices may bring other types of discomfort, and regular feedback may disturb the individual’s normal life to some extent.
Inspired by the previous work, we propose a thermal comfort control scheme for personal thermal balance adjustment with automation. It captures the capabilities of Internet of things (IoT) network to incorporate video camera as well as normal environment sensors together, where the video camera is used to capture the individual’s activity and clothing condition regularly, which will be converted into metabolic rate and clothing insulation by machine learning algorithm accordingly. The environment sensors are employed to measure the indoor air temperature, air velocity, and air humidity. Then, all the captured or converted data are exploited to learn the PMV index, which reflects the individual’s living habit and thermal comfort preference. Finally, the learnt personal PMV index value is used to predict the air temperature and air velocity of the air conditioning system for environment calibration.
In summary, the main contributions in this article include the following: (1) we propose an optimal PMV thermal comfort control strategy, which introduces video camera to capture the images of individual’s activity and clothing periodically, learns the metabolic rate and clothing insulation for PMV calculation by machine learning method, and gives the corresponding adjustment for thermal comfort in time. (2) We derive the solution optimization process for proposed model by cuckoo search algorithm, which can be convergent quickly. (3) We analyze the effect of different factors such as metabolic rate, clothing insulation, and air humidity on the predicted solution in the thermal comfort model.
The rest of this article is organized as follows. In section “PMV model,” we give a brief introduction to PMV thermal comfort model. Then, in section “Proposed thermal comfort control system,” we present the framework of our thermal control system, the optimization algorithm, and the procedure of solution determination. Section “Experiments” shows the obtained results and analysis based on our optimal PMV model. Section “Conclusion” concludes the article.
PMV model
PMV is able to predict the average response about thermal sensation of a group of people exposed to certain thermal conditions for a long time. The index can be estimated as a thermal balance function considering the human body as a whole entity, which deals with the following six input parameters: metabolic rate

where


Most values of these input parameters are acquired by sensors. However, clothing insulation and human activity variables are not easily accessed since they depend on the individual’s current situation at an instant. Conventionally, the values related to both parameters under different conditions can be found in manuals and standards.
6
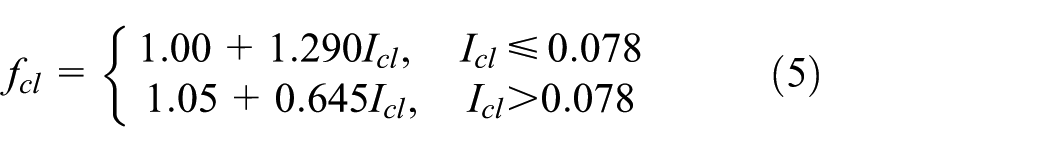
Table 1 lists the descriptions, units, and the typical values commonly assumed or access methods for all the variables that appeared in equations (1)–(5), where the values of
Variable list in PMV equations.

PMV: predicted mean vote.
Proposed thermal comfort control system
In this section, we present the architecture of our thermal comfort control system and parameter determination approaches for our proposed thermal comfort model in detail, followed by the model optimization algorithm.
Figure 1 describes the framework of our personal thermal comfort control system.

Schematic illustration of the proposed thermal comfort control system.
The sensor network is composed of several sensors connected together by IoT, where the temperature sensor, humidity sensor, and air velocity sensor are used to capture the indoor environment information; video camera is used to monitor the individual’s personal information, such as activity condition and clothing condition. Then, machine learning method is used to classify the individual’s clothing images captured and map the classification result to the clothing insulation value; similarly, the activity condition is classified to find the corresponding metabolic rate. Next, the PMV index is calculated by equations (1)–(5) based on the obtained parameter values. The mean value of PMV recorded for a period is used for the resulting value of individual’s personal PMV, which reflects the individual’s living habit and preference. Finally, in the prediction stage, we deduce the air temperature and air velocity through the learnt personal PMV index by the PMV model. If the system finds a mismatch between predicted air temperature as well as velocity and the measured values, it will adjust the air conditioner controller automatically. The presented system tries to keep the balance between occupant’s thermal sensation and expectation by minimizing the mismatch between demand and supply for thermal dynamic mechanics. Thus, it also avoids the energy wastage and improves the energy efficiency.
Parameter determination
From PMV model and Table 1, the calculations of two intermediate variable parameters including clothing surface temperature
Calculation of clothing surface temperature
and convective heat transfer coefficient
From equations (1)–(5), we can see PMV model deals with several complex expression, especially for equations (3) and (4), where the calculations of both intermediate variables clothing surface temperature
From equation (3), let

Then, equations (3) and (4) can be expressed as the following simultaneous equation group

Equation (7) is solved by iteration. First, set a search interval for the value

Obtain metabolic rate
and clothing insulation
by image classification
For human beings, we have different metabolic rates for different activity conditions. The higher the individual’s activity level, the more the metabolic rate. For indoor environment, there usually exist three classes of activity conditions, such as sitting, standing with little walk, and sleeping. Table 2 gives their corresponding metabolic rates. 11
Different activity conditions and their metabolic rates.

We capture the human activity images and feed them first into the state-of-the-art pose detector named OpenPose, 12 which extracts the pose-based key-points pertaining to humans in the scene. Some sample images of two-dimensional (2D) locations of human anatomical key-points are shown in Figure 2. These key-point coordinates are considered as the extracted features. Then, the human activity condition can be determined by a support vector machine (SVM) classifier 13 based on the extracted pose key-point features. We use the Gaussian radial basis function (RBF) as the kernel function. To evaluate the classifying performance, we divide all the pre-captured images into three classes accordingly. Each class has 100 images, half of which are used for training and the rest for testing. We measure the performance using average precision over all the classes, which is up to 94.2% in this case. Given a new image, the classifier is used to predict the corresponding activity condition and further find the value of metabolic rate for this activity.

Some activity detection results by OpenPose.
The clothing insulation is obtained by the similar method, except that we extract HSV color histogram, Gabor texture, 14 and Hu invariant moment 15 as the features of captured individual images for classification. Table 3 shows the four classes of typical clothing we employed in our system, such as short sleeved shirt, long sleeved shirt, jacket or sweater, and cotton coat, along with the corresponding clothing insulation. 16
Different clothing and their insulations.

Personal PMV training
By Fanger’s model, 2 the PMV index results in seven scales, where the best thermal comfort condition is reached when PMV = 0. Then, to maintain an optimal thermal comfort, we need to maintain the indoor air temperature and air velocity equal to a value such that the PMV = 0.
But different people have different thermal comfort sensations. The thermal sensation may differ in ages, gender, and health condition, even in physiological and psychological factors. Thus, the optimization goal of PMV = 0 does not fit all the people, especially for vulnerable seniors and younger population. Thus, a personal PMV index value is required to reflect one’s preference in the thermal comfort system.
To find a personal PMV, we capture the indoor air temperature and air velocity by the corresponding sensors, which are preset according to individual’s own thermal comfort. Also, the values of air humidity, individual’s clothing insulation, and metabolic rate can be monitored and calculated accordingly. All the data obtained for a period are fed into the PMV model to calculate the personal PMV values, which reflect the person’s living habit and preference. Finally we calculate the mean value of all the obtained PMV values as the personal PMV for the preceding model prediction, and we note it as PMV0.
Model prediction
Among the six parameters relevant to PMV index, we can see the indoor air temperature

Equation (8) is a continuous optimization problem with constraints. We employ the cuckoo search algorithm
17
—which is a novel evolutionary programming algorithm with the advantages of easy implementation, robust performance, and lower chance of being trapped into a local minimum—to solve this problem. Cuckoo search algorithm is inspired by the obligate brood parasitism of some cuckoo species laying their eggs in the nests of other host birds. It assumes that the host bird discovers the eggs laid by cuckoo with a probability of
Denote by
1. Given the current host nests

where
Generally, the next location after a random walk only depends on the current location and the Levy step. The Levy step is taken from the Levy distribution, which is most commonly given by Mantegna algorithm. So, the Levy step can be represented as

where
Basically, Levy distribution for large steps obeys a power-law distribution with a heavy tail. Then, the original ith host nest
2. The host throws the eggs of cuckoos away or abandons the nest to build one in a new location randomly with a probability of

where


In the experiments, we set

The convergence of the optimization algorithm (Algorithm 2).
Experiments
In this section, we will provide the results of our proposed thermal control system as well as the results analysis.
Experimental settings
In our experiment, we assume the mean radiant temperature
Prediction results for thermal comfort
Table 4 gives some examples of predicted result when metabolic rate

Results of the thermal control system with the variation of humidity

From Table 4, we can observe the following:
With the humidity increase from 20% to 80%, the predicted air temperature for thermal comfort will decrease by 5.8%, 4.2%, and 6% for minimum, maximum, and mean values, respectively, while the corresponding air velocity is always changing in the whole given range. This shows that the humidity has a comparatively small effect on the predicted air temperature and nearly has no clear effect on the air velocity.
With the humidity increase, the relative variation of the air temperature
Figure 4 shows the scatter of all the 20 solutions for each value of humidity, where the minimum, maximum, and mean solutions are connected accordingly for observing convenience. We can see that,
Given a certain value of humidity, the 20 solutions are scattered, with only few of them overlapped. This shows that the solutions being satisfied to a given fitness requirement are more than one, which may provide the adjust flexibility for our system and the possibility to find a common or similar thermal comfort setting for an indoor environment with more persons who have different preferences.
For the 20 solutions with a certain humidity, the air temperature and the air velocity vary accordingly. The velocity is around 0 for the minimum value of air temperature and is around the maximum limitation of 0.5 m/s for the maximum value of air temperature. This verifies the common sense that the air temperature and air velocity are positively related for thermal comfort. (Exceptions, for example, the purple dots and the blue dots very close to the minimum solutions, may be caused by calculation round-off error.) Considering the energy conservation, we should choose the minimum solution as the thermal comfort settings.

The result scatter of 20 solutions with the increase in humidity.
Table 5 gives some examples of predicted result when humidity
Keeping the metabolic rate
Keeping the clothing insulation
When
Results of the thermal control system with the variation of metabolic rate

Figure 5 shows the scatter describing 20 solutions with the increase in clothing insulation

The scatter of 20 solutions with the increase in clothing insulation, while the metabolic rate is fixed at 1 met, where the minimum, maximum, and mean solutions in each case are connected accordingly for observing convenience.

The scatter of 20 solutions with the increase in metabolic rate while the clothing insulation is fixed at 0.5 clo, where the minimum, maximum, and mean solutions in each case are connected accordingly for observing convenience.
Figures 5 and 6 reveal that under a certain condition, all the solutions are close to each other, which verifies the convergence of the optimization process. However, they are not overlapped, which shows that the thermal comfort condition is not a point, but a small scope. This verifies the possibility to use this system in an enclosed environment with more persons.
Conclusion
In this article, we present a personal thermal comfort control model for indoor environment, which integrates the video camera with conventional sensors into an IoT network for data acquisition. To facilitate the individuality of our model, the system combines personal information including activity and clothing condition from the video camera with environmental measurements such as temperature, humidity, and air velocity. And, the individual’s thermal comfort is kept by continuous calibration of the air temperature and air velocity using PMV model. We deduce the solution optimization based on cuckoo search algorithm. Experiment results show our model optimization process converges rapidly, which demonstrates the practicability of our proposed model. Furthermore, the analysis of results demonstrates that the humidity has smaller effect on the air temperature adjustment compared to metabolic rate and clothing for thermal comfort, which prompts us to pay less attention to humidity in the future studies. Also, multiple solutions for thermal comfort balance in a certain condition illustrate the potential for energy saving and the possible application of our model in environment with more than one person. For future work, we intend to make use of big data captured from more transducers and integrate the big data–driven cluster10,19 into the system to provide more optimal control strategy. In addition, the 5G IoT technology can be employed to implement the real-time big data access.
Footnotes
Handling Editor: Feng Ye
Declaration of conflicting interests
The author(s) declared no potential conflicts of interest with respect to the research, authorship, and/or publication of this article.
Funding
The author(s) disclosed receipt of the following financial support for the research, authorship, and/or publication of this article: This work was supported by Chinese National Natural Science Foundation (61771169), Science and Technology Project of Beijing Municipal Education Commission (KM201510009005), and the Excellent Youthful Teacher Project of North China University of Technology (XN019006).