
Abstract
It has been seen that most of the accidents occur due to driver’s fatigue. Drowsiness is a state of mind before the driver falls asleep, which means the driver could not accomplish his actions, such as vehicular braking, controlling vehicular motion, properly. We have built an Internet of things–based medical application to analyze driver’s drowsiness. An architecture has been proposed and a simulation of that scenario in NS3 WSN simulation tool has been done. This simulation shows that the ratio of accidents can be majorly reduced. When drowsiness of drivers is captured, a message alert is delivered to all other drivers of the vehicles that are near to the sleeping driver; for this, different sensor nodes are used. Another unique feature of the sensor network used here is the collaborative effect of sensor nodes. So for measurement and analysis of applications on Google Play, a dataset of the medical applications category was scraped. The scraping was done with 550 applications of each category of medical applications. On each application on Google Play store, almost 70 attributes for each category were scraped. It is envisioned that, in future, wireless sensor networks will be an integral part of our lives, more so than the present-day personal computers.
Keywords
Introduction
Current breakthroughs in Wireless Body Area Networks (WBANs) have resulted in various emerging applications in pervasive healthcare. 1 Using video sensors to transmit appropriate medical information including electrocardiogram (ECG), electromyogram (EMG), temperature, glucose level, blood pressure, audio-visual clinical notes, x-ray, magnetic resonance imaging (MRI), and others could potentially improve patient care and improve Quality of Experience (QoE) through real-time monitoring and diagnosis of threatening diseases.2,3 In recent years, many researchers have started working on smart healthcare solutions to provide better healthcare services to the community. However, delivering sensed biomedical data over heterogeneous wireless networks,4,5 energy consumption of sensor nodes, multimedia content delivery, Internet of medical things (IoMT) data processing requirements, big medical data analytics, wireless link reliability, diverse communication environments, decision support systems, and issues related to seamless data streaming faced by the current and next generation of wireless networks are of great concern. 6
The number of road accidents has drastically increased in Pakistan in the last two decades. This causes enormous monetary and emotional misfortune. The increased number of road accidents is because of driver absentmindedness or driver drowsiness. The driver’s sleepiness is caused carelessness situation. These road accidents are fundamentally slippery to human security. The side effects of driver weariness fluctuate from driver to driver, and includes the following: loss of mindfulness, lethargy, yawning, torpid responses, red eyes, microsleep, dreariness, eagerness, missing street signs, trouble in keeping their head up, switching to another lane, and so forth. Although the reasons for driver weariness are various, researchers have recognized a few elements. 8
Vehicular-based measures are non-invasive, embedded in the vehicle to monitor the driver steering wheel pattern, braking pattern, and lane departure for drowsy detection. Steering wheel measurements are known to be highly efficient and the most accurate method for measuring drowsy driving, as compared with all other methods of this category. Although vehicular-based methods are cost-effective, they are not considered as reliable methods because of driver’s skills, road traffic, and the condition of the road.9,10
The third category consists of the driver’s behavior. It includes eye blinking, yawning, eye closure, and head positioning and other facial expression analyses. Behavioral measures are considered as more effective compared with vehicular-based measures because they focus on the driver himself or herself than on the vehicle and because it is practically easier to measure. In the behavioral measures method, information is gathered through video cameras and driver’s facial expressions are monitored. Nowadays, behavioral measures have become a widely used technique due to the reliability. To obtain more reliability in results, researchers are fusing physiological information into behavioral measures to design a hybrid detection system. 11
To avoid accidents, researchers suggest the drivers take naps between long trips, intake coffee and energy boosters, or drive with someone for company. It will help them to stay awake and alert. In this research article, our focus is to compare different techniques of behavioral measures and provide a systematic review of the technique.
Smart-Phone applications
The Apple App Store was launched just a few years back in 2008; however, the number of apps as of 2017 was around 2,200,000. In addition, in accordance with Apple’s policy, program developers earned around US$20 billion on their own. Although programs in the Health and Physical Fitness and Medical categories account for a relatively low percentage of just 4.87% of the total apps within the app store, statistics indicate that nearly 60% of smartphone users have now installed at least one health-related program on their mobiles. In all, the worth of the cellular wellness sector equates to US$6.7 billion in 2012, and it is forecast to increase to US$58.8 billion by 2020. 12 The explosion of programs available for people in the Apple Store and Google Play store makes it harder to get M-health application programmers to draw prospective end users’ focus, bringing them their program, also then motivating them to make use of their own programs within an ongoing interval. After downloading, nearly 70% of users now utilize their programs rarely, 26% use most of the downloaded programs just one time and 74% have stopped using the apps completely. 13
A great number of third-party applications in Google Play store allow visitors. An incredible number of end users use these apps on their tablets and on their mobiles, and enroll themselves on their own private devices. Several applications are uploaded by countless programmers on a daily basis. The truth is that the articles uploaded online that users engage in are largely unchecked, and countless end users download these apps. However, there is really very little information regarding the applications on Google play store. The reason for this is the fact that there is a shortage of scalable applications to assess and detect applications. 14 The source code of third-party programmer applications are not available with Google. It also does not have any accessibility into the source code of even those apps that are filed directly into the Google perform shop as compacted binary options. Google places many procedures to avoid malfunctioning and also engages in retail store information indexing. For instance, Google play store dataset is bound by just 500 application detection owned by some kind of game using almost any Internet search duration by simply surfing the shop interface. In order to learn more about the application from Google Play store material, we have crawled info from Google play store using crawling and scrapping methods. Thus, depending on data from Google Play store, we will quantify and study the exact content of all Google Play store metadata and also store the data. Subsequent to the resurrection of countless of applications, we have identified a separate application, including paid and completely free. 15 We plotted the data retrieved using Pie3D of R.
pie3D scales the values in x so that they total 2*pi, dropping zeros and missing values in the form of not available values (NAs). It subsequently exhibits a vacant storyline, computes the arrangement for drawing on the businesses and also requires draw.tilted.sector to attract just about every and every sector. When tags are provided, it is going to telephone pie3D.label to set those out each and every sector. When furnished, the range of tags, tag places, and also business colors needs to be equal to the range of values in x-ray. If the event labels have been prolonged, then it may possibly help reduce the radius of this pie or transform the career, a common purpose for all R objects. For additional information regarding the graphics parameter arguments. For uncomplicated scatter plots, plot.default has to be properly used. But, you will find storyline means of several items, for example, roles, frames, data, density items, used techniques and so on. 16
CIRCOS is an application program for visualizing data and information. It visualizes information within a circular layout, which tends to make CIRCOS ideal for investigating connections between positions or objects. There are other reasons why a circular layout is advantageous, not the least being the fact that it is attractive. Circos is ideal for creating publication-quality infographics and illustrations with a high data-to-ink ratio, richly layered data, and pleasant symmetries. You have fine control each element in the figure to tailor its focus points and detail to your audience. 17
Because such calculation programs are complex and highly technical, the demand for exceptionally scalable and accurate system simulation engineering becomes increasingly necessary. In spite of the development of large-scale test beds for system investigation, simulation plays a critical part in conditions of scalability (both in measurement and also at the experimental rate), reproducibility, and quick design, along with instruction. Together with simulation-based scientific tests, the procedure could be learned at length in varying scales, even together with varying statistics tools, different subject requirements, and also should lead to reproducible and analyzable outcomes as discussed in the literature. 18
Our system has an 85% accuracy of the accepted level to detect drowsiness of drivers by monitoring eye closure. We have built an Internet of things (IOT)-based application to analyze the driver’s drowsiness. The architecture has been simulated using the NS3 WSN simulation tool. The ratio of accidents will be reduced after the simulation. We have used different sensors, which will generate a notification that will be sent to all those drivers who are nearer to that driver; also theses sensors are fitted with sensor board and work synchronously. These features have a wide range of application for sensor networks such as health, military, and security. We could possibly simulate the architecture diagram through a wired channel. However, this will be very costly, and in real life, we cannot connect the vehicles with wires. So we have two scenarios for connection: first is the true wireless connection and second is a false wireless connection between vehicles. For simulation in NS3, we used 11 vehicles that can move freely in the given space. If any of the drivers from the 11 vehicles are detected to be in sleepy mood, an alert message will be generated in all other vehicles. Moreover, in the true case when there is no driver in sleepy mood, the message will not be generated, and so only Vehicle 1 will move, whereas other vehicles will not move. We have just two types of applications: paid and free. We scraped thousands of health applications from Google Play store by using the google-play-scraper. We scraped around 550 health applications in both free and paid categories with different attributes, namely, rankings, in-app purchases (IAPs), advertisement support, and installations. For analysis and visualization of the health application, we have used RStudio and CIRCOS, respectively.
The article is organized into the following sections. The first section is the introduction, which gives an overview of the study. The second section presents a review of existing literature on the topic. The third section describes the smart D3S framework based on IoMT, and the fourth section comprises the results and discussion, which has two subsections. Each subsection describes different types of health-related applications in Google Play store. The last and fifth section concludes and discusses the way forward.
Literature review
Behavioral techniques display various constraints because their operation will be influenced by light requirements, camera motions, and also the framework speed utilized to capture pictures of the driver’s encounter. A light variant could normally be removed using infrared (IR) cameras. Blink detection from the filter is directly obtained using electrooculography (EOG) signs. A filter was employed for eradicating the ramble from the EOG sign and for accentuating blink detection. 19 Eyeblink switch from one individual to another along with carbon filter eliminates completely speedy eye motions. Possible interactions are discovered and amplitude is expressed using a method of simulating driver drowsiness with numerous eyelid movement features predicted with a combination of data using partial least squares regression (PLSR). This was combined with a method to handle the issue of sturdy collinear connections (a method used for detecting embryo motion features), therefore forecasting the inclination of drowsiness. 20
Krogh et al. 22 introduced a visual investigation of attention condition and mind presence for steady observation of endurance of the car driver. Most of the present designs for discovery of non-alert driving are dependent on close attention or nodding angles to decide on driver drowsiness or diversion. An approach to assessing the facial manifestation of the driver was done using a hidden Markov model (HMM)-established lively modeling to assess drowsiness. The plan is currently executed with a simulated driving arrangement. 21 The accuracy and reliability of driver drowsiness detection using physiological signs are extremely high in comparison with different procedures. Nevertheless, the more straightforward character of quantifying bodily signs remains a matter to be tackled. To overcome this, a wireless apparatus can be utilized to quantify physical signs in a significantly less invasive way by setting the electrodes in the system and receiving signs utilizing wireless systems such as Zigbee, Bluetooth, and so forth. 22
A few machine learning methods were utilized by some researchers, which include things such as support vector machines (SVMs), convolutional neural networks (CNNs), and HMMs from the drowsiness detection perspective. The support vector system procedure could be the most frequently used strategy to find drowsiness; however, CNNs did a lot better compared with both of the other methods. 23 In general, diverse facial functions such as eye finishing investigation, eye wind speed, yawning, and facial manifestation are all examined employing these machine learning methods. SVMs try to use a hyperplane that divides coaching data into pre-defined categories. From the driver drowsiness perspective, SVMs are chiefly utilized to understand how to classify various conditions of the driver using standard information. An amazing amount of effort has expended to use the capacities of SVMs in the discovery of drowsiness. 24
Otoum et al. 25 introduced a detection procedure utilizing machine learning methods; they detected the head using the Viola–Jones object detection framework, utilizing cascade item sensor classifiers, after which SVM and main element analysis are done. This machine accomplished top precision in discovering drowsiness. The famous Haar attribute algorithm has been used in combination with unique machine learning processes such as AdaBoost classifier using SVM. The accuracy of this machine was quantified as roughly 99.1%. HMM is a statistical method utilized to create forecasts regarding concealed, and says predicated on detected nations characterized by chances. 25 Now, HMMs have widespread usage in applications such as facial expression recognition, gene annotation, mimicking DNA series glitches, and in computer virus erosion. 26 The authors have utilized an infrared (IR) digital camera to get rid of light fluctuations and for simulating the daytime and nighttime conditions. CNNs are very similar to a regular neural system that is additionally composed of neurons that contain weights. CNNs make use of the levels of plasma convolutions that are ideal to graphics and display powerful spatial correlations. CNNs have shown powerful application in picture recognition, movie examination, and in many other fields. While the application of CNNs in computer vision was just discovered in 2012, research has now found profound benefits of using them in object recognition. 27 These machines work even in the event the driver has been shifting headset posture as shown in Table 1.
Driver drowsiness detection using behavioral measures.

PCA: principal component analysis; SVM: support vector machine.
Lots of metrics, for example, deviations from lane posture, movements of tires, hand gripping over the tires, lane passing, and strain onto the speed pedal, are always tracked and any alteration from those which spans a predetermined threshold signals a considerably increased likelihood of the driver being more fatigued. Driver support methods have been utilized to track the car condition. These techniques offer assistance or support for the driver while driving and also function by simply taking an input signal from sensors across the automobile to calculate some sort of suggestions that are subsequently utilized to help the driver of the automobile. Lane departure warning (LDW) always tracks the place of the automobile onto the lane mark on both sides. In case the automobile lane departure is only slightly off the mark, the driver is advised and also a corrective step can be carried out. Utilizing LDW, accidental lane death brought on by driver’s inattention, distractions, and fatigue might be decreased. LDW systems catches the trail beforehand and the driver receives a warning as soon as the automobile deviates and reaches or approaches the lane marks. The caution could be an audible tone or even a visual alarm or vibrations within the tire or even the driver’s chair. In case the driver is deliberately crossing the lane, then no warning is generated. 30
The lane discovery procedure is made of distinct modules such as shooting video/image of the trail lane indicating lane modeling, feature extraction, lane discovery and lane monitoring, and LDW methods. Lane simulation can be utilized to get a statistical outline of street lane marks. Distinct lane characteristics such as the border, feel, and shade are pulled. Lane detection is performed by matching the lane version with all the other attributes, and lane adjustments are done using the lane observation module. Throughout execution, differently sophisticated predicaments such as lane type S, road surface, daylight, ecological elements, shadow, rain, types of lane marks, street surface area, lighting variation, nighttime situations, and fog, along with the sun are also believed to have a significant effect. Use these factors, the lane detection endeavor is achieved by edge detection and lane discovery. 31
Personalized driver model (PDM) is additionally a lane death procedure which discerns the faculties of a person’s driving mode. PDM refers to the driver’s lane-keeping behavior and lane death behavior using a combined probability density function for Gaussian mixture model (GMM) among auto rate, comparative yaw angle, comparative yaw speed, and lateral displacement, along with highway curvature. The latest analysis attempted to check distinct steering processes so as to describe the driver’s steering by monitoring hand position employing simulators and movement grids. 32 But just concentrating on hand position may not be enough. The American Automobile Association reports that besides improper steering behind the steering wheel, tired driving takes liability for 12.5% of car or truck accidents, requiring treatment for passengers and drivers. It would be very expensive to employ cable-less detectors to quantify driver’s hand tilting routines and heart rate simultaneously with hand gripping. 33 These devices can supply cheap but high-performance analytics. Real simulation for the research and clinical fields are shown in Table 2.
Drowsiness detection system using vehicular measures.

LDWS: lane departure warning system; HMM: hidden Markov model; TLC-PDM: time to lane crossing-personalized driver model.
Drowsiness can be discovered via heartbeat pace and heartbeat, along with brain info. Heart speed fluctuates greatly during different phases of drowsiness, for example, as for example fatigue and alertness. However, an electroencephalogram (EEG) is the most frequently used procedure as it reveals many frequency groups such as delta, alpha, beta, and theta bands that match different sleeping and comfort, endurance, and exhausted conditions. EEG and EOG sensors are excellent since the sign-outs of EEG are assessed using signs of EOG and bogus alarm speed declines of up to 5%. Researchers state that the drowsiness of a driver can be discovered by a person’s eye motion tracking along with biosignal processing. They also suggest that warnings such as an enhanced driver assist module that caters to computerized driver drowsiness detection and detects driver downtime can lessen the range of these deaths. 34 Artificial-intelligence algorithms have been utilized to analyze the visible information as a way to discover, monitor, and examine the driver’s eyes and face to directly calculate drowsiness and diversion indicators. These real-time procedures work throughout nocturnal states using a consequence of the near-infrared light procedure. Physiological step analytics were combined with behavioral step analytics to construct a hybrid system. These devices provide top precision outcomes: the classifiers utilized in those systems are EEG with diverse machine learning classifiers such as principal component analysis (PCA), k-nearest neighbors (KNNs), CNN, autoregression (AR), and with binarized neural networks (BNN) as shown in Table 3.
Drowsiness detection system using physiological measures.

EEG: electroencephalogram; CNN: convolutional neural network; PCA: principal component analysis; AR: autoregression; KNN: k-nearest neighbors; BNN: binarized neural networks.
Since 2006, deep learning (DL) has come to be a fast-growing search management, redefining innovative performances within a broad variety of subjects such as object recognition, image segmentation, language recognition, and machine interpretation. In present-day fabrication procedures, information system health tracking is gaining acceptance as a result of the widespread installation of cheap detectors and also their relation on the web. Meanwhile, DL offers invaluable tools to process and assess the vast information. The primary aim of this article is to examine and outline the emerging search job of DL with regard to system medical tracking. In addition, an experimental analysis of the advantages of both these approaches was performed. Last but not the least, some new styles of DL-based system health tracking processes have been discussed. 39
This article introduces a hybrid sensor system platform, on the basis of an IoT-linked basic safety and wellness tracking application. The machine is directed toward improving protection at the exterior office. 40 The suggested platform comprises a wearable human body network system (WBAN) to get user info along with a low-power wide-area system (LPWAN). 41 The wearable detectors while in the WBAN are used to assess the environmental requirements around the area, working with a risk-free node, to track the most critical signals, and with an overall health node. A standalone community host, which may approach the raw detector signs, exhibits both the physiological and environmental info, and activates an alert when an unexpected emergency scenario is discovered, is built into the projected system. To join the gateway with the World Wide Web, an IoT cloud host has been used for better broadcast of web tracking and cellular applications. 42
IoT has emerged as a brand new paradigm now, linking an assortment of virtual and physical elements incorporated with electronics parts, detectors, actuators, and applications to successfully get and swap info. The focus on IoT is growing for important research issues in the medical industry overall and in specific areas such as mental health. The principal goal of this article is to demonstrate the primary IoT applications and services in the area of mental health ailments. The databases that were inspected include Google Scholar, IEEE Xplore, PubMed, Science Immediate, and Internet of Science, considering literature from 2008 to date. 43 Several research standards have been created for IoT-based or Web of Things–based mental health services. An overall number of 51 posts are entirely on IoT-based applications and services from mental health, of which 14 are determined to be important in emotional wellness. A number of books (over 60%) were observed to demonstrate the application formulated for tracking individuals with emotional illnesses through detectors and networked apparatus. The addition of IoT technological innovations in well-being brings benefits in the areas of diagnosis, fertility interventions, and supplying warn and advice products and services. Mental health support is a critical aspect that determines the overall individual life caliber and efficacy of one’s health support system. 44
The internet of Things (IoT) has empowered remote sensing and communication with assorted apparatus. In the field of healthcare, IoT has many positive aspects of tracking and alerting sufferers. IoT healthcare is important in most medical devices such as ECG monitors, sugar degree detection, and oxygen focus discovery. The advanced level technology has eased its execution although it has its unique problems.
A health tracking system along with IoT will be a more promising alternative to traditional healthcare strategies.45,46 For the problem at hand, a small adaptive and acoustic real-time ECG tracking platform incorporated on the T-shirt has been suggested. 47 The accumulated ECG statistics are sent through Bluetooth low energy (BLE) into an end apparatus for the real-time exhibit. A computer’s graphical user interface (GUI) along with a smartphone application is designed for indoor and outdoor real-time observation. The energy intake of this suggested wearable ECG tracking system is as little as 5.2 mW. Powered with a a 240 mA h rechargeable battery, this will be able to function for at least 110 h continuously. To lengthen the duration of the battery life, an elastic solar power harvester is additionally embraced. 48
This study suggests a video transmission algorithm to maximize medical quality of assistance with respect to system metrics such as normal deviation, throughput, peak-to-mean ratio, delay, moderate delay, jitter and normal jitter. The transmission of high-performance video monitoring along with retargeting at web of multimedia matters along with Body Area Sensor Networks (BSNs) are discussed. Experimental results show that Mobile Quality of Service (M-QoS) is enhanced for doing the job in advance transmission within combined BSN and Internet of medical things (IoMT). The example of such system is Telesurgery, which is an emerging field of study and research. 49
As indicated by the World Health Organization, in developing nations, in excess of 1.3 million individuals died in road accidents. A research study in Pakistan led to quantify the effect of driver’s exhaustion in road traffic crashes. Information was gathered from the National Highways and Motorway Police (NHMP), and measures of exhaustion-related mishaps were estimated by applying the Australian Transportation Safety Bureau procedure. The examination comes about to demonstrate that the normal level of weariness-related road accidents were 28% and 10% on Motorways and Highways, respectively. It likewise portrays that exhaustion-related accidents prompt deadly mishaps on Motorways (54%). 50 Overall, now the authorities are considering the counteractive actions to prevent road accidents. In Pakistan, a large portion of the mishaps happens because of driver’s tiredness. We have gathered information from the Pakistan Bureau of Statistics. Insights into of the road accidents based on the class of road accidents and losses are shown in Figure 1.

The percentage share of road crashes in Pakistan.
These incidents have driven specialists around the globe to explore techniques for early cautioning, sluggishness identification, and cautioning. In addition, numerous nations and government authorities are focusing on the execution of answers for enhancing driving security. There is no such framework yet in Pakistan to distinguish a driver’s sleepiness. The following are the three major categories of measures to detect the drowsiness of the driver:
Behavioral measures
Vehicle-based measures
Physiological measures
In the first category, sleepiness is detected using different biomedical indicators, heart rate, skin color, and electrical brain activity. These physiological features change in the presence of fatigue and drowsiness. By using various physiological indicators such as ECG, 51 EOG, 52 functional near-infrared spectroscopy (FNIR), 53 and electroencephalography (EEG), 54 consistent results can be obtained for sleepiness detection. Among all these indicators, EEG is considered as the most reliable and commonly used technique. EEG is a non-invasive technique that records the electric potential of the cortical neurons with the help of electrodes placed on the scalp. EEG signals measure the potential fluctuation of cortical neurons, and based on frequency bands, the signals are classified as alpha signals (8–13 Hz), beta signals (13–30 Hz), gamma signals (30–50 Hz), and delta signals (1–4 Hz). We are interested in the alpha wave band as it designates drowsiness. Some researchers combined the physiological parameters with different kinds of sensor fusion techniques to increase the competence of detection systems. It has been proved that physiological techniques produce satisfying results, but these techniques are not cost-effective and also have some practical limitation of setup complexity and non-portability of equipment.
The D3S system addresses many issues, which have not been covered in the literature. Researchers such as Verma et al., 20 Memon (2017), 28 Juboori (2017), 29 and Ambekar et al. 27 have used the machine learning classifiers and used face and eyes to detect the driver’s drowsiness. These researchers have used classical machine learning methods for the static systems, but in case of real-time situations, these classifiers and their related methods will underperform. The proposed D3S system can be used in the real-time situation and it functions accurately.
Smart D3S framework based on IoMT
Our system detects the drowsiness by monitoring the eye closure state of the driver, and our system has a level of 85% accuracy. To analyze the driver’s drowsiness, we can build an IoT-based medical application. There are thousands of IoT-based medical applications uploaded by developers that can assist and guide the users of the applications. We are proposing an architecture diagram and we are simulating that scenario using the NS3 WSN simulation tool. This simulation shows that the ratio of accidents can be majorly reduced. When drowsiness of any driver is captured, a message alert will be delivered to all other drivers of the vehicles that are near to the sleeping driver; for this, we are using different sensors nodes. 55 Another unique feature of the sensor network is the collaborative effort of sensor nodes. Sensor nodes are fitted with an onboard processor. The above-described features ensure a wide range of applications for sensor networks. Some of the application areas are health, military, and security. For example, the physiological data about a patient can be monitored remotely by a doctor. We can build an Android application that could be more useful for users as shown in Figure 2.

Architectural view of smart D3S based on IoMT.
D3S
The driver fatigue detection and alert system demands precise measurements. It has two main measures. The first one will be to coach the classifier to the facial skin swelling, eye discovery, and assess whether the eyes are closed or open. The discovery stages contain the selection of objective graphics and unwanted graphics. The objective pictures, also known as favorable examples, help with the aim of the system; the graphics that are not useful are referred to as unwanted graphics. Numerous classifiers will need to get skilled independently for distinct objectives. Here aim denotes the facial skin near the eyes and opened eyes or shut eyes. The trained classifier is different for each specific individual, plus it might detect any individual eyes and face.
Second is the driver’s fatigue detection system. The discovery procedure is attained by employing different educated classifiers in the check graphics. A video camera has been directed at the drivers’ face in this procedure. A movie flow is got out of this camera; also the video flow stipulates the evaluation graphics. A single image will be taken in the video flow, and following the investigation of the needed graphics, the machine will automatically choose whether or not to build the information as shown in Algorithm 1. The decision around the alarm is dependent on assessing the threshold value. The conclusion of threshold depends upon the experiments. The entire procedure for driver fatigue detection is displayed in Figure 3. Higher value of driver’s fatigue score causes alert generation with the help of fatigue action system module. Whereas the lower score is ignored, and image extraction is performed to check the fatigue value again.

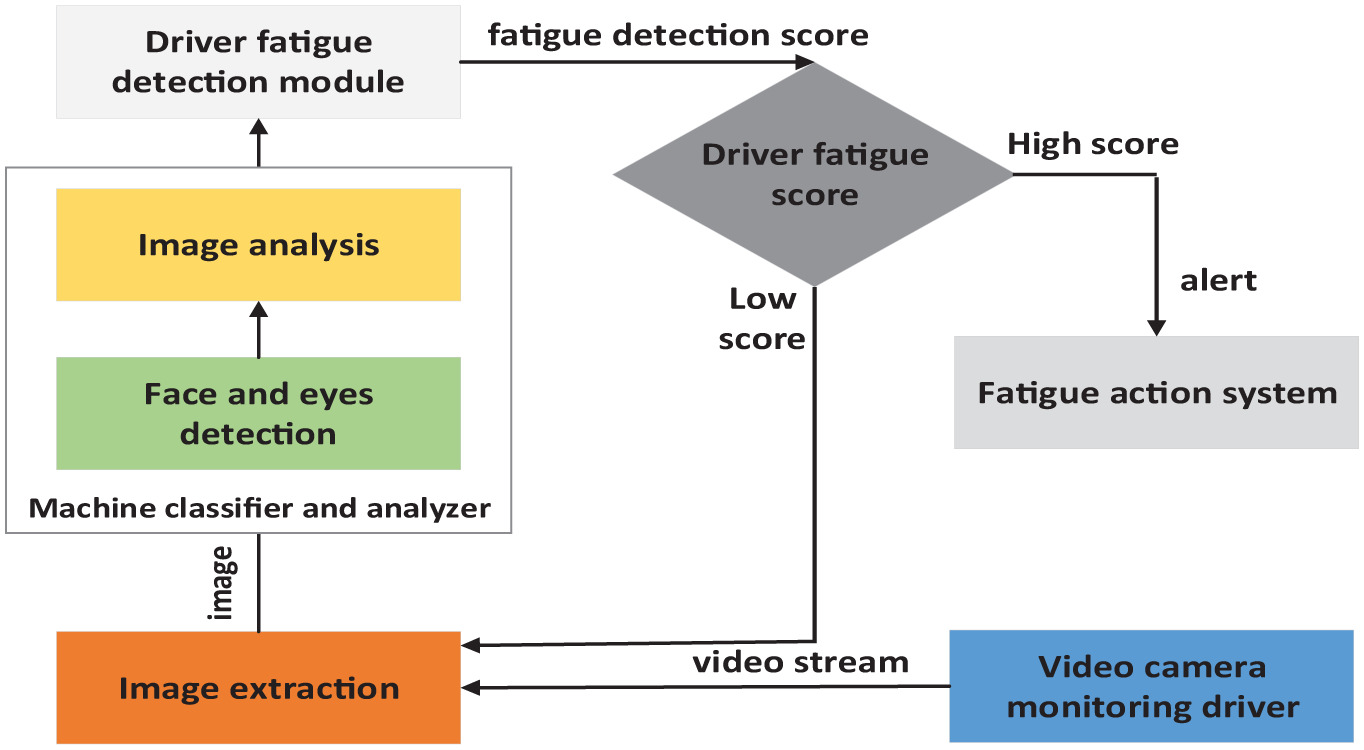
A module for Driver’s fatigue detection module.
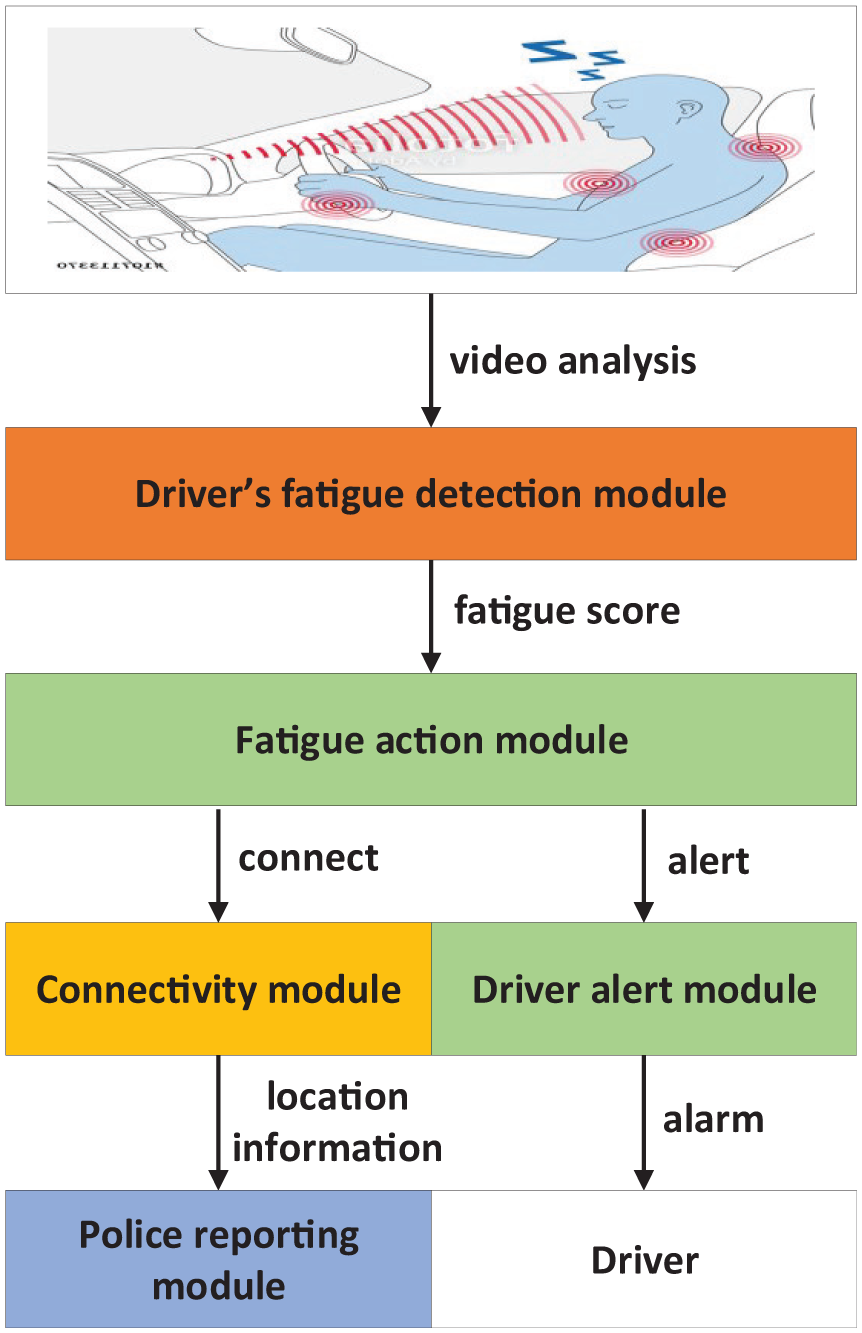
The fatigue action system is intended to gauge the crucial temperament of the driver’s drowsiness and requires suitable actions. An alert will be sent to the driver in the event that the degree of tiredness is significantly high as shown in Algorithm 2. The awakeness is listed in from the device too. A particular relay of warnings activates the coverage system by means of a connectivity module into the authorities network together with the driver’s latest GPS (latitude and longitude) spot as exhibited in Figure 4.


Driver’s fatigue action module.
The architectural version reflects the total operational procedure of this suggested system. The procedure for this suggested version starts by having a video camera that is active. The digital camera has been mounted before the driver. The camera also carries an online video flow that will be centered about the face area. The driver’s fatigue detection procedure found that the eyes and face employing the training of the machine learning-based classifier. This technique decides the exhaustion and drowsiness of the driver. The discovered fatigue worth is then passed into the tiredness activity technique. Cable alarm is made in case the values are significantly less with a connectivity module to the authorities, which notifies the cops in regard to the tiredness of this driver together with the driver’s present position as exhibited at Figure 5.
Architectural model for driver’s fatigue management system.
Drowsiness is a state of diminished awareness of mind associated with the desire to fall asleep. Drowsiness is the last stage before falling asleep. Drowsiness may be due to physical work or long trips without proper naps. Drowsiness detection system monitors, processes, recognizes the drowsy state, and gives results to the user; the user can then take actions on it. Drowsiness can be detected by capturing a sequence of images and constantly monitoring the eye movement. When the body is in a drowsy state, many physiological and behavioral changes occur, such as excessive yawning, decreased eye blinking rate, and slower heartbeat rate. It is believed that the drowsiness state of the driver can be detected early enough to avoid an accident. The detection system should be designed such that it will not distract the driver, will work in daytime and nighttime, and will give accurate results. The objective of our proposed framework is to provide an economical, non-intrusive, and efficient system to avoid accidents. All the processing of our detection system has been accomplished using MATLAB image processing tool.
In this section, an overview of the system is explained and then the proposed methodology is presented. The proposed detection system needs a wireless/wired webcam which is connected to a PC on which MATLAB is installed. This first step is the acquisition of the video of the driver and then this video is converted into the frames. The second step is segmentation of the images. As we are concerned with behavioral measures, eye state information is extracted from the images. Detection of eyes has been completed using the Viola and Jones algorithm using cascade object detection classifier. To detect the drowsiness, a morphological analysis is performed. Our system detects drowsiness by analyzing the eye closure state of the driver. The proposed system has been shown in Figure 5. The major stages are video acquisition, eye detection morphological analysis, and drowsiness detection as shown in Figure 8. The main stages of the proposed framework are demonstrated below:
(a) Video acquisition
The video acquisition is done using a camera installed in front of the driver’s face. Video acquisition refers to obtaining the live video of the driver. The live video stream is necessary for the analysis of the driver’s activeness during the driving process. The video acquisition can be good if proper lighting conditions are present at the time of driving. An embedded system is used to process the video acquired.
(b) Eye detection
As our main concern is to detect drowsiness using eye state information, the eye pair is extracted from each state using Viola and Jones Algorithm with cascade object detector classifier in MATLAB as shown in Figure 6. The images extracted from video stream are converted to binary images on by one. The boundary value function traces the exterior boundaries of objects, as well as boundaries of holes inside these objects, in the binary image. It also descends into the outermost objects along with its inside parts. Boundary values are dependent upon the size of the objects.
(c) Morphological analysis
After eye extraction, the image is further morphologically processed for iris detection. First, the image is converted into the grayscale image and necessary masking is done for morphological analysis. Then the complement of the grayscale image is taken and holes are filled and the image is eroded using disk-shaped structuring element. Using boundary value function iris boundary is calculated, as shown in Figure 6.
(d) Drowsiness evaluation
The boundary function values are used to calculate the area of the iris. The round objects give the metric values closer to 1. Therefore, a threshold value is set; if the driver is in the alert state, then the value will be approximately 1, as depicted in Figure 6. If the driver is in a state of drowsiness and the metric value is lesser than 1, then drowsiness will be detected and an alarm will be generated. The threshold value for the drowsiness evaluation is 0.94 in our developed system. The formula for drowsiness evaluation is as shown in equation (1)


Eye state measurements in D3S.
Results and discussion
The system proposed in this article has an acceptable level of performance with an average accuracy of 84.4%. The accuracy of the system is calculated by the number of truly detected faces and the number of false detections. The drowsiness detection is accomplished by setting a threshold value when the object is in the normal state and eyes are open during which the iris detection values will be approximately equal to 1. Otherwise, the values will vary from 0.2 to 0.5 according to the drowsiness level of the driver. The accuracy of the system can be enhanced by fusing this behavioral measures information with some sensors, that is, inertial measurement unit (IMU) sensor or pressure measuring sensor as shown in Table 4.
Results of the proposed system.

Real-time simulation of D3S
Wired connection among stationary IoT devices
This study uses simulation using a wire channel. Wires are very costly and it is impossible to connect vehicles with each other through a wire. For demonstration of this scenario, a simulation of a vehicle connected with wires is shown. Vehicle 1 is sending a message to Vehicle 2 when the driver is sleeping. This can be clearly seen in Figure 7. The label of X-axis and Y-axis are the distances measured in xx,yy format i.e., 13.5, 0.0 m/sec, which means 13.5 meters per second in X-axis and 0.0 meters per second speed of the vehicle.

Different time intervals of simulation in the wired connection among vehicles: (a) message sent, (b) acknowledgment sent, (c) information sent, and (d) other extra information sent.
True wireless connection among vehicles
The mobility nodes will move like vehicles. For simulation, we take 11 vehicles that can move freely in a given range. When a driver of any vehicle is found sleeping, an alert message will be generated and sent to all other vehicles. Therefore, other vehicles will take any safety precautions. In the simulation, the driver of the first vehicle is found sleeping. Vehicle 1 will send a message to all other vehicles that Vehicle 1’s driver is found sleeping during driving. Other vehicles will also get the position of Vehicle 1, which will help out other vehicles to take suitable action. Figure 8 shows the other vehicles reacting once they receive a message from Vehicle 1. The label of X-axis and Y-axis are the distances measured in xx,yy format i.e., 16.1, 0.0 m/sec, which means 16.1 meters per second in X-axis and 0.0 meters per second speed of the vehicle.

Different time intervals of simulation in True wireless connection among vehicles: (a) vehicle in position with true wireless connection, (b) sleeping driver’s vehicle sent message to others, (c) vehicles changed their routes, and (d) vehicle repositioned themselves.
False wireless connection among vehicles
For more clarity, we also make another simulation for the normal case. For differentiating the case when the driver is not sleeping, no message will be generated, so only Vehicle 1 will move and other vehicles will not move, as shown in Figure 9. The label of X-axis and Y-axis are the distances measured in xx,yy format i.e., 91.0, 0.0 m/sec, which means 91.0 meters per second in X-axis and 0.0 meters per second speed of the vehicle.

Different time intervals of simulation in the false wireless connection among vehicles: (a) vehicle in position with false wireless connection, (b) sleeping driver’s vehicle do not send message to others, (c) vehicles do not change their routes, and (d) vehicle do not reposition themselves.
Google Play store use case
On Google Play store, a range of applications are found. These apps are of quite a few types, for example, matches, motion pictures, instruction and music, and movie. The applications are of just two main types: paid and free. In this article, we have made a Google Play store dataset with categories of health application using the Google-play-scraper. By employing this scraper, we scraped 550 use cases of every single type of health application, both free and paid categories. From every single app on Google Play store, we were able to scrap almost 70 features, some of which used in this article are rankings, IAPs, marketing service, and installations. An evaluation of the dataset is performed. Investigation of dataset is completed in RStudio. Visualization of our analysis is shown in CIRCOS as in Figures 10 and 11. The title in the figures represents the name of the applications.

Sample screenshot of medical applications dataset.

Methodology diagram of Google Play store use case.
On Google Play store, thousands of applications are uploaded by the developers of Android application. These applications are downloaded by the users without any check and also without any analysis about the application, whether the application is suitable for the user or not. The fake or malicious applications can grab the personal information from the user and can damage the user’s trust on Google Play store. The legitimacy of the application cannot be measured because there is little information provided by the developers on the front end of the application. Even the Google Play store has no information about the source code of the applications. In this research work, we have visualized the IAP, percentage of advertisement support, rating, and installations in the representation of histograms of free and paid applications of medical category from Google Play store. We have visualized the relationship of different attributes in CIRCOS.
(a) Free medical offering IAP
In the IAP, a number of medical applications in Google Play store offer credits, products, and so on; these services can be availed by a user by performing some task or activity which is not relevant to that specific medical application. For example, some medical applications give coins by just buying through credit card, by filling survey form, by seeing adds or videos, and so on. Free applications mostly offer IAP because at the time of installation, free applications do not charge any credit from users of those applications. For visualizing the percentage of the defined attributes, we used Pie3D charts. The percentage of these medical applications shows that that 15% free medical apps offer IAP and 85% free medical apps do not offer IAP, as shown in Figure 12(a).
(b) Paid medical offering IAPs
Paid applications charge money at the time of installations, which is why these applications provide more comfort and satisfaction to their users. In the paid application, the ratio of IAP purchases is less. We can visualize the statistical information of paid applications and IAPs using Pie3D. It visualizes that 5% paid medical apps offer IAPs, whereas just 95% paid medical apps did not offer IAPs, as shown in Figure 12(b).
(c) Free medical advertisements
Advertisement plays an essential role in the success of the companies, brands, and so on. In the Google Play store, many applications contain the advertisement of different companies, which sometimes frustrates the users and sometimes gives helpful information. Free applications do not charge during installation, which is why most of the applications offer advertisements. The Pie3D charts visualize that 23% of free medical apps offer advertisements and just 77% free medical apps did not offer advertisements, as shown in Figure 12(c).
(d) Paid medical advertisements
The Pie3D chart shows that just 3% paid medical apps offer advertisements, and 97% paid medical apps did not offer advertisements, as shown in Figure 12(d), because the paid applications charge at the time of installation. Advertisements sometimes frustrate the user of the application, but the paid application users make sure the they are comfortable with the application. In paid applications, the advertisement ratio is less as compared with free applications.

Different medical applications: (a) free IAP, (b) paid IAP, (c) free ads support, and (d) paid ads support.
Free medical rating value
Thousands of the users download the applications from Google Play store for specific purposes. These users have their own experience related to that application. On the basis of this experience, the user gives a rating to that application. In Google Play store, the ratio of the rating has been set from 0 to 5, where 0 indicates that this application is very bad and 5 indicates that this application is too good in the sense of usability. The rating attribute is visualized in the form of a histogram that shows how people rate free medical apps. Most of the users of the medicals applications give 4.2 ratings to free applications, which is visualized in the histogram shown in Figure 13.

Free medical application rating trends.
Paid medical rating value
A histogram shows how people rate the paid medical applications (Figure 14). It can be visualized that most people give 5 ratings to paid medical applications. However, as compared with free medical applications, users do not hesitate to give 0 ratings for paid medical applications if they are unsatisfied because they buy the apps.

Paid medical application rating trends.
Free and paid medical application installations
The number of installations of each application plays an important role in showing the popularity of the application. Figure 15 shows some installations of free medical applications in different categories. As we can see, the free category has a higher number of installations when compared with the paid category. If, in Google Play store, we can find a category in which installations are highest, we can guide developers to try their skills in that category. The following diagram shows some installations of paid medical applications in different categories. As we can see, the free category has a higher number of installations compared with other categories.

The number of installations for free and paid medical applications.
CIRCOS visualization for free and paid medical applications
We used CIRCOS for visualization and analysis of attributes of free and paid applications; we have four attributes: ratings, IAPs, advertisement support, and installations. CIRCOS is a tool in which multiple dependent and independent variables could be easily identified. The position of the object can be easily identified in the circular layout of the data. We used the CIRCOS package for the visualization of the information. CIRCOS illustrates the link ratio between different attributes of free and paid medical Android applications, which identifies the symmetries among the values, as shown in Figures 16 and 17 respectively. The plot is drawn against the number of installations and with the rating of the applications related to free and paid medical applications on Google Play. Some of the applications offer IAPs and support of ads. The representation of IAPs and the support of ads is very limited in the figures because these two values are very rare in the applications. In the configuration of the visualization in CIRCOS, many libraries are included for different purposes and these libraries have their own functionalities. The percentile of the colors shows the percentage of the color density of each observation in statistics. The components drawn can change the orientation, color, and scale. The color configuration can show every type of color and its usage.
(a) Configurations
In the visualization using CIRCOS, there are always many libraries with unique functions. The meaning of these colors exhibits the proportion of this coloration density of every point in the number scale. The color components could transform the orientation and along with settings may demonstrate every kind of coloring, which along with every type may take advantage of these settings.
(b) Percentile configuration
This library indicates the feasibility of color usage that is just a step employed in numbers suggesting the significance under a certain proportion.
(c) Components scaling configuration
In this section, we can correct the components’ scale, shade, and orientation. Finding the ideogram design correctly is essential. Generating all elements seem like precisely the same size may highlight the contrast between comparative components in the CIRCOS graph.
(d) Colors configuration
Even the <colors> block comprises all of the coloring definitions. CIRCOS has a substantial number of default coloring definitions (pure colors and colors, Brewer palettes, UCSC chromosome color schemes, luminance-normalized colors, and so forth). You always need to incorporate them on your settings in the “.conf” files, which is available to you with the name of “CIRCOS.conf.” Importing this document can specify fonts, colors, and designs, utilizing the proper block-structure.

CIRCOS free medical application visualization.

CIRCOS paid medical application visualization.
Conclusion and future work
In the research study, a driver’s drowsiness detection system is developed, which can help to avoid or reduce the number of accidents in Pakistan. D3S is efficient and cost-effective, and requires a high-quality webcam for capturing the drowsiness of the driver and a processing system. The testing of D3S is performed using the MATLAB environment. The system measures the drowsiness based on eye closure state of the driver and gives an accuracy of about 85%. When drowsiness of any driver is captured, a message alert will be delivered to all other vehicle drivers in the vicinity of the sleepy driver; for this, different sensor nodes are used. Another unique feature of the sensor network is the cooperative effort of sensor nodes. Sensor nodes are fitted with an onboard processor. Some of the application areas are health, military, and security. For example, the physiological data about a patient can be monitored remotely by a doctor. So, for measurement and analysis, we build a Google Play store dataset with all free and paid applications of the medical category by using the Google-play-scraper. By using this scraper, we scraped at least 550 applications of each category of medical applications in free and paid categories. On each application on Google Play store, we scraped almost 70 attributes, but we used only four attributes for our analysis. We envision that, in the future, wireless sensor networks will be an integral part of our lives, more so than the present-day personal computers.
In the future, the system will be combined with physiological measures or with vehicular measures to yield more accurate results. The warning system can also be improved in such a way that when the system detects that the driver is drowsy, it should either stop the car or slow down the car to avoid accidents. To analyze the driver’s drowsiness, we can build an IoT-based medical application. There are thousands of IoT-based medical applications uploaded by developers that can assist and guide the users of the applications. We can build an Android application that could be more useful for users. For this, we should have an understanding of which category of IoT-based medical application is suitable for this research. The delay factor will be added in the network simulation so that a realistic scenario can be emulated.
Footnotes
Handling Editor: Suleman Khan
Declaration of conflicting interests
The author(s) declared no potential conflicts of interest with respect to the research, authorship, and/or publication of this article.
Funding
The author(s) received no financial support for the research, authorship, and/or publication of this article.