
Abstract
In the context of fingerprinting applications, this article presents the performance analysis of a type of space labeling based on the binary quantization of the received signal strength indicator. One of the common drawbacks of fingerprinting is the large data size and consequently the large search space and computational load as a result of either vastness of the positioning area or the finer resolution in the fingerprinting grid map. Our approach can be considered, for example, when we use very small, inexpensive beacons, like those based on bluetooth low energy technology, radio frequency identification, or in the future context of the Internet of Things. One of the interesting properties of this deployment is that it can be interpreted as a form of space labeling or encoding since space is divided into cells, and each cell is associated to a binary codeword with the corresponding scalability of the spatial resolution. Here, it developed the performance estimation, exploiting the association of this deployment to an error correcting code. The analysis and numerical and experimental results allow a deeper understanding of the impact of the proposed solution and show that it is robust and computationally efficient with respect to the traditional fingerprinting technique.
Introduction
Due to recent developments in hardware electronics and communications, wireless personal area networks (WPANs) and wireless sensor networks (WSNs) have found outstanding importance in diverse applications such as industrial, medical, public services, and many other fields. At the same time, Internet of things (IoT) is expected to become the pervasive infrastructure of the information society. In this context, position information is an important enabler of new and future value-added services.
In the last decade, we observed a constant growing effort, both from scientific communities and from the industry in order to design a global solution for the indoor positioning and navigation that achieves high precision, reliability, and cost effectiveness. The availability of such IPS (Indoor Positioning Systems) will enable advances in location-aware applications, pervasive computing, and ambient intelligence. According to Wirola et al., 1 the high-accuracy indoor positioning will be based on dedicated positioning-specific tags, and this is because of the trade-off between costs and performance. In fact, the wireless local area network (WLAN) technology offers the best solutions in terms of costs and this thanks to the reuse of available infrastructures although it has many limitations in terms of accuracy and reliability. A solution based on bluetooth low energy (BLE) technology offers several advantages. Indeed, it ensures that the mobile terminals require no new hardware components and that the radio components are already in mass-production keeping the costs of deployment and new applications low. As a result, it represents a valid candidate for a large-scale solution.
The targets’ position can be estimated via geometrical, Bayesian, or pattern-matching approaches.2–4 The geometrical approaches use range-based techniques such as triangulation and multilateration. The range is estimated from the received signal exploiting different signal metrics, for example, time of arrival (ToA), angle of arrival (AoA), and received signal strength indicator (RSSI). The Bayesian approaches, used mainly for tracking application, compute the probability density function of the target position, providing its mean value as the estimated position and the variance as the uncertainty of the estimate. The pattern-matching approaches or fingerprinting (FP) take advantage of location dependent (LD) features of the signals received by static reference stations, or beacons: these signals, typically RSSI measures, are exploited as unique signatures associated with the target locations. First, a radio map containing stored LD parameters measured over predetermined points (grid points) is built during an off-line or training phase and then the target position is estimated via pattern matching between measured LD parameters and those previously recorded. In He and Chan, 5 it is possible to find some recent trends in two of the major research areas for FP localization: advanced localization techniques and efficient system deployment. Among the advanced approaches, some techniques are based on location-specific characteristics of multipath instead of RSSI as in Wu et al. 6 and Jin et al., 7 while, in the specific area of IoT applications, the RSSI database is assisted in the online phase by other methods for increasing positioning accuracy, as magnetic or dynamic measures from other sensors or prediction models, as in Lin et al. 8 On the contrary, where complexity and costs are a hard constraint, the FP techniques are used since they can be really easy to implement and are cost-effective, while maintaining a reasonable degree of accuracy. Among the main complexity issues, we can observe that the search space during the online step can be computationally intense, either because the deployment area is wide (e.g. smart city, hospitals, or large factories) or because it is based on devices, such as BLE tags, with strong limitations on power consumption and limited hardware capabilities. In order to overcome this restraint, the works in Arya et al. 9 and Saha and Sadhukhan 10 have proposed clustering and spatial filtering techniques that limit the positioning algorithm to a subset of reference points (RPs) in order to narrow down the search space and focus on the relevant subset of RPs.
In this context, in the past, we have focused on the possibility of reducing further complexity and requirements of FP systems based on simple beacons in limited indoor environments. In Mizmizi and Reggiani, 11 we have investigated the role of quantization in the RSSI information. The obtained results showed that the computational complexity can be reduced, without loss of precision, by adapting the RSSI quantization with respect to the variance of the measurement noise. In Mizmizi and Reggiani, 12 we have focused on the simplest quantization, with two levels, exploring its relations with binary encoding. We have introduced a new scheme of a specific binary representation of the RSSI signatures and the measures (binary fingerprinting or BFP). This novel design is appropriate when the beacons are characterized by very limited size, cost, and computational capability, like in the BLE or in the future technologies for the pervasive IoT. In addition to the pure localization, BFP can be used for creating an ordered partitioning and labeling of the space, available in a simple and inexpensive way to each device in the covered area, with numerous potential applications in the area of context awareness.
In this article, we consider the design presented in Mizmizi and Reggiani, 12 developing the analytical estimation of the space discrimination provided by this novel spatial labeling. Therefore, the main contributions of this article are
Analytical analysis of the FP technique in two cases: in the former, the number of RSSI quantization levels is assumed infinite, while, in the latter, the quantization levels are reduced to
Interpretation of BFP as a spatial encoding with scalable resolution and logarithmic search of the solution;
Validation of the numerical results, through experimental tests and channel models derived by experimental measures. The numerical findings, either by means of appropriate analysis, simulations, and experimental measures, show the impact of different parameters and channel conditions on the system performance.
The remainder of this work is organized as follows: the “System model” section describes the network scenario and the “Review of FP techniques” section reviews the FP techniques. In the “BFP design” section, we introduce the BFP approach and, in the “Analysis of FP performance” section, the analysis of both BFP and FP techniques. Finally, in the “BFP performance” section, the numerical results are reported and discussed.
System model
The considered network model is the same as used in Mizmizi and Reggiani,11,12 that is, an asynchronous sensor network containing a number of target devices over a limited squared area on a single floor, with two-dimensional coordinates
In the area, there is a set of

Any position can be represented by a triplet with label
The experimental measures are taken in a room at Dipartimento di Elettronica, Informazione and Bioingegneria (DEIB) of Politecnico di Milano, whose map is sketched in Figure 1.
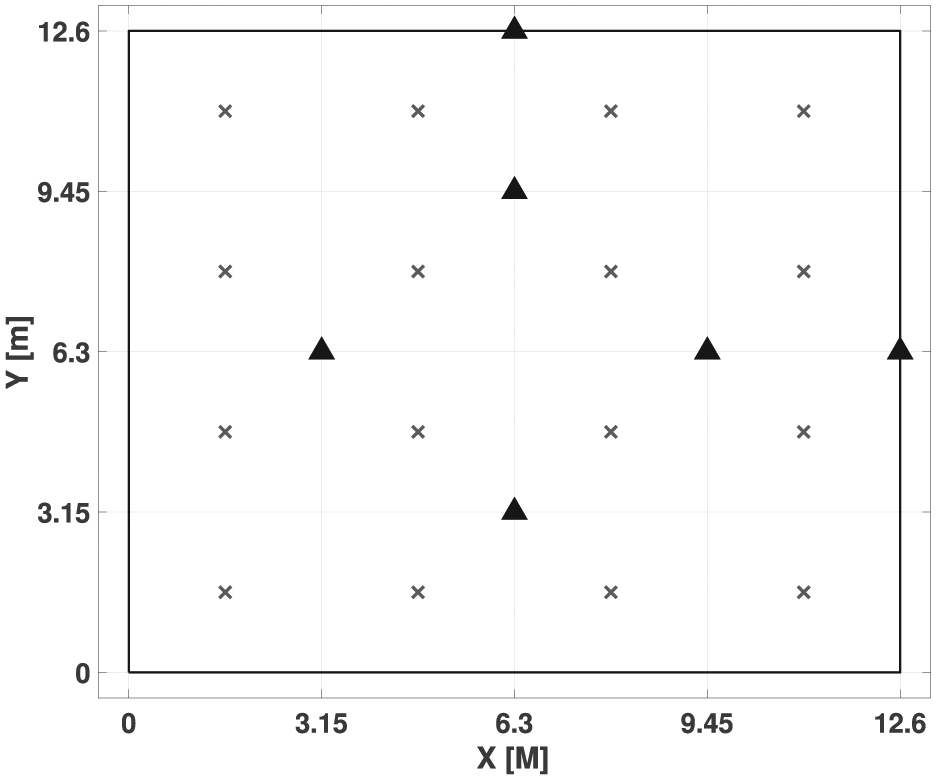
Map of the environment used for the experimental measurements. The triangles represents the BSs and the crosses are the FP signature locations.
Signal model and measures
The most common model adopted for the real RSSI, recorded and stored during the off-line phase, responds simply to the received power under log-normal shadowing and receiver isotropic antenna gain 0 dB, that is

where the Effective Isotropic Radiated Power EIRP incorporates the transmitter power and the antenna gain,
According to the relative position between the point on the grid and the beacon, the values of
Channel random fluctuations (or multipath fading), widely studied in outdoor and indoor environments 14
System impairments, 15 such as differences in target device types, user orientation, environmental changes, mobile devices in different places, or heights (pockets, bags, hands, etc.)
Therefore, the RSSI measures are modeled with an additional random log-normal component, uncorrelated to the channel shadowing component in equation (2)

where

RSSI levels from beacons 3 and 5 in the environment used for the experimental measures: (a) beacon 3 and (b) beacon 5.
Values of the channel model derived from the experimental measures.

RSSI: received signal strength indicator.
Review of FP techniques
Conventional localization algorithms using signal information like ToA, RSSI, or AoA face a serious performance degradation in indoor environments affected by phenomena like harsh multipath and NLoS. Taking advantage of LD features of the radio signal, there can exist a radio map containing LD parameters measured in predetermined points called grids so that target position can be estimated using pattern matching algorithms. In IPS based on radio frequency (RF) technologies such as WLAN or BLE, FP methods are among the most used, 3 thanks to their simplicity and reliability. There is a variety of measurements that can be used. The most common is the RSSI, but also signal to noise ratio (SNR), link quality information (LQI), channel impulse response, and others can be exploited.
FP is implemented in two basic steps: in the first step, which is called off-line or training phase, LD parameters of the received signal are measured in a grid-based map over the surveyed area; these are stored, and they form the so called radio-map. In the second phase, also called online phase, the target position is estimated by pattern matching between ongoing measurement of LD parameters and the stored radio-map.
The construction of the radio-map begins by dividing the area of interest into cells with the help of a floor plan. The RSSI values of the radio signals transmitted by beacons are collected by a test target inside the cells (or calibration points

where
During the online phase, the target collects a vector of measurements (here RSSI) from the beacons

In order to estimate the position of the target user
Deterministic: the position of the target user
where

where ∥.∥ is a norm, for example, the Euclidean.
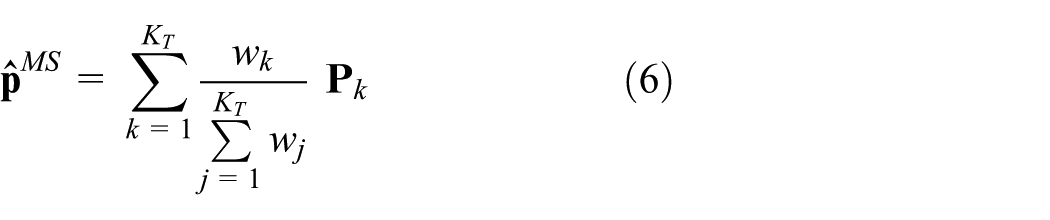
The estimation technique described in equation (6) is known as “Weighted K-Nearest Neighbor” (WKNN), and it is one of the most used by the FP algorithms. When all the calibration points use the same weight, it is called “K-NN,” and when
Probabilistic: the position of the target user
FP-based methods produce accurate estimation of position in indoor environments; 17 they are easy to implement and the cost of the system is low since there is no need of further hardware, being RSSI measurements available in each radio technology. However, they have two main drawbacks: first, the off-line phase is laborious and time consuming, and changes in the environment can also compromise the overall system. Second, the vastness of the radio-map can make computationally heavy the on-line estimation, especially for IoT devices.
BFP design
In Mizmizi and Reggiani,
12
we have presented the BFP design, where the system is seen from a different point of view, related to a binary code interpretation of the FP scheme. The

where, in the binary case
In order to design the BFP scheme, the main steps are
Given the area of interest
Define the cell size

Define a beacons placement, according to an iterative procedure, similar to the Gray code encoding process,
18
which allows the elimination of the ambiguities among the binary representations of the cells and the achievement of a minimum Hamming distance, important for an effective distinction of the cells in the space.
12
For a generic number of beacons

The numbers of beacons for the minimum
Quantization of each RSSI measures in

Number of beacons in order to guarantee

The code weight
The threshold
Discard all the cells that do not belong to the effective area of interest
This design is referred to a static situation of the RSSI and of the beacons placement; in presence of a dynamic condition, caused by fluctuations or permanent changes of the channel propagation, the algorithm update is limited to the change of the
Another aspect to remark is that, due to the irregularity of the real RSSI field (e.g. in presence of shadowing) and to the non-exact coincidence between the ideal designed borders (e.g. the lines delimiting the square cells considered here) and the RSSI field lines corresponding to the thresholds
Analysis of FP performance
The design of an FP-based IPS is a complex task since it is not limited to some general guidelines, but most of the time, it requires a tuning phase after that the system has been deployed, for example, it may be necessary to add or move some beacons, optimize the radio map, etc. The scope of the FP analysis is to help the designer, and to save time and costs. This is possible by predicting analytically the expected performance of the systems. In this section, we propose an analytical solution for both cases,
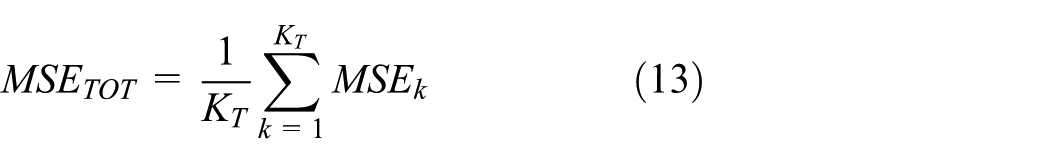
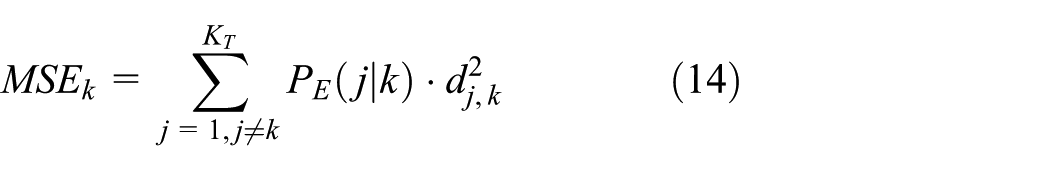
The main metrics we are considering in this analysis are the label selection error (LSE) and the mean square error (MSE). Therefore, given a FP-based localization system, with
where
where
The NN estimation method is considered for intercepting a performance upper bound;
The performance is computed limiting the target positions to the grid points at the centers of the cells. However, the analysis can be extended to all the points in each cell, also considering the issues related to the RSSI irregularities commented at the end of “BFP design” section, whose impact is higher for the points closer to the cells borders.
The performance estimation can be applied also to experimental RSSI measures, including the impact of correlated shadowing. After the off-line FP phase, there are

The elements

These measures can be obtained directly by experimental measures or they can be modeled according to equation (3). For the analysis, each component in equation (16) is assumed to be a random variable with the following assumptions:
The random variables
The random variables
The (sample) standard deviation of all the random variables
For
For
Case
The idea behind our approach comes from the signal theory and the corresponding geometrical interpretation of the FP technique. For the sake of simplicity, let us assume to have a system with two beacons: the radio map could be seen as a set of points scattered in the signal space as in Figure 3. Given the online FP, the estimated position is the FP with the minimum signal distance. From a geometric point of view, this means that the online FP belongs to the Voronoi region of the estimated FP. Therefore, the LSE probability of j given k in equation (14) can be computed as

where


Example of 2D radio map with the corresponding Voronoi’s regions.
The integral in equation (17) can be very complex, also with numerical approximated methods, especially when the number of beacons grows. In Swangmuang and Krishnamurthy, 19 they propose to use the concept of proximity graph in order to compute a lower bound solution to the probability of selecting correctly a FP and therefore to optimize the radio-map. However, to give a more general analysis, we are interested in predicting the MSE or the LSE. Therefore, our solution approximates the Voronoi’s regions with hypercubes in the multidimensional space, making their calculation possible in all the cases, since the multi-dimensional integral reduces to the product of mono-dimensional integrals. The proposed approach can be summarized as follows:
Compute the minimum signal distance

For each jth FP, define a hypercube with side equal to the minimum signal distance in equation (19) and centered at the jth FP;
Compute the LSE probabilities in equation (17) integrating the multivariate normal in the regular hypercube;
Compute the final MSE with equations (14) and (13).
Case
In this case, which can be extended to the non-binary case with
For each FP vector
The Hamming distance

The probability

where
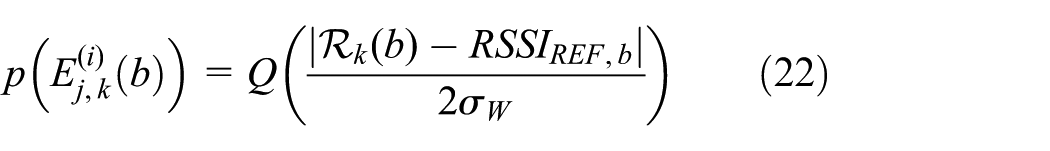
When all the set of LSE probabilities
To extend the proposed method for considering not only the center of each cell but any random position, equation (22) has to be averaged over the entire cell changing the signal distance at the numerator; it is clear that the points closer to the cell borders will show the highest error contributions. In order to facilitate the integral, it is possible to use the distributions of the signal derived in Appendix 1, which can be considered approximately Gaussian when the cell size is small.
BFP performance
The main advantage from reducing the RSSI to a binary representation is the increment of the computational efficiency. BFP provides two advantages from the computational point of view:
Decrease of the storage memory (and/or of the time necessary for the transmission of the data necessary for positioning from/to the target devices), thanks to the binary representation of the FP.
Increase of the algorithmic efficiency, which can be evinced directly from the iterative code construction presented in “BFP design” section: the signature search can proceed in a logarithmic way, starting from the most significant bits (the first beacons, with the longest transmission range), halving at each bit the search area, and finishing with the least significant bits, corresponding to the fine division among single cells. Therefore, the logarithmic search is computationally more efficient since the best solutions can be found in
The validation of the proposed technique is carried out through real experiments and numerical simulations. The case with
Experimental validation
The experimental measurements are collected in a class room of the Politecnico di Milano as described in Figure 1. The beacons used are BLE sensors from Silicon Labs,
20
while the target user is the BLE 112 development board.
20
The beacons transmit continuously BLE packets that contain the MAC address of the transmitter, the receiver board, store for each received packet, the ID of the sender, the RSSI estimated, and the time-stamp. For each of the
The results in Figure 4 show the cumulative distribution function of the error from real experiment and numerical simulation, while the analysis for both cases, under the same conditions, shows an average error of

Experimental results obtained in the environment shown in Figure 1.
Numerical validation
In order to extend the investigation of the impact of the main design or channel model parameters on the MSE, we are making the following assumptions for the remaining simulations and analysis, unless differently specified:
The parameters of the channel model are taken from Table 1. These are derived by analyzing the experimental measurements;
Elements of the sample vectors
A square grid
The algorithm NN is used to estimate the target position;
The binary labels derived for the scenario under consideration are reported in Figure 5;
Ideal receivers sensitivity (
In the simulations, the target locations are extracted randomly among the cells centers and the number of runs is

Reference environment for the numerical results from the channel model.
Numerical results in Figures 6 and 7 show how the MSE varies as a function of the standard deviation
When the propagation becomes more difficult, that is, a higher standard deviation of the measurement error
The performance gap around 2 dB between
The Figure 7 shows that, as the propagation becomes more difficult, or the pathloss increases, the MSE falls in both cases. This effect is due to the increase of the average signal distance between all the FPs, which decreases the probability of error.
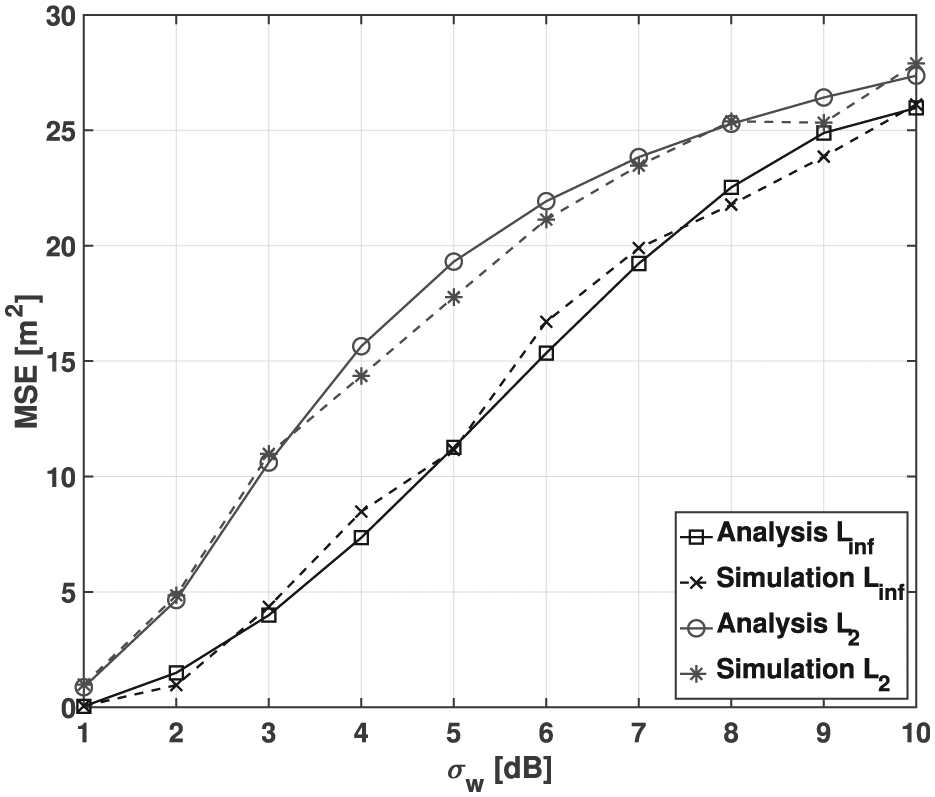
MSE obtained by simulations (dashed lines) and analysis (continuous lines) as a function of the measurement error standard deviation

MSE obtained by simulations (dashed lines) and analysis (continuous lines) as a function of the pathloss exponent
Finally, Figure 8 shows an interesting property of BFP with respect to
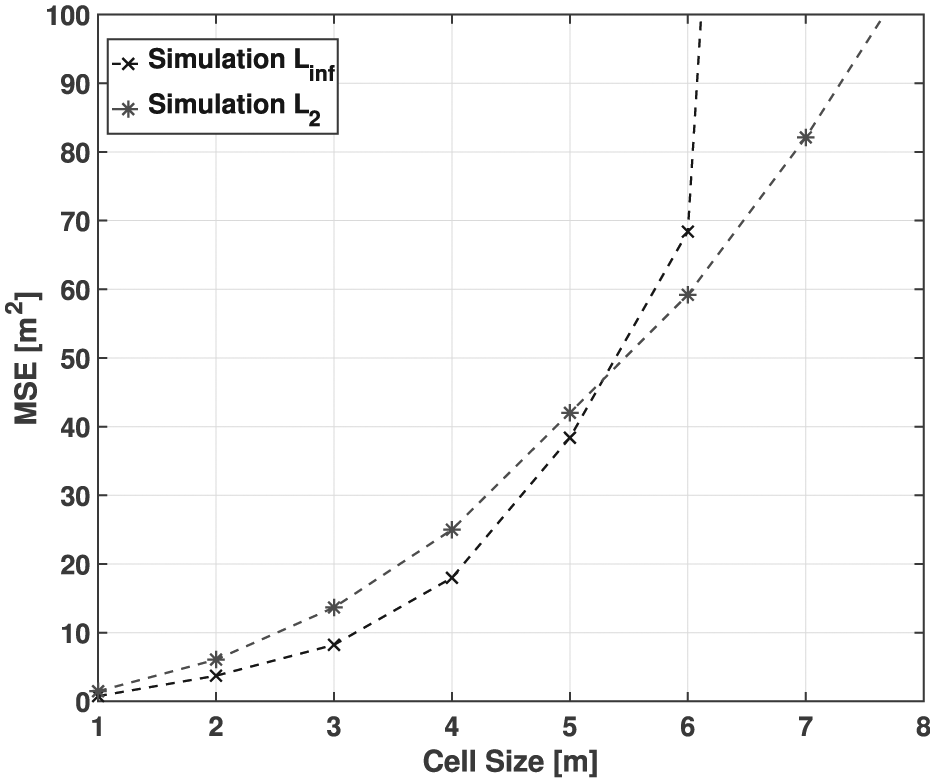
MSE obtained by simulations as a function of the cell size, and for a fixed receiver sensitivity equal to −92 dBm.
Conclusion
In this article, we have developed the performance analysis in case of binary quantization in the RSSI signatures for FP localization. The study has exploited the design principles of BFP and the related similarities with the binary codes theory. In fact, using a single bit to represent the RSSI, it is possible to make the layout design starting from the concept of Hamming distance between the vectors of the radio map, which is directly related to the localization performance. The analysis and the simulations have revealed the performance compromise between BFP and the ideal case without quantization and the impact of the main channel parameters as well. The BFP looks computationally efficient, often with comparable performance with respect to conventional FP and suited to scenarios in which the computational and storage simplicity are the primary design factors, as for BLE devices, radio frequency identification (RFID) tags, or microsensors. Nevertheless, it is always possible to tune a performance compromise between the number of beacons and the number of measures for each position estimate with a consequent impact on the latency.
Footnotes
Appendix 1
When the target location is in any position of the cell, the approximate analysis relies on the derivation of the signal distance probability density function. Let us assume that target location
If we consider
where
and similarly for
and the transformation from physical distance to signal follows as
where
where
We observe that
Handling Editor: Antonio Lazaro
Declaration of conflicting interests
The author(s) declared no potential conflicts of interest with respect to the research, authorship, and/or publication of this article.
Funding
The author(s) received no financial support for the research, authorship, and/or publication of this article.