
Abstract
Multivariate statistics process monitoring can achieve dimensionality reduction and latent feature extraction on process variables. However, process variables without beneficial information may affect the monitoring performance. This article proposes a distributed principal component analysis method based on the angle-relevant variable selection for plant-wide process monitoring. The directions of principal components are utilized to construct the sub-blocks, where the variables in each sub-block are determined by angle. After establishing the principal component analysis model in each sub-block, the monitoring results are fused by Bayesian inference. The simulation results show that the proposed method can select the responsible variables effectively and enhance the monitoring performance.
Keywords
Introduction
The monitoring and diagnosis of a chemical process is crucially important to ensure the safety and the quality of the product.1–7 With the rapid development of the modern industries, a large amount of data emerges and a new challenge to multivariate statistics process monitoring (MSPM) is given. In the area of MSPM, some approaches have been reported.8–12 Among these methods, principal component analysis (PCA) is the most basic and widely used method.13,14 By projecting the data into two low-dimensional spaces (the principal component space (PCS) and the residual space (RS)), the high-dimensional and correlative data can be effectively operated. However, the traditional PCA methods cannot serve well for complex plant-wide process monitoring.15,16
In order to better monitor the plant-wide process, multi-block monitoring methods or distributed monitoring methods have drawn much attention. The measured variables are generally large in a plant-wide process and the correlations among variables are complex.17–19 To deal with these problems, different methods have been developed.20–22 For example, a monitoring and diagnosis of charts is developed to enhance the performance in each sub-block. 20 Several multi-block PCA and partial least squares (PLS) algorithms are provided in Westerhuis et al. 21 and interpreted with a unified notation. With the same motivation, a particular analysis of multi-block PCA and PLS algorithms is supplied in Qin et al. 22
In distributed monitoring, the block division is a premier step. Usually, the process knowledge is assumed to be known in the block division step, which is not always available in practice. In this case, the data-based multi-block methods that conduct the block division automatically are of significant interests.23,24 Due to the limitation of the cognition or experience, a distributed PCA (DPCA) is first proposed for plant-wide process monitoring in Ge and Song. 23 This method can automatically divide the original data into several sub-spaces/sub-blocks by different directions of principal components (PC). Therefore, the local behavior of the process can be reflected by these sub-blocks and the monitoring performance can be improved by the fusion of individual sub-blocks results. Subsequently, several methods are proposed for block division in a plant-wide process.25–28 For example, a multi-block monitoring method is proposed by adopting the mutual information (MI) in Jiang and Yan 25 and Xu et al., 26 a modified multi-block PCA algorithm is developed for extracting block scores in Tong and Yan, 27 and a dynamic decentralized PCA method is introduced for modeling and monitoring dynamic processes in Tong et al. 28 Recently, a parallel PCA-KPCA method and performance-driven method are proposed to solve the nonlinear distributed monitoring problems.29,30 However, in the DPCA method, the variables in the constructed residual sub-space/sub-block cannot be accurately selected by using the mean of the residual loading matrix, even if the contribution of variables to the PC can be indicated by each element of loading vector.
As one of the effective tools of statistical theory, Bayesian inference has been successfully applied to distributed monitoring.23,25,26,31,32 In order to fuse the monitoring results of all sub-blocks after obtaining the monitoring model in each sub-block, the DPCA methods utilize the Bayesian inference strategy to combine all sub-blocks results.23,31 Furthermore, this strategy has been widely applied to the fusion stage, such as the MI-based distributed monitoring methods.25,26 Fault diagnosis is another key step for distributed monitoring.18,26,32,33 As a widely used fault diagnosis method, the contribution plot method received attention.18,26 Recently, the Bayesian fault diagnosis is proposed to provide timely diagnosis result of the whole process. 33 Through the above analysis, how to effectively integrate the results of each sub-block and diagnose the fault is critical.
This article proposes a DPCA method based on the angle-relevant variable selection to monitor plant-wide process, which is named as ABPCA. In the proposed ABPCA, the sub-blocks are obtained through different PCs directions, which are uncorrelated with each other. Considering the influence of variables, the subset in each sub-block is selected by the angle between the variables and the corresponding PC. To overcome the limitation of DPCA, the angle between the variables and the residual sub-space/sub-block is computed to determine the variables in residual sub-space/sub-block. After that, the PCA model is established in each sub-block and the final monitoring results of all sub-blocks are fused by the Bayesian inference. Finally, a modified contribution plot method is constructed to diagnose the responsible variables after the fault is detected.
The rest of the article is organized as follows. The PCA monitoring method is briefly introduced, and then the proposed ABPCA method is presented. Next, the performance of the ABPCA method is validated by a numerical simulation and the Tennessee Eastman (TE) benchmark process. Finally, the conclusions are drawn.
A description of a PCA-based process monitoring
Considering a dataset

where
For an online sample


where
Method
Sub-block division and angle-relevant variable selection
Because a large amount of data is collected in a plant-wide process, the correlations among process variables are complex. The multi-block scheme can solve this problem by dividing the variables into different sub-blocks, and each sub-block contains the relevant variables. In ABPCA, the block divisions are implemented through an automatic way in PC directions and a variable selection method based on the angle is used in each sub-block.35,36
Assume that the process data are

The loading matrices in PCS and RS can be obtained as


The items in equations (5) and (6) are orthogonal with each other. For accuracy, the diversity is required in the block division step. Hence, the diversity between the sub-blocks can be fulfilled when the individual sub-block models are built in these uncorrelated directions. On the contrary, if the most relevant variables are selected in each sub-block, the most significant information can be preserved. Therefore,


After constructing the sub-blocks, the variables in each sub-block need to be determined. In this article, the angle is used to quantify the contribution between each variable and each sub-block. The smaller the angle between variable and sub-block, the greater the relevance of variable with the sub-block. For each sub-block, two different types of contribution indices are defined as the criteria to select the process variables.
In PCS, the contribution of the variable

where

Based on vector


The singular value decomposition (SVD) of

The angle between the vector and the subspace extended by the matrix can be obtained by

Thus, according to the contribution indices given by the equations (9) and (10), the variables with high contribution values will be contained in the corresponding sub-blocks.
Fault detection in ABPCA
While the selection of variables in each sub-block with respect to contribution indices, the PCA models of individual sub-blocks can be developed as

where
In order to provide an intuitive indication of the process status, the monitoring results of all sub-blocks must be combined properly. In view of the efficiency in statistics fusion, Bayesian inference strategy is used here.16,39 In Bayesian inference, the fault probability with respect to the


where

where “
Similarly, the fault probability with respect to the


where the conditional probabilities

Then, the final probabilistic statistics can be obtained as

When the value of
Fault diagnosis in ABPCA
After detecting the fault, it is necessary to determine the root cause of it. The contribution plot method is widely used in PCA-based monitoring for identifying the responsible variables of fault.18,26 Below, the contribution plot for the ABPCA is introduced.
For the bth block

where

where

Similarly, the contribution of the variables to the

where

In order to obtain more reliable results, in this article, the mean value of the contribution of variables during a certain period is usually considered.
Implementation
The flowchart of ABPCA strategy is presented in Figure 1. The implementation procedures can be summarized as follows:
Collect training data set
Construct sub-blocks based on PCA decomposition using equations (4)–(8); select the variables for each sub-block with respect to angles according to equations (9) and (10).
Establish the PCA monitoring model for each sub-block.
For each monitored sample, calculate its statistics of all sub-blocks.
Combine these statistics by Bayesian inference using equations (16)–(23).
Detect the abnormal condition when
If a fault is detected, the root cause of the detected fault is determined by using equations (26) and (27).

Flowchart of the ABPCA strategy.
Simulation
Numerical example
Consider a simple example with five Gaussian distributed variables, as shown below in equation (29)

where
Two fault datasets are generated to test the proposed method which consists of 500 samples.
Case 1: From sample 151 to sample 500, a step change of 1 is added to
Case 2: From sample 151 to sample 500, a step change of 3 is added to
The monitoring results of the traditional PCA and ABPCA are shown in Figures 2–7. From Figure 2, we can see that the monitoring performance of the proposed ABPCA method is better than the traditional PCA method for case 1. Specifically, the monitoring performance of PCA is extremely poor in Figure 2(a), while a fault is detected from the 151 point in Figure 2(b) by using the ABPCA. In order to demonstrate the detailed monitoring performance, the monitoring results in sub-block 1–3 are presented in Figure 3(a)–(c). Based on the angle-relevant variable selection, the variables

Monitoring results of case 1: (a) PCA and (b) ABPCA.

Monitoring results in sub-blocks: (a) sub-block 1, (b) sub-block 2, and (c) sub-block 3.

Contribution plots of ABPCA: (a)

Monitoring results of case 2: (a) PCA and (b) ABPCA.
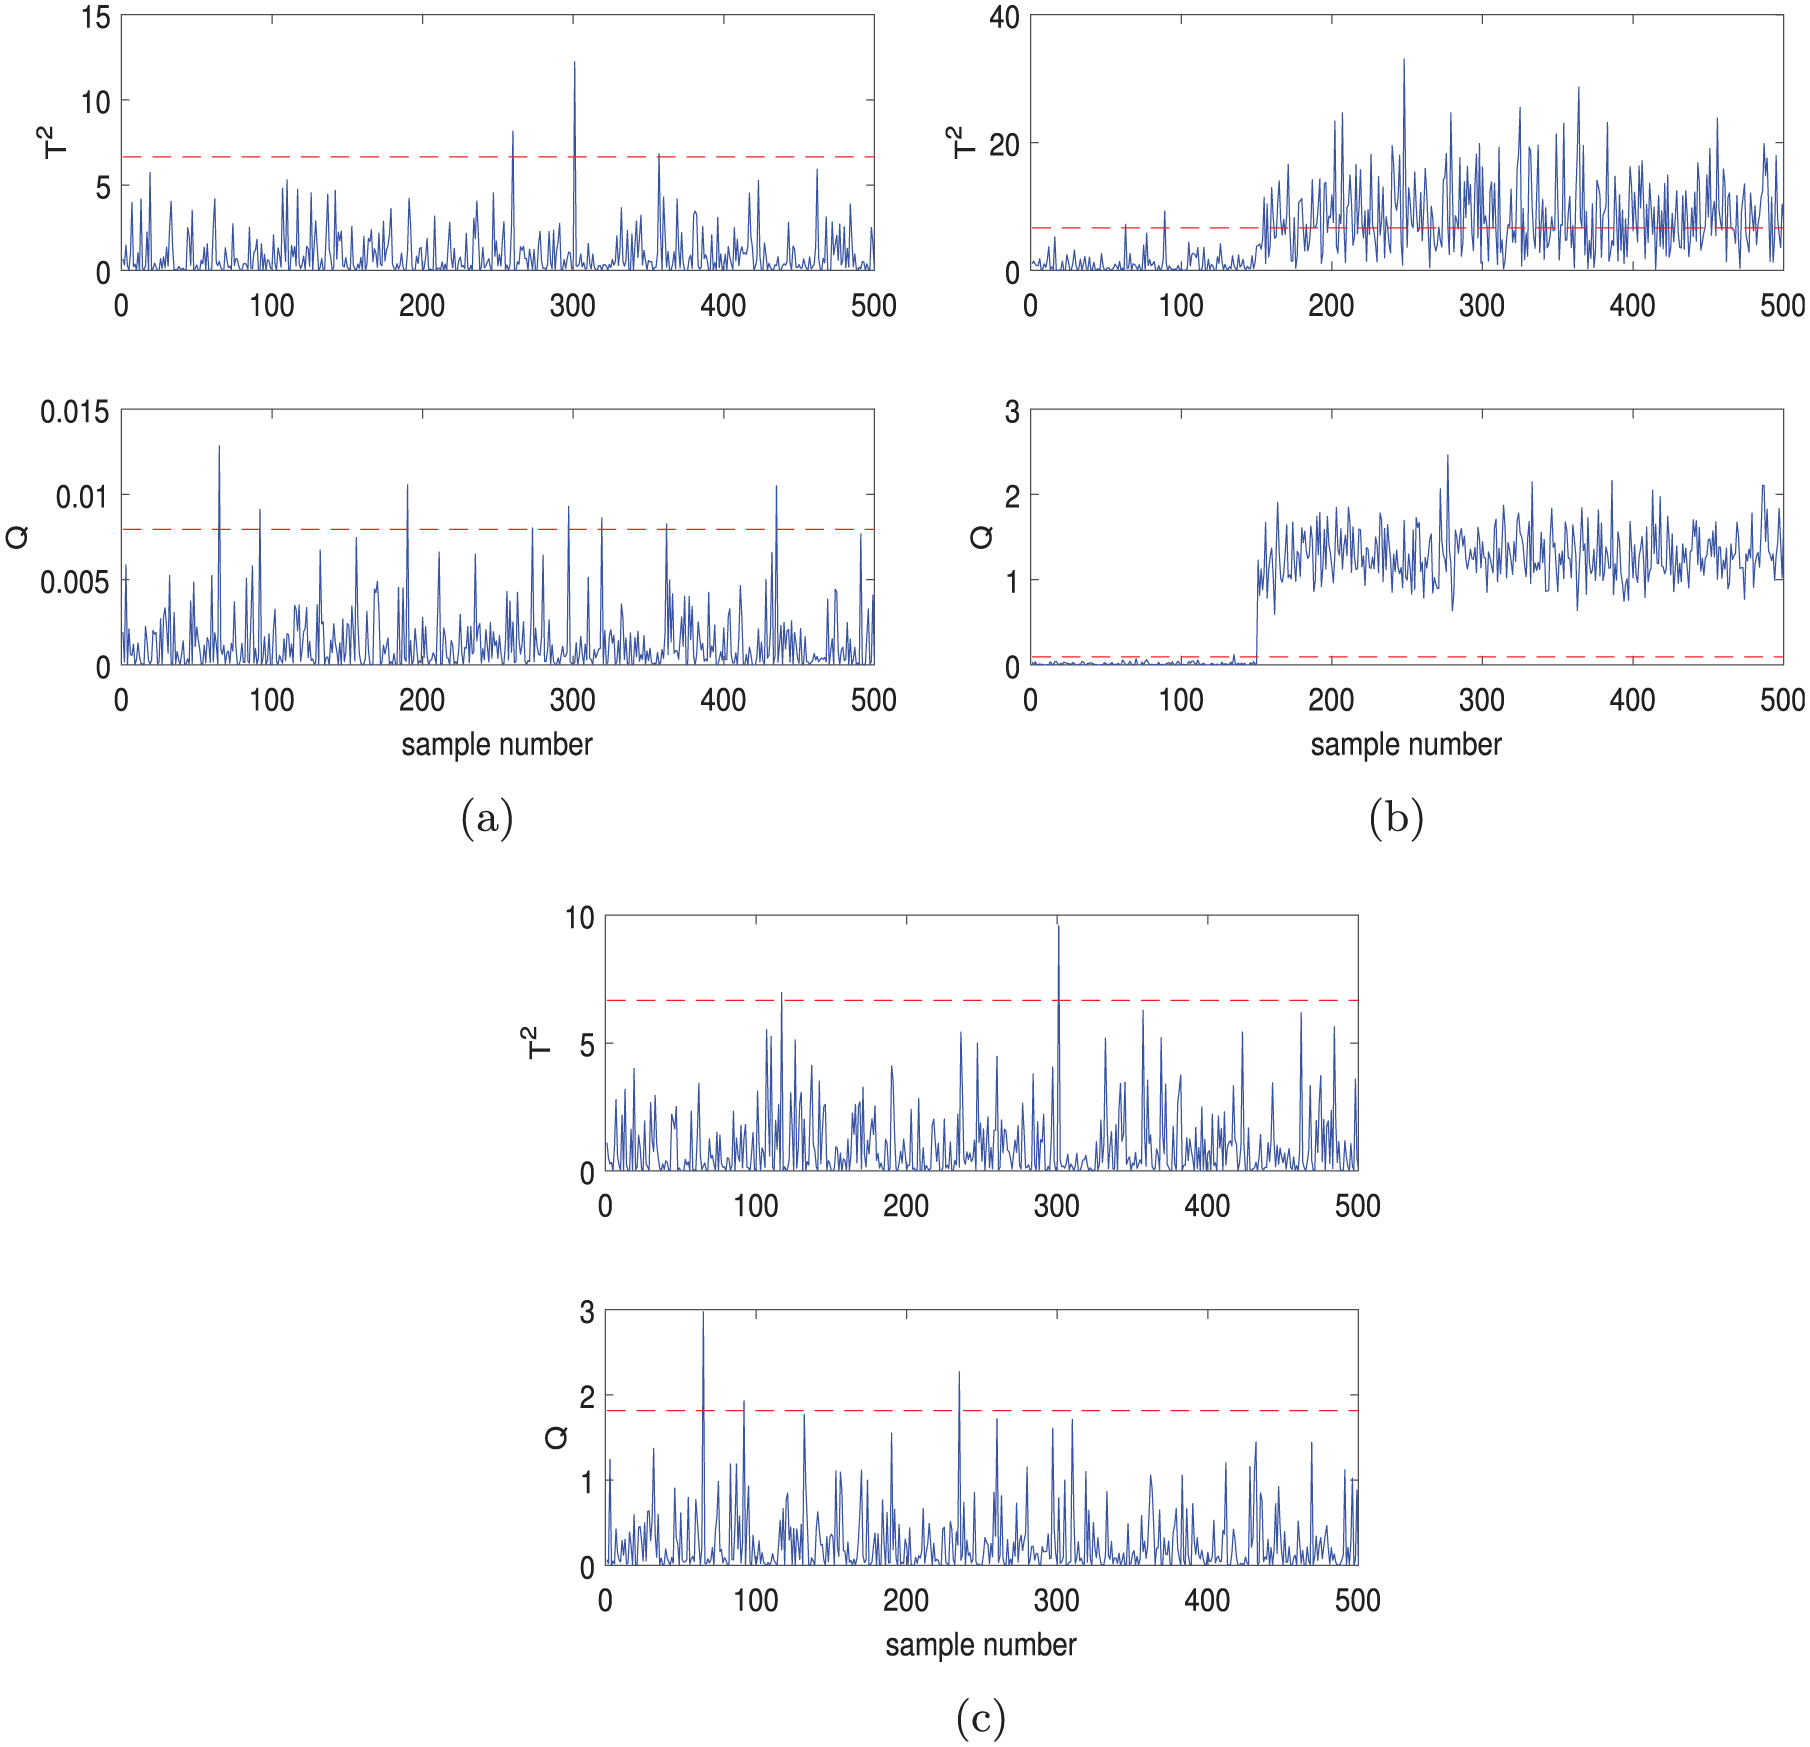
Monitoring results in sub-blocks: (a) sub-block 1, (b) sub-block 2, and (c) sub-block 3.

Contribution plots of ABPCA: (a)
The monitoring results for case 2 are shown in Figures 5–7. It is obvious that the performance of ABPCA is better than that of the PCA. Figure 6(a)–(c) shows the monitoring results in each sub-block and Figure 7(a)–(b) indicates the contribution plots of ABPCA. It is shown that the fault is detected in sub-block 2 which includes the variables
TE benchmark process
The TE benchmark process is utilized to validate the performance of the proposed method, which has been widely used for various monitoring approaches. 40 The process is composed of five major unit operations, including a reactor, a condenser, a compressor, a separator, and a stripper. Figure 8 shows the control structure. The process has been well interpreted by Downs and Vogel. 40 The test data consist of 960 samples and all faults are introduced to the process at sample 161. For TE benchmark process, in order to develop the offline models, the normal data set with 960 samples and 99% confidence level are applied in this article.

Control system of the Tennessee Eastman process.
A traditional PCA decomposition is required to construct the ABPCA monitoring model. The number of PCs is selected as 14 for the PCA model according to the CPV rule. Therefore, there are altogether 15 sub-blocks to be built, and six process variables are chosen in each sub-block by using angle selection.
Two process faults are selected to evaluate the performance. The first one is fault 5, which is a step change of condenser cooling water inlet temperature. Figure 9 shows the monitoring results of PCA and ABPCA. From Figure 9(a), we can see that the fault is detected at the beginning, but after 370 points, the process is considered to be normal. However, the slight deviation is in the condenser cooling water flow rate after 370 points. From Figure 9(b), it can be seen that the fault can be completely detected when using the proposed ABPCA method. Figure 10 shows the monitoring results of the

Monitoring results of TE fault 5: (a) PCA and (b) ABPCA.
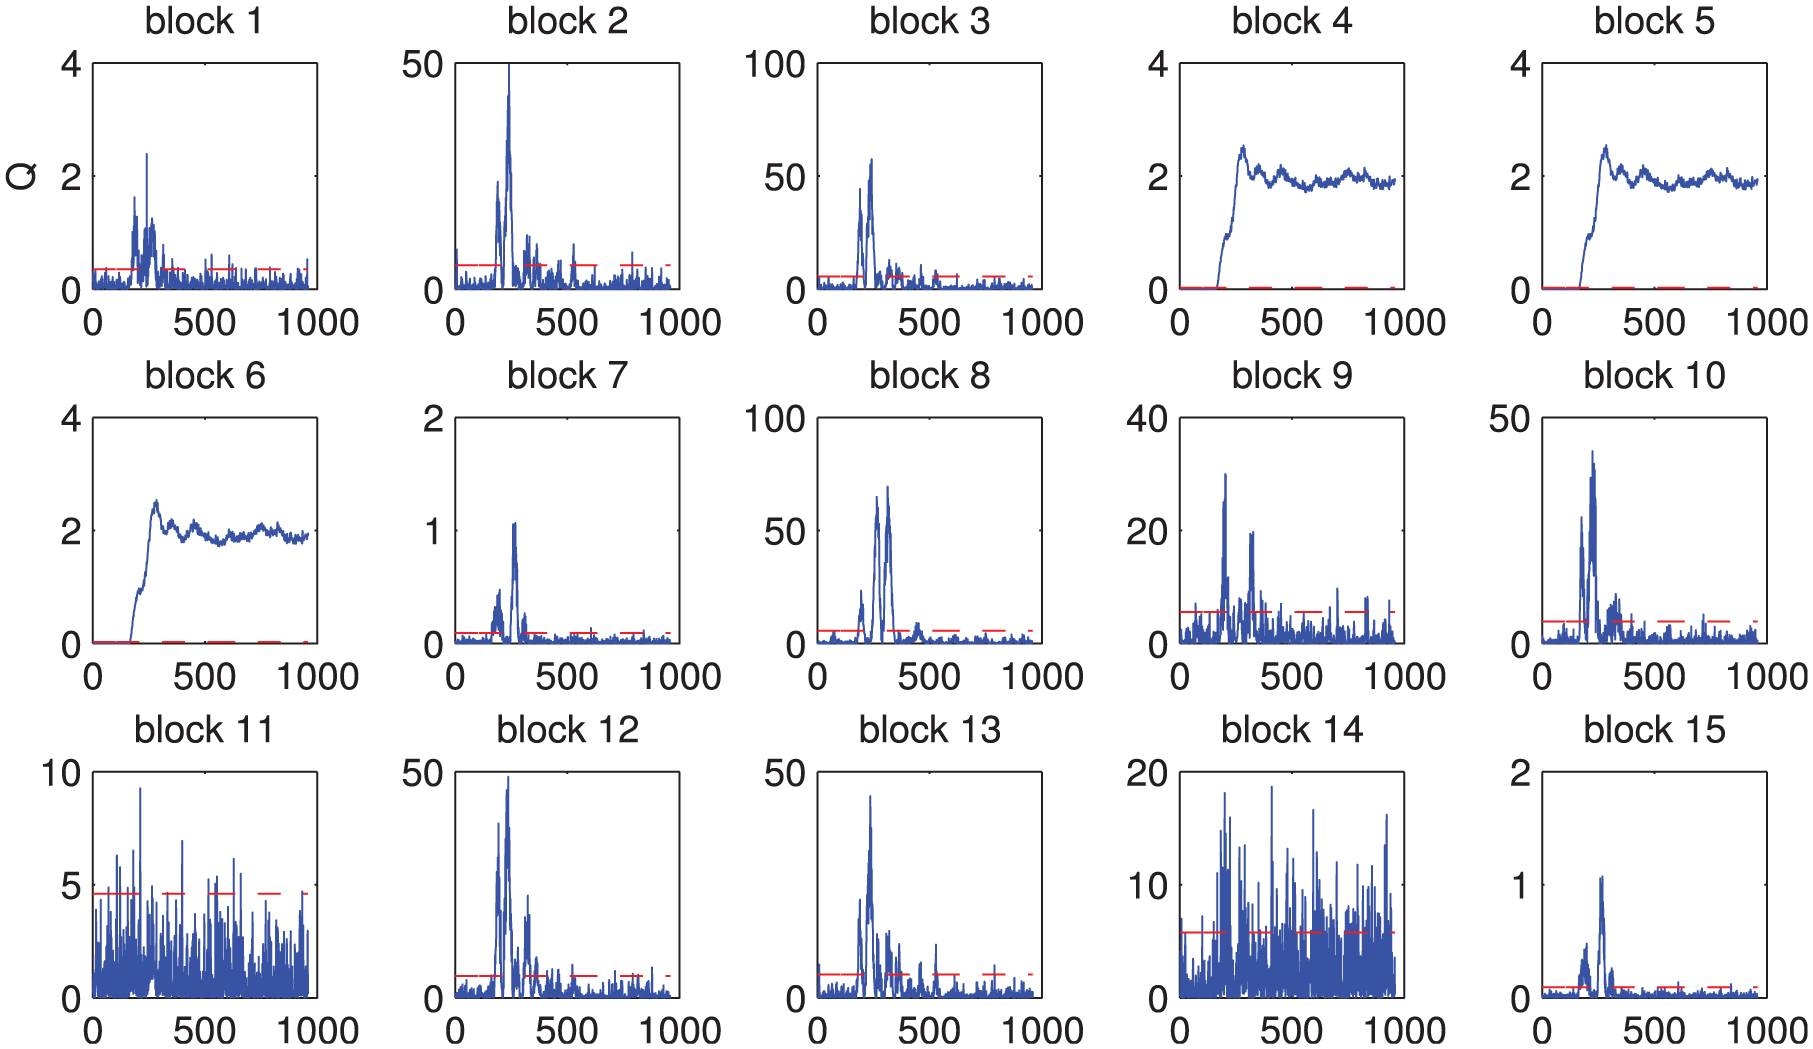
Monitoring results in each sub-block.

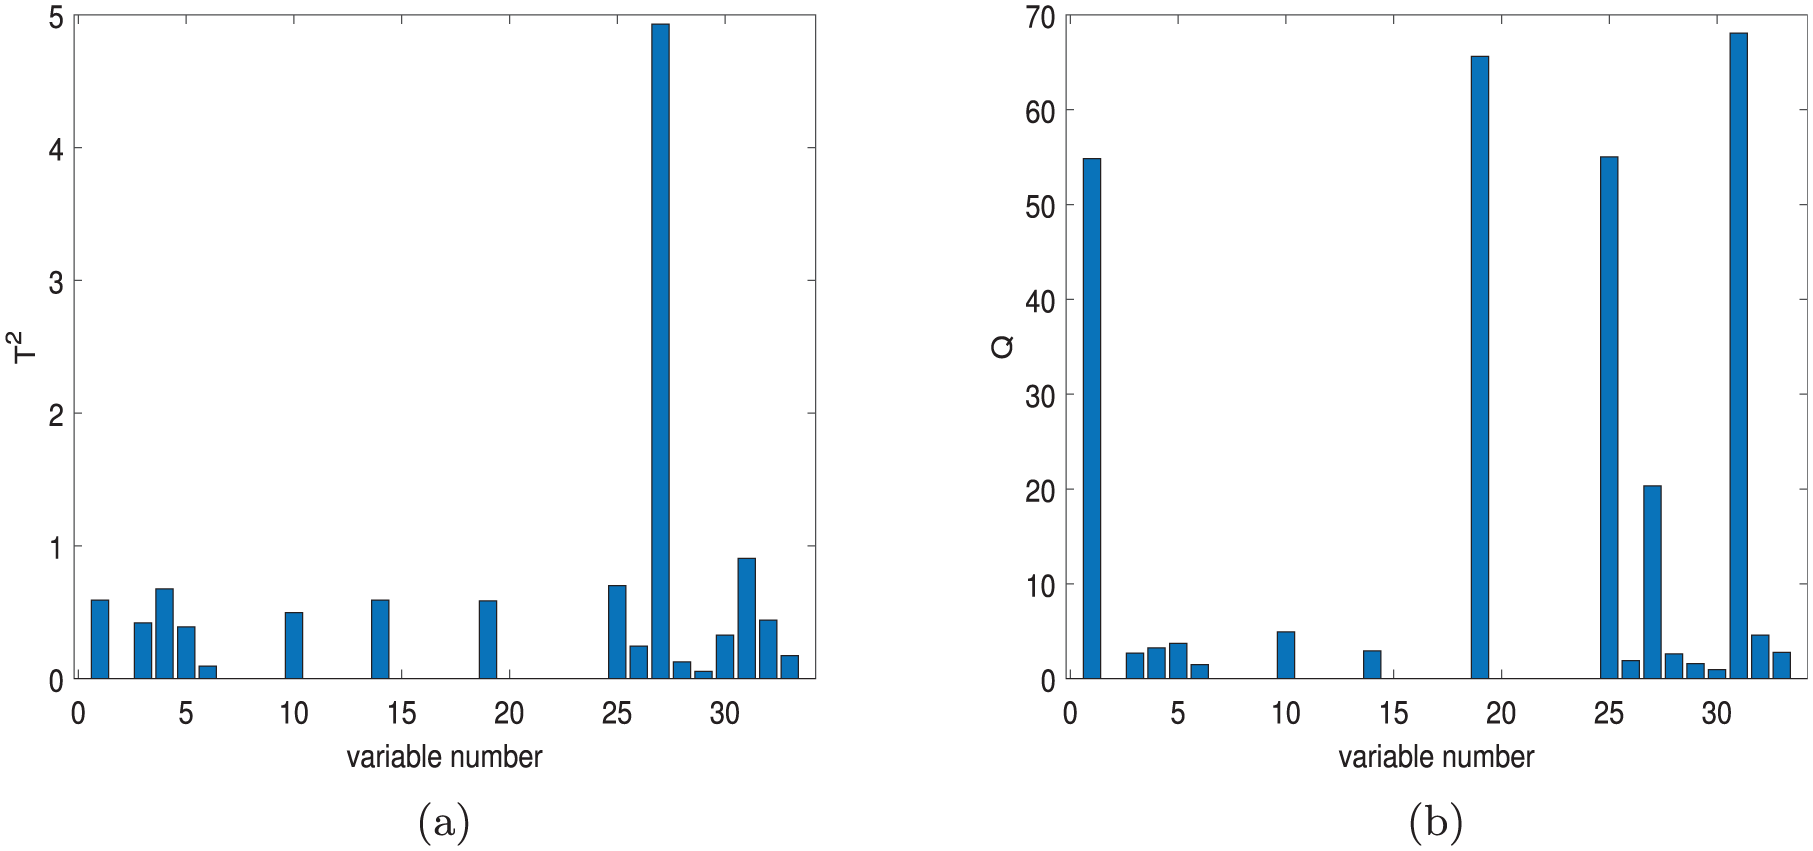
Contribution plots of ABPCA: (a)
Similarly, in accordance with PCA and ABPCA methods, the monitoring result of fault 10 is shown in Figure 12. Fault 10 is a random change of the temperature of stream 4 in TE process. Based on the results shown in Figure 12, there has been a great improvement of the monitoring performance through the

Monitoring results of TE fault 10: (a) PCA and (b) ABPCA.
Contribution plots of ABPCA: (a)
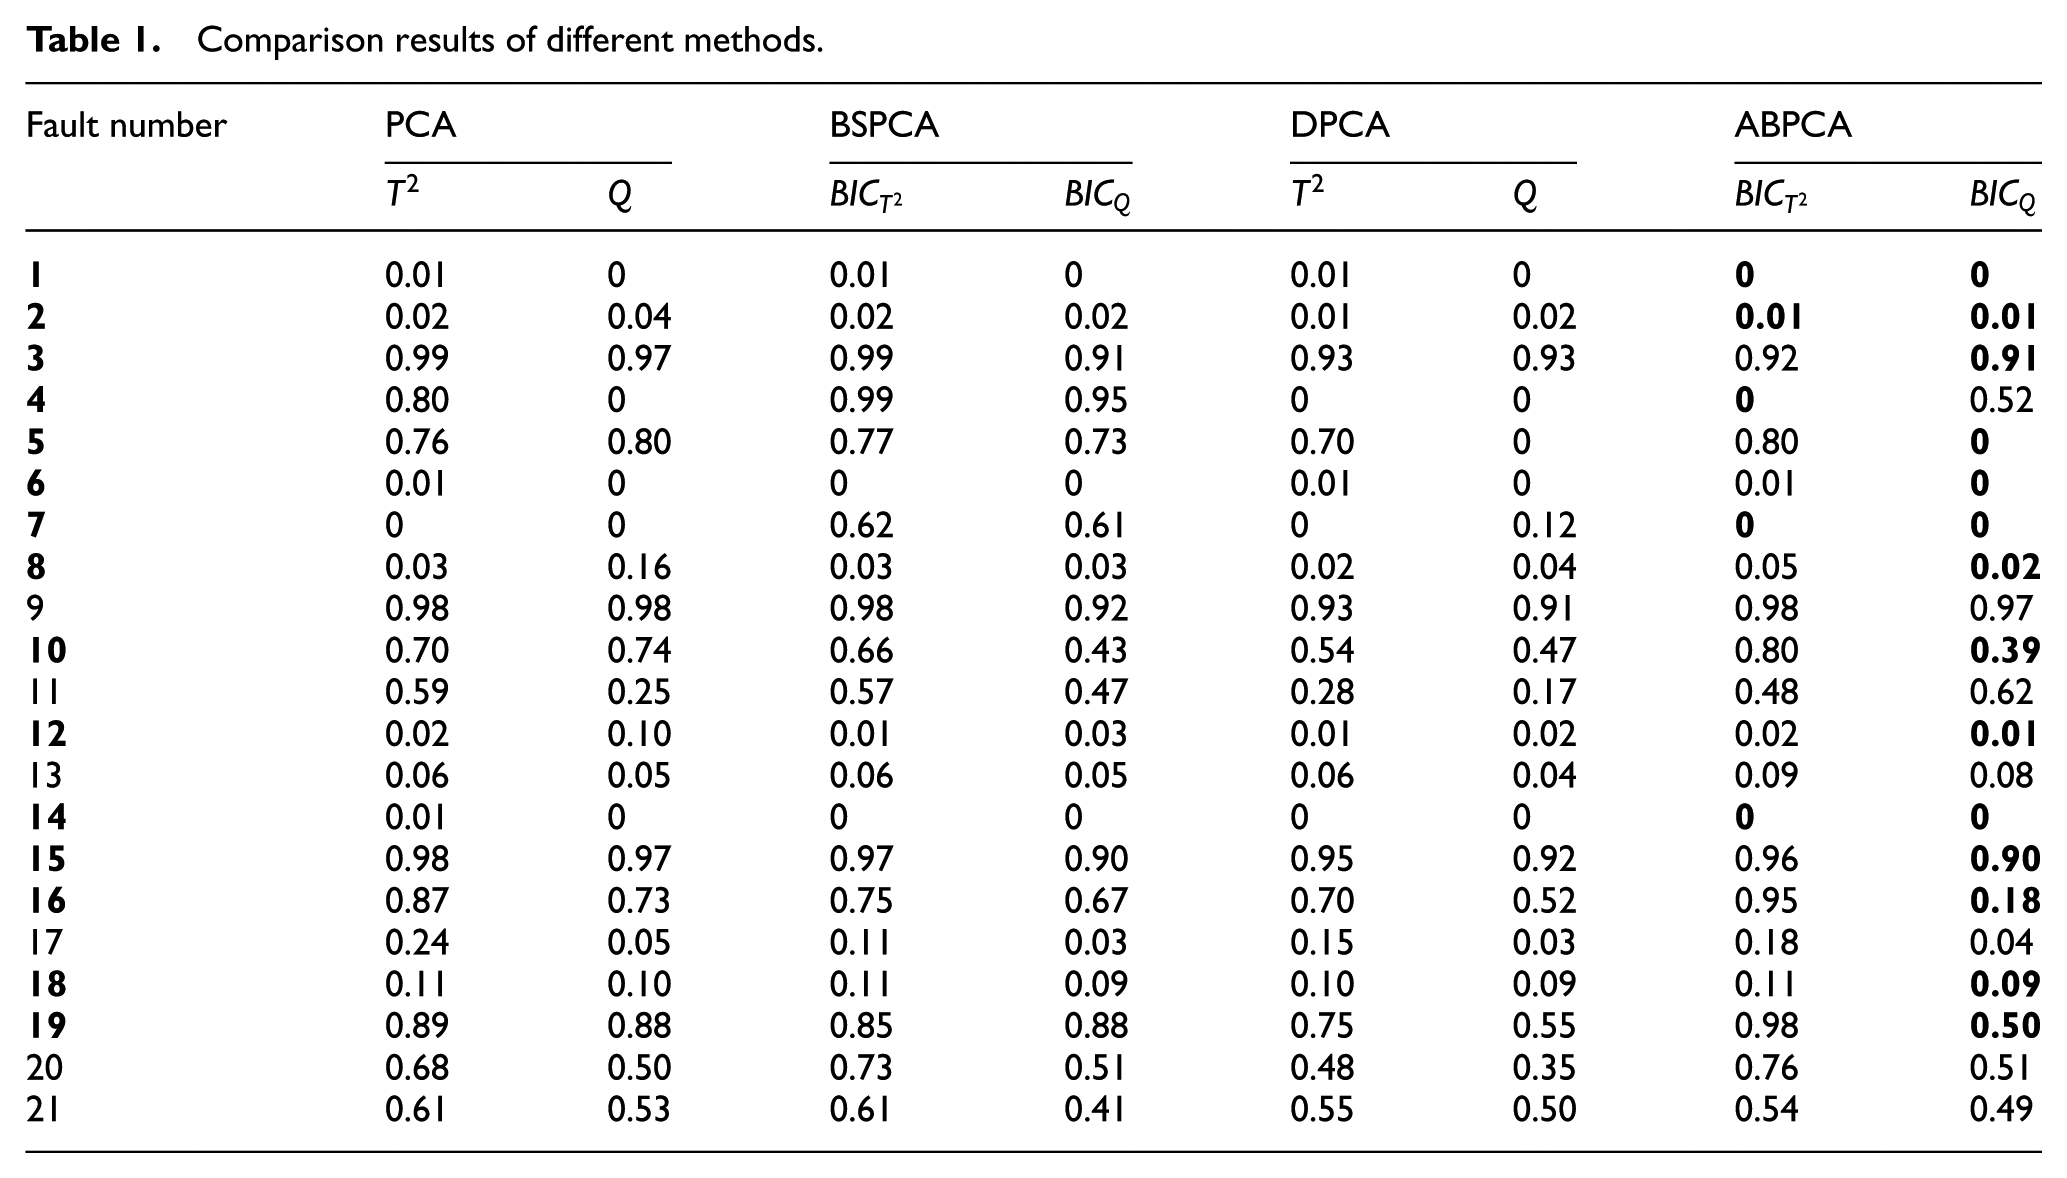
For all 21 faults, the monitoring performances of ABPCA and PCA are presented in Table 1. Furthermore, Bayesian PCA in Ge 16 and DPCA in Ge and Song 23 are used for comparison. It can be seen that the proposed ABPCA is the optimal one in most cases (bold font in Table 1). However, in the case of some faults, the proposed method in this article is inferior to the existing methods. The angle is used to measure the correlation between variables and sub-blocks in this article, but the number of variables in each sub-block is uncertain and can be determined by experience. Therefore, choosing the appropriate number of variables in each sub-block is an important step to ensure the monitoring performance.
Comparison results of different methods.
Conclusion
In this article, a DPCA method named as ABPCA method is proposed, where the variables are selected by angle in each sub-block. The monitoring results of all sub-blocks are combined by Bayesian inference to provide a straightforward indication. As the most widely used method in fault diagnosis, the contribution plot method is also adopted. Simulation results validate the efficiency of proposed algorithm.
This study aims to provide a different solution to PCA-based method for plant-wide process monitoring. However, with the coming era of big data, it will bring many challenges to the plant-wide process monitoring. Therefore, employing the big data processing method is an effective way to solve this problem. Similar to Zhu et al., 41 the proposed method can be extended to monitor large-scale industrial process with big data by using the framework of MapReduce. Due to the uncertainty of big data, obtaining effective information from process data becomes very difficult. Hence, how to extract the effective information from massive process data needs further study.
Footnotes
Handling Editor: Choon Ki Ahn
Declaration of conflicting interests
The author(s) declared no potential conflicts of interest with respect to the research, authorship, and/or publication of this article.
Funding
The author(s) disclosed receipt of the following financial support for the research, authorship, and/or publication of this article: This work was supported by the National Natural Science Foundation of China (No. 61773183 and No. 61833007) and the national first-class discipline program of Light Industry Technology and Engineering (LITE2018-25).