
Abstract
Large-scale process monitoring has become a challenging issue due to the integration of sub-systems or subprocesses, leading to numerous variables with complex relationship and potential missing information in modern industrial processes. To avoid this, a distributed expectation maximization-principal component analysis scheme is proposed in this paper, where the process variables are first divided into several sub-blocks using two-layer process decomposition method, based on knowledge and generalized Dice’s coefficient. Then, the missing information of variables is estimated by expectation maximization algorithm in the principal component analysis framework, then the expectation maximization-principal component analysis method is applied for fault detection to each sub-block. Finally, the process monitoring and fault detection results are fused by Bayesian inference technique. Case studies on the Tennessee Eastman process is applied to show the effectiveness and performance of our proposed approach.
Keywords
Introduction
Nowadays, associated with the high industrial requirements on system safety and process reliability, intensive attention has been dedicated to process monitoring in large-scale industrial processes,1–7 where the model-based and data-driven process monitoring methods are both available. There are several model-based approaches achieving process monitoring, for instance, numerous studies obtain the residuals in linear systems and nonlinear systems by observer techniques.8–13 However, the applicability of these methods is limited, as establishing an accurate first principle model for complex system model is often difficult and sometimes even impossible.
Among the data-driven approaches, the multivariate statistical process monitoring (MSPM) methods are developed rapidly, such as partial least squared (PLS) method, 14 multivariate statistical process control (SPC) methods, 15 concurrent projection to latent structures method, 16 and multi-block kernel partial least squares. 17 Among them, principal component analysis (PCA) method is regarded as an useful tool 4 for decreasing original data dimension by preserving the main correlation structure between the variables. Facing large-scale process where numerous variables with complex relationships exist, distributed methods3–5 are employed for large-scale monitoring process and the distributed PCA method is widely used to simplify the monitoring performance. To achieve the distributed monitoring performance, it is important to divide the process into some sub-blocks. The conventional way for process decomposition is that the prior process knowledge is considered during the decomposition procedure, and the final monitoring results are fused by Bayesian inference from each sub-block.3,18–20 However, it is not always easy to obtain accurate process information that can be used for further variable division, where data-driven methods could be an alternative way. 21 For instance, mutual information (MI) is applied in a distributed monitoring framework, and then a distributed monitoring method integrated with MI-spectral clustering and Bayesian inference is proposed.22–24 In addition, the generalized Dice’s coefficient (GDC) of a loading matrix was used to divide large-scale process variables and form a multi-block monitoring framework. 25 The loading matrix is a typical model that describes the conversion of the variables mapping from the original principal components space. Meanwhile, it can reveal the correlation between the original variables and extracted components, which is well-reflected in the nature of the process. Furthermore, loading matrix has a lower dimension for block division, while the process noises may lead to performance degradation or decomposition mistakes with GDC method. Hence, a two-layer decomposition method combining knowledge-based and GDC-based is proposed to improve the monitoring performance for large-scale processes. The large-scale process variables are divided into blocks according to the prior knowledge in the first layer. After that, each block is further divided into sub-blocks by GDC in the second layer.
Most of the data-driven methods need to rely on the complete data to achieve process monitoring and fault detection performance, while the incomplete or missing data issue is common in large-scale industrial process, which may cause sensor failure, heavy control network traffic, data overflow, and other potential errors. Therefore, it is necessary to find an appropriate method for data interpolation, such as the mean substitution method applied, 26 the regression interpolation method, 27 and expectation maximization (EM) algorithm. 28 However, the mean substitution method has large deviation, and the regression interpolation method only focuses on several specific cases. EM algorithm is an iterative method for achieving the maximum-likelihood estimation to deal with the multiple missing data patterns. 6 To address the issue of large-scale data interpolation, EM is applied into PCA algorithm,29–31 which can obtain the optimal value of blanks in incomplete data. EM algorithm for PCA gives simple and efficient computation cost, as the fewer eigenvectors and eigenvalues for monitoring process with large-scale data are in high dimensions. 19 However, this method is mostly used to solve centralized process monitoring problems; in this paper, it is applied in each sub-block with missing data, in order to obtain the complete data sets.
The motivation of this work is to propose a distributed EM-PCA (DEM-PCA) monitoring method for fault detection with missing data. The large-scale variables are first divided into several sub-blocks based on prior knowledge and GDC. Then, a PCA model is constructed in each sub-block to achieve fault detection and the EM-PCA method is utilized to deal with the incomplete measurement data; finally, a comprehensive monitoring result is acquired for the whole process fault detection by Bayesian inference. The proposed DEM-PCA scheme is applied into the Tennessee Eastman (TE) benchmark to show the monitoring performance.
Preliminaries
PCA for process monitoring
PCA is a fundamental method that decomposes high-dimensional process data into orthogonal low-dimensional subspaces and preserves the main information. Suppose a set of process monitoring data is denoted as

where matrix

where

Then, two traditional statistical variables called
Hotelling’s

where

where
Q statistic is an index that indicates the change of the sample vector projection in the residual space

where
The control limit
where

According to the
In addition, the contribution plot is used to find abnormal variables for fault diagnosis in PCA algorithm, 29 which calculates the variables contribution rate of partial sub-blocks. According to their contribution value, one or several variables can be selected to be responsible for the fault. The basic calculation of variables contribution is given as follows.
Assume that y is the observed sample set of a sub-block, and the jth measured variable of process is over the limit, then its total contribution can be calculated by

where k is the number of the principal components, and

where
Generally, the contribution value of a variable is larger, this variable is more likely considered to cause fault occurrence. However, the industrial cause of the failure is also required to consider the background knowledge of the process.
The EM-PCA algorithm
PCA is an effective method which can be used to monitor process with complete data. However, sometimes measurement data is unavailable due to sensor failure or heavy network traffic. In that case, the EM algorithm, 6 as an iterative algorithm, can be applied to estimate incomplete sample data with the loss of several measured variables.
The PCA linear latent variable model is written as

where
According to the noise, Gaussian distribution is like

Then, applying the assumed prior probability of x, which is calculated by

Thus, the marginal probability of y is given as

where

The log-likelihood function of measured variables y can be expressed as

where S is the covariance matrix of measured samples, which is defined as above expression (2).
Furthermore, the posterior probability of x can be obtained by following equation

where the matrix M is defined as
For estimation of C and x, the EM algorithm is applied with maximum-likelihood estimate (MLE) iteration in two steps: the E-step is to give a parameter probability function that consists of unknown variables, and M-step is to estimate the parameter by calculating the maximum expectation of log-likelihood function in E-step.
E-step
The posterior probability of x and y can be given by the Bayesian rule as follows

where matrix M is defined as
In addition, the expectation of x and y are denoted as


where
M-step
The joint distribution of x and y are shown as

Therefore, the log-likelihood of

and the expectation of this log-function with matrix X and Y is given

where
Derivation of the expectation function


For obtaining result, we assume that the noise variable e is toward zero and according to equations (20) and (21), a final expression of EM-PCA algorithm yields
E-step


M-step

Regarding the expectation matrix


EM-PCA algorithm provides complete data for subsequent process detection and diagnosis, as well as reduces the calculation dimension. The E and M steps of EM-PCA algorithm are applied to estimate blank parts of process monitoring data. Through multiple iteration, we can obtain the estimated sampling data set, and then the monitoring process detection and diagnosis can use this complete data set to obtain a more accurate result.
In addition, with the aim of minimizing the difference between measured variables, it is important to make data standardization at first. After using proximity method (using the previous value) to obtain the complete data set, the expression of standardization is given as follows
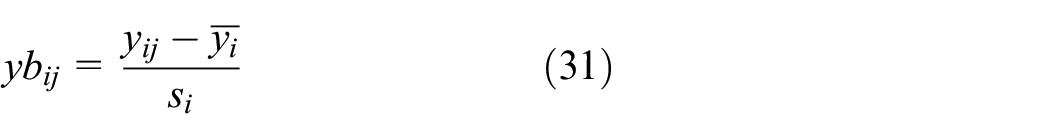
where i is the number from 1 to m, j is from 1 to n,
Distributed monitoring scheme with EM-PCA
In this section, the distributed monitoring based on EM-PCA method is proposed in detail. In distributed monitoring, the first step is to decompose the process into several units for dimensionality reduction. In addition, considering missing data problem in the measured variables, EM-PCA algorithm is applied.
Process decomposition
Obviously, the division of a whole process data set has several advantages, for instance, the distributed monitoring process can improve the sensitivity of fault detection performance, the fault tolerance is also increased by more than one monitoring block, and the distributed system can reduce the computational complexity of the monitoring process.
In this paper, the large-scale process decomposition method is proposed by using both knowledge and GDC of the loading matrix, including two layers. Through the previous knowledge of process, the whole monitoring system can be divided into the first-layer blocks, and then each distributed monitoring models is treated separately in the second layer by using GDC. Finally, a two-layer distributed monitoring model is constructed and the large monitoring variables can be divided twice into several sub-blocks.
Besides, when the process is decomposed by knowledge-based method in the first layer, there are several points that need attention; and are as follows:
An appropriate way to classify the sensors variables into different blocks is that, minimizing the possibility of simultaneous failures that belong to each block existence. So that, even if some blocks have something wrong, other normal blocks still work, the monitoring system can give a reliable result all the time.
Based on the prior knowledge of process, it is seen that different blocks are as diverse as possible, while the combination of all blocks covers the whole process. As a result, each monitoring block has little influence on others, and the performance can be much more accurate.
Each block monitoring result should communicate with each other in order to achieve the fault diagnosis of the whole system. Therefore, it is important to consider the communication between blocks, when the large-scale process is decomposed.
However, the variables in first-layer blocks only reflect the general behaviors of process, the local behaviors inside the sub-systems are not reflected which should also be important for monitoring process results. Therefore, after the large process variables are divided into first-layer blocks, each block should be further clustered through data-driven approaches. In this paper, a GDC-based method of the loading matrix is proposed to obtain the further division of the blocks. Suppose that a data set

where
The GDC can be obtained by following expression

where
Then, GDC is calculated by weight-loading vectors, and the original data set can be divided by GDC parameters. The GDC parameters between each weight-loading vector are obtained by expression (34), where x and y are substituted by two different weight-loading vectors indicated as

If the GDC parameters are close to 1, the variables should have high similarity. In order to make an objective decision, a threshold

When D = 1, the loading vector
The first step of decomposition is using knowledge-based method to make large-scale process divided into the first-layer blocks. Then, each first-layer block needs secondary division by GDC method of the loading matrix. After two times separation of measurement variables, each variable should belong to only one sub-block in the second layer. Unfortunately, there are several variables with random missing data, which could cause the decreases in monitoring performance. Thus, sub-blocks monitoring results are obtained by EM-PCA method, which depends on estimation of missing parts. However, the sub-blocks monitoring results are given at second layer, the final goal is to acquire the large-scale monitoring process fault detection result. Hence, Bayesian algorithm is proposed to make information fusion and gives a fusion fault detection result for large-scale process.
EM-PCA handling missing data and Bayesian inference fusion
The process monitoring performance can be affected due to the large-scale measured variables from different local sensors and units of industrial process. Therefore, we use the two-layer process decomposition method in section “Process decomposition,” which divides the process variables into several sub-blocks. After a distributed monitoring scheme proposed, EM-PCA method is applied for incomplete data estimation.
The data set

where B is the number of distributed sub-blocks; and each sub-block is denoted by
According to the algorithm in section “The EM-PCA algorithm,” the EM-PCA method is used to estimate missing data in sub-block set
Using proximity method to standardize the variables in
The matrix
An optimal matrix Cb is obtained by iterative calculation of p times of E and M steps, which are denoted by expression (28) and (29) in section “The EM-PCA algorithm.” Therefore, the iterative calculation for each sub-block can be written as follows


A new estimated matrix
The missing part of the incomplete data set
The iteration stops until the estimated parts are almost unchanged or the convergence condition is reached (If
In addition, the new matrixes
After process decomposition by two-layer method and value estimation by EM-PCA algorithm, the PCA monitoring model is established in each sub-block, and we can construct the PCA monitoring model of each sub-block in order to obtain the fault detection results, and calculate the statistics T2 and Q by formulas (4) and (6), which are expressed as follows


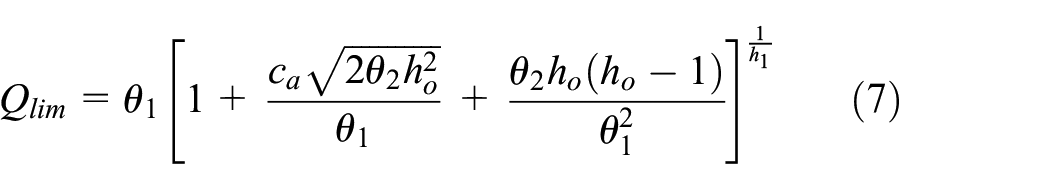
Meanwhile, the confidence limits of T2 and Q are given by equations (5) and (7) using variables without missing data. Thus, several sub-blocks monitoring results are given according to the comparison between statistics and confidence limits, then the fault detection result of large-scale process should be required by efficiency information fusion.
Here, the Bayesian inference strategy 32 is used to make each sub-block information fusion. It is a fusion strategy that calculate the fault probability of T2 and Q in each monitoring block by following expression 7
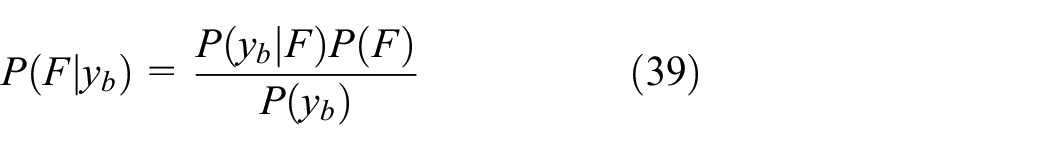

where “N” denotes normal condition and “F” denotes fault condition,

And it is the same way for Q statistic to obtain the conditional probabilities

According to the statistic BIC, the fault detection results of large-scale monitoring process can be obtained effectively. Thus, monitoring performance can be improved in distributed PCA monitoring process by Bayesian inference strategy.
In summary, based on the proposed DEM-PCA scheme, process variables are divided twice by knowledge-based and GDC-based manners first, which establish a two-layer framework for large-scale process monitoring. The data set needs to be divided into several monitoring sub-blocks data sets, then full information sample sets are obtained by incorporating the missing data information using EM-PCA method, as well as each sub-block gives its data-driven monitoring results separately by EM-PCA method. We can obtain a comprehensive monitoring result by Bayesian inference. In order to more clearly describe the DEM-PCA development process, Figure 1 shows the flow chart.

The flow chart of the DEM-PCA scheme.
Case study
In this section, the effectiveness of the proposed method is represented on the TE benchmark process. The following Figure 2 is TE process schematic diagram,17,21 which has five units that includes a reactor, a compressor, a stripper, a condenser, and a separator. There are 41 measured variables (including 22 continues process variables and 19 composition process variables), and 11 manipulated variables in the TE monitoring process, 9 in which, 960 sampling points are collected, where the first 160 sampling points are in the normal operation state.

TE process scheme.
TE process decomposition
Before constructing the PCA model of the whole large-scale TE process, the process should be divided into several blocks based on the previous knowledge in the first layer. Each block is used to describe a physical or chemical operation or the performance of a sub-system unit. In this study, we only use 33 variables to achieve the process monitoring, each variable is listed in Table 1 for details. According to the physical theory of TE process, there are five major units, but we can find that the two of the five major units have only two measured variables, so the variables of the two units can be combined into other related blocks, which makes the monitoring process less complex. As a result, 33 measured variables of the TE process could be composed into three blocks to be detected separately. Then, the variables in each block of the first layer have further second-layer division, which is based on GDC clustering method in section “Process decomposition.” For example, in block 1, there are variable 1–9, 21, 23–26 and 32, then we calculate GDC parameters, combining larger ones for a sub-block. Therefore, in the second layer, variables in each sub-block are minimum correlation with others by data-driven method. The specific division of the total measured variables of TE process are described in Table 2.
Process variables in the TE process.

TE: Tennessee Eastman.
Division of measured variables.

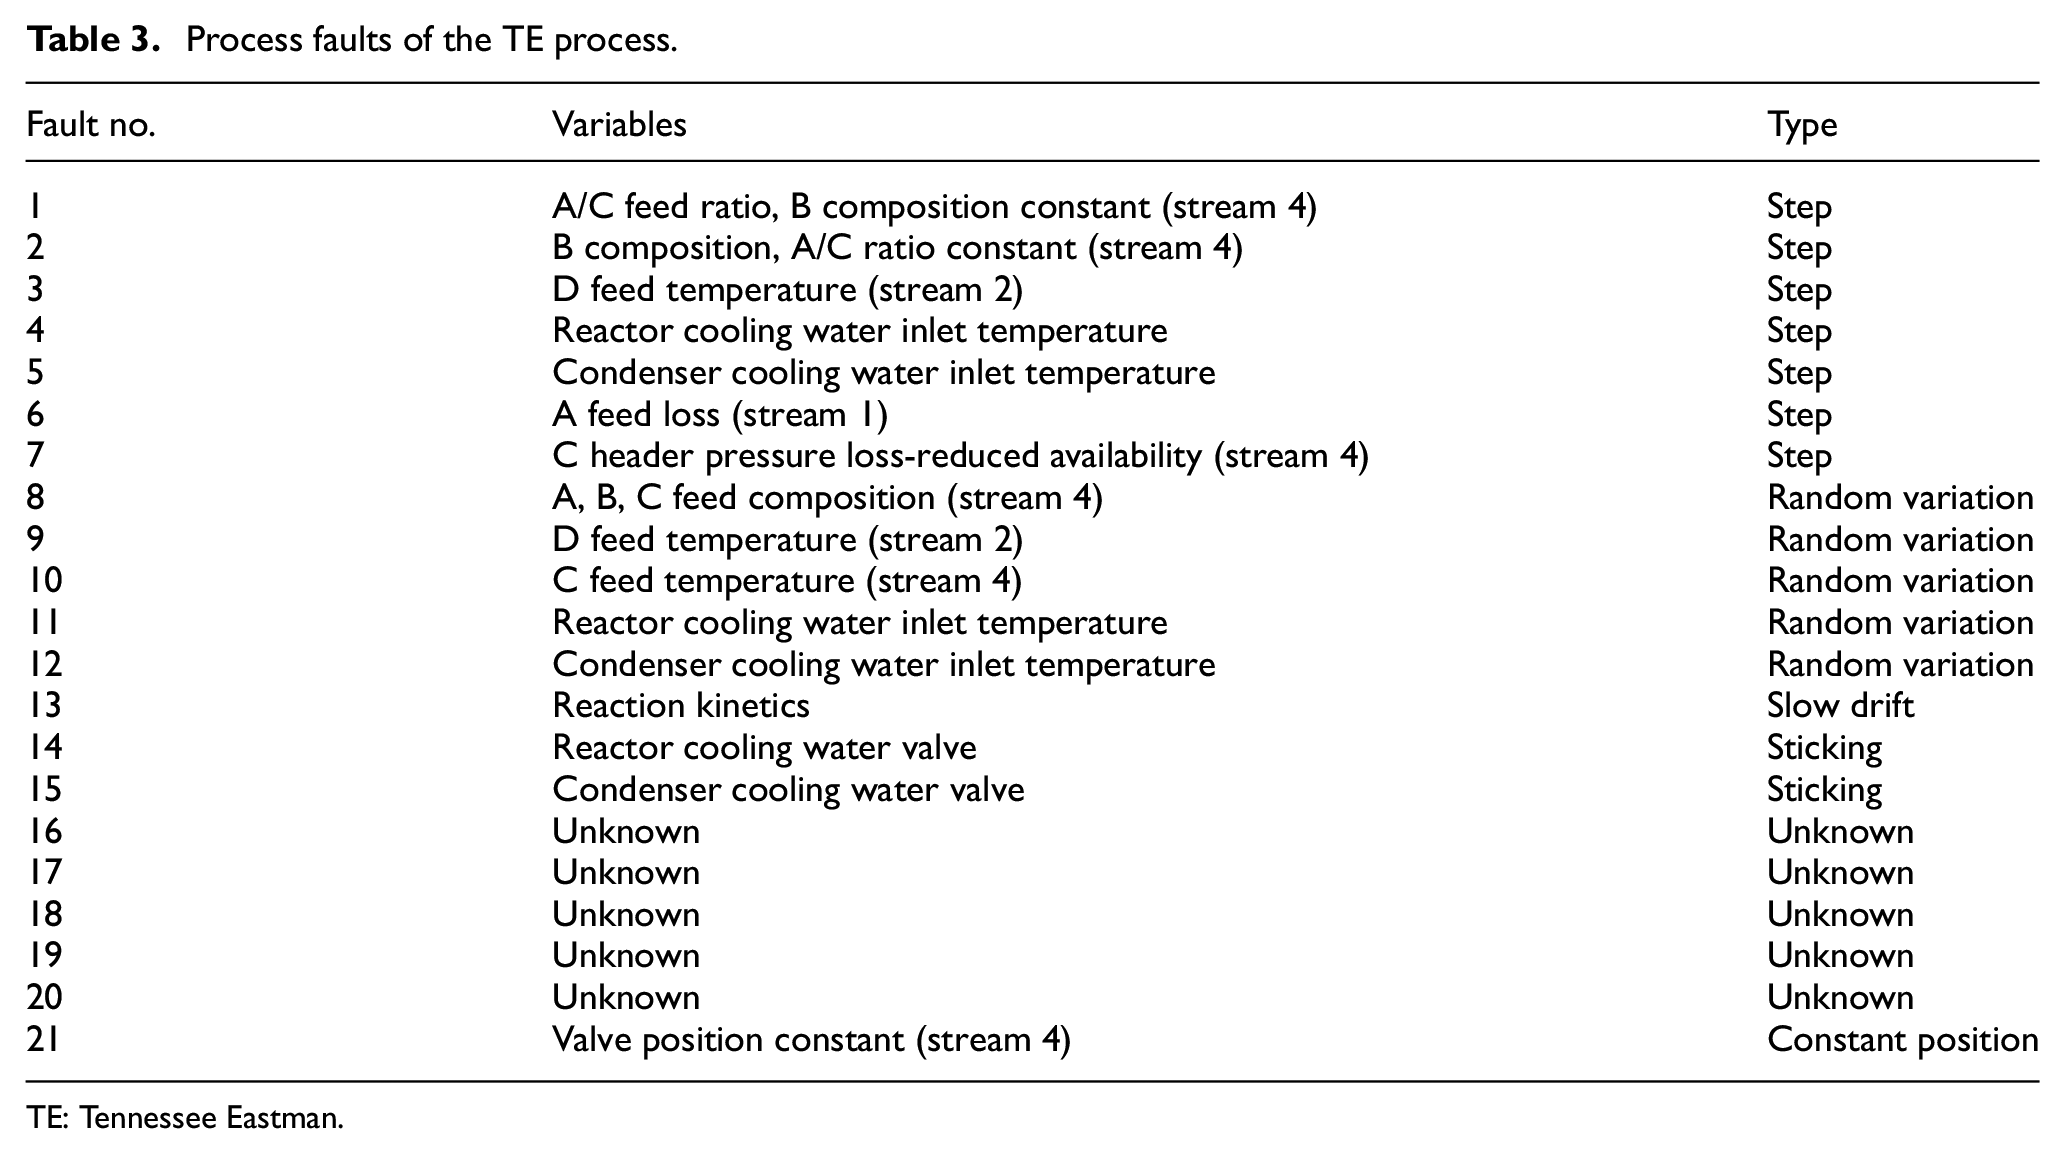
The normal testing data set consists of 500 samples and the process decomposition is according to the training data. Each fault testing data set consists of 960 samples, where the 21 different faults occurred at 161th sample and then remained for the rest of the samples, which included 800 samples. The 21 faults for TE process and their created types are shown in Table 3. The “Type” in Table 3 means the variation type of each fault signal. The first seven faults are caused by step signals, faults 8–12 occur due to random variation, and the fault 13 is due to the existence of slow drift. Faults 14 and 15 occur in the case due to valves that are sticking. There are also some faults that happened with unknown reason.
Process faults of the TE process.
TE: Tennessee Eastman.
Fault detection performance comparison
The measured variables are divided into seven sub-blocks for fault detection, and it is necessary to compare the performance indexes calculated from the T2 and Q statistics of the global monitoring variables and the distributed monitoring variables to show their fault detection results.
Generally, there are several errors that can cause problems with missing data in industrial large-scale process, including sensor errors, information transmission errors, and multi-rate samples errors. Suppose that two cases with missing data condition, shown as follows, and four methods (PCA, EM-PCA, the MI-based distributed PCA, and the distributed EM-PCA) are used to deal with process monitoring in each case.
Case 1: There are 5% samples (48 samples) lost in the all 960 samples data set, but there is not any sample row with all the data missed even in sub-blocks.
Case 2: There are 10% samples with missing data (96 samples), and each sample with missing data is not missing all the information. However, in some sub-blocks, there could be loss of all the sample row at sampling time.
Monitoring performance can be tested by the evaluation indices, like false alarm rate (FAR), fault detection rate (FDR). 32 The indices FAR and FDR are generally used to judge the effect of fault detection results.
The general calculation form of the FAR and FDR of


where
Similarly, the FAR and FDR of Q statistic can be calculated by follows


where Q denotes the statistical variable of PCA method,
In this way, all 21 faults have been considered with FAR and FDR. As the FAR and FDR of traditional PCA, EM-PCA, the MI-based distributed PCA and the distributed EM-PCA for all 21 faults are given in Tables 4 and 5, the performance of distributed monitoring for large-scale process is illustrated.
FAR of PCA, EM-PCA, MI-based distributed PCA and distributed EM-PCA (case 1/case 2).

FAR: false alarm rate; PCA: principal component analysis; DPCA: distributed PCA; EM-PCA: expectation maximization-principal component analysis; MI: mutual information; DEM-PCA: distributed expectation maximization-principal component analysis; BIC: Bayesian inference comprehensive.
FDR of PCA, EM-PCA, MI-based distributed PCA and distributed EM-PCA (case 1/case 2).

FDR: fault detection rate; PCA: principal component analysis; DPCA: distributed PCA; EM-PCA: expectation maximization principal component analysis; MI: mutual information; DEM-PCA: distributed expectation maximization principal component analysis; BIC: Bayesian inference comprehensive.
Most FARs of each fault in two cases are not more than 10% except several faults are hard to monitor, however, most faults that used MI-based PCA monitoring method have higher FAR index than distributed EM-PCA method. It shows that proposed distributed EM-PCA method can achieve fault detection effectively through Table 4. Moreover, the comparison of FDR indicates that the proposed DEM-PCA method performs more effectively than other three monitoring methods in most of faulty condition, especially in faults 4, 5, 10, 11, and 21. Although it is not evident that the proposed method has better FDR performance in some faults, this method has less computational consumption than global PCA and EM-PCA methods, as well as has monitoring results more accurately with an incomplete data set. In other words, the sample data complexity of distributed EM-PCA monitoring strategy is decreased and the computational efficiency of that is also improved.
Distributed EM-PCA for monitoring process with missing data
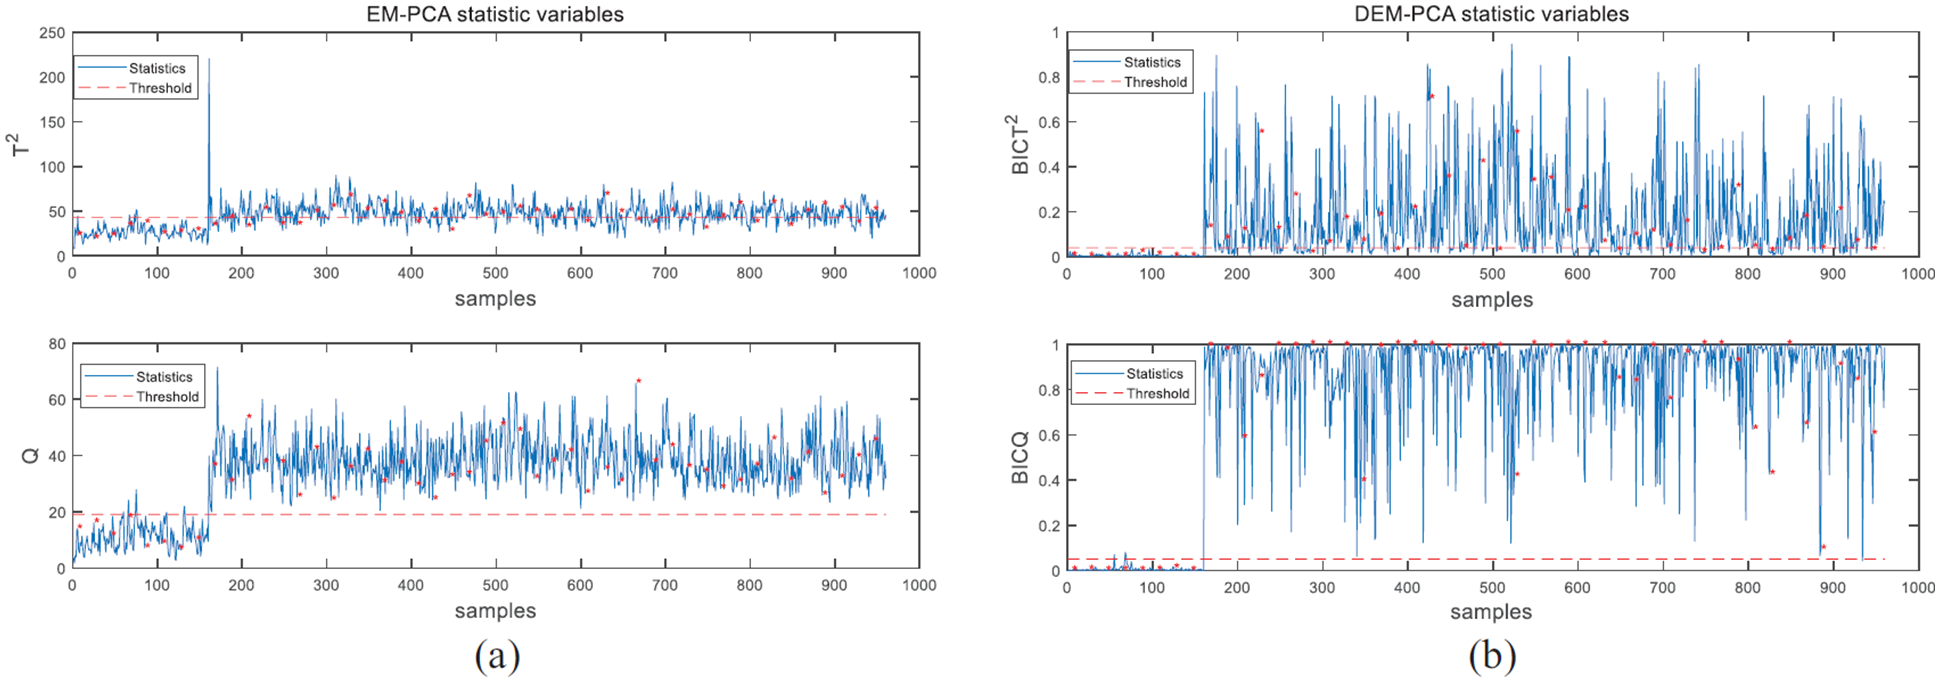
As can be seen in Table 5, faults 4, 5, 10, and 21 are selected to give their fault detection results in details. In addition, we divided two parts of them into different cases, fault 4 and fault 5 are detected in case 1, fault 10 and fault 21 are detected in case 2. In this way, both cases can be handled by different simulations. It is worth mentioning that the “*” with red color in all monitoring results shown in Figures 3–6 denotes the estimated value of missing data.
Monitoring results for fault 4 in case 1: (a) EM-PCA and (b) distributed EM-PCA.

Monitoring results for fault 5 in case 1: (a) EM-PCA and (b) distributed EM-PCA.

Monitoring results for fault 10 in case 2: (a) EM-PCA and (b) distributed EM-PCA.
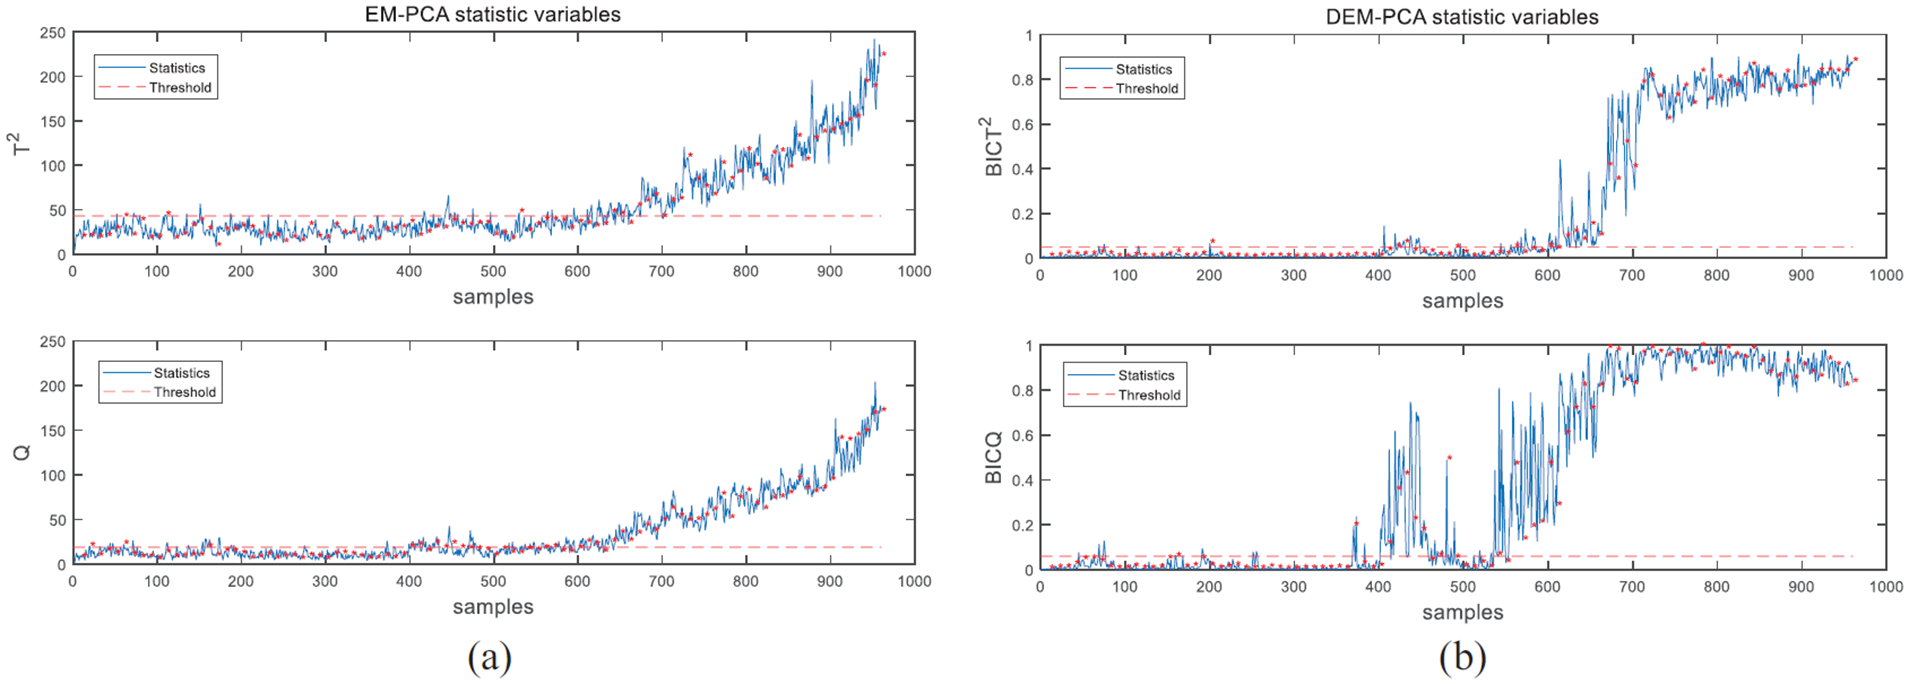
Monitoring results for fault 21 in case 2: (a) EM-PCA and (b) distributed EM-PCA.
Fault 4 is caused by a step change that occurs in the reactor cooling water inlet temperature; and the monitoring performances with EM-PCA and proposed distributed EM-PCA are shown in Figure 3. Obviously, the T2 statistic of EM-PCA has poorer performance than distributed EM-PCA, its FDR index is low. In other words, proposed distributed EM-PCA method can detect fault 4 effectively and quickly by T2 statistic. Meanwhile, the Q statistic of distributed EM-PCA has a result as good as EM-PCA monitoring results.
Fault 5 is a step change of condenser cooling water inlet temperature, Figure 4 indicates the monitoring results for fault 5 by using traditional EM-PCA and the proposed distributed EM-PCA method to achieve fault detection. When the fault 5 occurred, both methods can find fault at 161th sample, but only the proposed distributed EM-PCA method can detect this fault after 400th sample by Q statistic. Thus, the FDR of proposed method is much higher than traditional EM-PCA; and the T2 statistic of this method is almost the same as traditional EM-PCA. So the proposed ditributed EM-PCA method can deal with fault detection with missing data problem effectively, as well as making improvement in process monitoring performance.
Fault 10 is random variation of C feed temperature (stream 4), and Figure 5 shows the monitoring results in case 2 by traditional EM-PCA and proposed distributed EM-PCA methods. The BIC Q statistic, constructed by proposed distributed EM-PCA, can almost detect this fault successfully with 10% missing data. It is evident that the monitoring performance of proposed DEM-PCA is better than normal EM-PCA.
Fault 21 is a constant position fault of valve position constant (stream 4) in the TE process. The monitoring performances of two methods in case 2 are shown in Figure 6. The monitoring performances of T2 and Q statistic are abnormal at around 600th sample when traditional EM-PCA is used. Meanwhile, proposed DEM-PCA method can detect this fault at around 400th sample. In addition, the FDR index of proposed DEM-PCA is higher than traditional EM-PCA obviously. Therefore, the monitoring performance of proposed DEM-PCA is better than the other method.
In a word, it is obvious that the distributed EM-PCA method has higher fault detection rates than the traditional EM-PCA method illustrated by Figures 3–6. Hence, the method of distributed EM-PCA algorithm has been proven to give an effective value complement result, which is closer to the complete data fault detection. Furthermore, the distributed EM-PCA method is more sensitive to faults than the traditional EM-PCA method that can obtain the fault detection results rapidly.
To further illustrate the process condition, according to the results that variables contribution are compared with each other, we can find one or several variables having their contribution larger than others, which should make process condition abnormal possibly. For case 2, the variables contribution of fault 5 are presented in Figure 7 and fault 11 are presented in Figure 8.

Monitoring results and contribution plots for fault 5: (a) a global PCA, (b) DEM-PCA sub-block 2, and (c) DEM-PCA sub-block 3.

Monitoring results and contribution plots for fault 11: (a) a global PCA, (b) DEM-PCA sub-block 2, and (c) DEM-PCA sub-block 3.
Figure 7(a) shows 33 variables T2 and Q statistic contribution of the global PCA, there are many variables having high contribution in histogram, so it is difficult to select several variables which should be responsible for fault 5. However, distributed EM-PCA has seven sub-blocks with monitoring results and contribution plots separately. Figure 7(b) shows the result of sub-block 2 and Figure 7(c) shows the result of sub-block 3, through which we can find that four variables 2, 7, 8, and 32 have dominant contributions both in the global monitor and sub-block monitors. Therefore, depending on the fault diagnosis method in this paper, the variables 2, 7, 8, and 32 are responsible for the fault 5 that was identified successfully in the sub-block models.
Similarly, T2 and Q statistic contribution of the global PCA for fault 11 in Figure 8(a) cannot acquire a simple fault diagnosis result; and it is evident that the variables 6, 9, and 32 should be responsible for the fault 11, which is indicated by the sub-block 2 contribution plots in Figure 8(b) as well as the sub-block 3 contribution plots in Figure 8(c).
Conclusion
In this paper, a distributed EM-PCA scheme is proposed for plant-wide industrial processes with missing data. where the large-scale process decomposition combined the knowledge-based method with GDC-based method. Then EM-PCA algorithm was applied in all sub-blocks for estimating missing values, as well as the fault detection results of each sub-block were obtained by this method. Bayesian inference was utilized to fuse the monitoring results in each sub-block and gave a final decision. Furthermore, fault diagnosis results were acquired by calculating variables contributions of several sub-blocks. It is worth noting that our proposed approach can improve the performance of fault detection and reduce the size of monitoring data set, and several case studies on TE benchmark have validated its effectiveness and performance.
Footnotes
Appendix 1
Acknowledgements
The authors would like to thank the National Natural Science Foundation of China, the Fundamental Research Funds for the Central Universities, and the National Key R&D Program of China.
Handling Editor: Choon Ki Ahn
Declaration of conflicting interests
The author(s) declared no potential conflicts of interest with respect to the research, authorship, and/or publication of this article.
Funding
The author(s) disclosed receipt of the following financial support for the research, authorship, and/or publication of this article: This study was supported by the National Natural Science Foundation of China under grant #61673053 and #61903026, the Fundamental Research Funds for the Central Universities under Grant #FRF-BD-19-002A, and the National Key R&D Program of China under grant #2017YFB0306403 for funding.