
Abstract
Understanding the acoustic emission effects on bolts under cyclic loading is of great significance for the support of roadways. The presented research focuses on the acoustic emission characteristics of bolts under cyclic loading. The following main conclusions were drawn: (1) With a higher loading frequency, the acoustic emission counts rate increases, while the total energy released in a given cyclic loading path decreases. (2) A fitting formula is established according to the relationship between the tension amplitude and cumulative acoustic emission counts, which can analyze the tension magnitude level of the cyclic load. (3) A damage factor for a cyclic load is proposed based on the acoustic emission counts generated during the cyclic and monotonic loading process that can analyze the degree of damage to the anchorage system caused by the cyclic load. (4) Based on the spatial distribution of the acoustic emission orientation points and the acoustic emission energy generated during the pull-out process, the acoustic emission damage evolution process of the anchorage specimens is deduced, and the mechanism of the high stability of the pretension anchorage system after cyclic loading is analyzed. The above conclusions may provide some experimental references for the application of acoustic emission technology in bolts supporting roadways.
Introduction
The pretensioned bolt has become the main support technology in underground coal mining. As an important support means, the working condition and stability of the bolt during the production process play significant roles in achieving the safe, efficient, and sustainable development of coal resources.1,2 However, the effect of the pretensioned bolt support for roadways in underground coal mines is often affected by dynamic loads such as those of excavation, mining engineering, and mechanical vibrations during production.3–6 The anchorage section of the bolt is continuously subjected to loading and unloading similar to cyclic loads. The mechanical response of the bolt anchorage system under cyclic loading is related to the safety of the supporting structure for roadways. Therefore, it is necessary to study the failure law of pretensioned bolts under cyclic loading.
Scientists have observed the damage effect of cyclic loading on anchorage systems and carried out many experiments. The research results are briefly summarized in the following sections. Benmokrane et al. 7 carried out cyclic loading and monotonic loading pull-out tests on cement anchored bolts. The test results indicated that the cyclic load did not affect the service life of the anchorage when the upper limit of the cyclic load was less than the pretension value or less than 30% of the monotonic load ultimate pull-out strength. Zheng et al. 8 constructed a physical model of a slope with concrete supported by pretensioned bolts and then applied cyclic loads on top of the slope to study the dynamic response of the bolts. The results showed that the pretensioned anchor was more effective than the passive cable. The failure locations of the pretensioned anchor were the anchor head position and the free section of the bolts, and no debonding was found at the interface. Tistel et al. 9 presented a model to predict the capacity of a rock anchoring segment with a ribbed bar subjected to a cyclic load. Verderame et al.10,11 conducted a series of monotonic and cyclic pull-out tests aimed at the assessment of the bond performances of plain round bars, discussed the mechanical mechanism of their pull-out process, and established a numerical calculation model based on the experimental results. Li et al. 12 carried out pull-out tests of bolts in concrete under cyclic loading and proposed τ–s relationship formulas in which two parameters, du and Du, were introduced; du is a factor that reflects the damage of the peak bond stress under a controlled constant displacement, and Du is a factor that reflects the damage of the remnant ultimate bond stress under a controlled changing displacement. Research on the damage behavior of bolts under cyclic loading has basically focused on the final pull-out strength, mechanical behavior of the interface debonding, anchoring life, and strengthening effect of pretension, among others, but there has been no comprehensive consideration of the loading frequency, tension amplitude, or pretension. Due to the limitations of the testing means, the stress and displacement values are always monitored during the pull-out process, ignoring the mesoscopic characterization of the intermediate loading process, which limits the understanding of this process. There are some limitations in researching the micromechanism of bolt failure under cyclic loading. To better understand the failure mechanism of an anchorage under cyclic loading, it is necessary to introduce new research methods and parameters to accurately control and describe the process.
To study the damage and failure mechanism of a bolt during the pull-out process, this study uses acoustic emission (AE) technology to monitor the whole process of the bolt pull-out. AE technology is a passive detection technology with real-time characteristics that can accurately reflect the changes in a material’s interior.13,14 Compared with other nondestructive testing technologies, AE technology has an obvious advantage that several AE probes can be used to monitor a whole structure in real time. 15 As a nondestructive testing and safety monitoring method, AE technology has been applied in many fields, such as aerospace, 16 material engineering,17,18 mechanical equipment,19,20 structural engineering,21,22 and civil engineering.23,24 Since the 1930s, scholars have used AE technology to study damage detection and safety monitoring in geotechnical engineering. The AE phenomenon was first discovered by Obert of the US Bureau of Mines, who applied AE technology to mining engineering. 25 In 1953, Kaiser 26 first discovered the phenomenon of AE in commonly used engineering materials and proposed the famous “Kaiser effect.” In 1963, Goodman et al. 27 proved that rocks have a Kaiser effect through experiments, which laid a foundation for the application of AE technology in rock mechanics. Subsequently, AE technology has been widely used in uniaxial and cyclic loading tests of rocks, and the AE parameters are used to characterize the damage degree of rocks.28,29 Chang and Lee 30 used the AE parameters to express the damage degree of rock fracture and predicted the macroscale fracturing direction of rock. Meng et al. 31 discussed the AE characteristics of rock materials in the process of deformation and failure; established a relationship between the stress, strain, and AE activity; and analyzed the evolution law of the rock stress and strain during loading and unloading by AE technology. These results show that the AE characteristics are closely related to the stress-strain characteristics of materials. Ren et al. 32 studied the fatigue damage characteristics of rock masses by changing the upper limit stress, lower limit stress, and loading rate of the cyclic loading of the rock mass using AE technology. The results show that the cumulative AE curve agrees well with the strain curve and can reflect the fatigue damage process of a rock mass. AE technology has been widely used in engineering practice, such as for monitoring the damage degree of the surrounding rock during tunneling, 33 monitoring the rock slope damage caused by rainfall, 34 the treatment of radioactive waste, 35 detecting the disturbance zone in tunnel excavation, 36 and evaluating the stability of mining pillars. 37 In summary, the accuracy of AE for detecting rock and engineering damage is accepted, but few articles exist on the engineering damage detection of anchorage supports. There are some deficiencies in the research on the internal mesoscale damage of anchorage systems under cyclic loading.
In this study, cyclic loads with three types of loading frequencies were used to pull out anchor specimens with four pretensions. After the cyclic loading process, the load was reduced to 0 kN, and then a monotonic load was applied at the displacement speed of 3 mm/min until the failure of the anchor specimens. The entire loading process was monitored by AE technology. The failure evolution process and mechanism of the pretensioned anchorage under cyclic loading are studied. The variation law of the AE parameters of various pretensioned anchorage specimens measured during cyclic loading and monotonic loading failure is analyzed. The research results provide some references for the prediction of the safety and stability of roadways disturbed by excavation, mining, blasting, or artificial machinery in underground coal mines.
Experimental materials, equipment, and methods
Pretensioned anchorage material
The materials used for making the pretensioned anchorage specimens in this study mainly include anchor rods, anchorage agents, concrete, steel tubes, pallets, nuts, and steel cylinders. The bolt with a diameter of 20 mm is made of MnSi steel. The length of the bolt is 210 mm, a thread of 80 mm is added at one end, its yield load is 119 kN, and its tensile strength is 570 MPa. The resin anchorage agent is a common slow-speed mine resin with a uniaxial compressive strength of 45.1 MPa and a tensile strength of 3.12 MPa. Concrete is the anchorage matrix, simulating the surrounding rock, with a uniaxial compressive strength of 35.3 MPa. Referring to the strength test method of cement mortar in the national standard (GB 17671-1999), C525 cement and ISO standard sand are used for cementing. The ratio of water, cement, and sand is 0.5:1:3. The steel tube is made of #45 steel with an inner diameter of 36 mm, outer diameter of 50 mm, thickness of 7 mm, and length of 210 mm. Hexagonal nuts of type M20 are used and matched with bolts. The pallet is square, 50 mm long and wide, and 22 mm thick, and the central hole is 22 mm in diameter. The inner diameter, outer diameter, and thickness of the nylon washer under the nut are 21 mm, 42 mm, and 2.8 mm, respectively. The steel cylinder is made of carbon steel, and it has a diameter of 35 mm and a height of 50 mm. The material description of the anchorage specimen is shown in Figure 1.

Schematic of the anchorage specimen material.
Specimen production process
In this experiment, a concrete-filled steel tube is used to simulate the surrounding rock; that is, a layer of concrete is cast inside the steel tube to simulate the surrounding rock. The bolt is anchored in the concrete pipe by the resin anchoring agent, and the pretension force is applied by a screwing nut. The specimen preparation is divided into the following steps: (1) Weld the steel cylinder at one end of the steel tube. (2) Pour the concrete into the steel pipe and insert the PVC plastic pipe with an outer diameter of 24 mm into the bottom of the steel pipe with a central ring. (3) Wait for 1.5 h, turn the steel tube upside down, and pull out the PVC plastic pipe. Cure the anchorage matrix for 28 days. (4) Pour the anchorage mixture evenly into the bolt hole and then insert the bolt into the borehole with the middle ring. (5) After waiting 1 day, hold one end of the steel tube with a chuck and apply the pretension force by screwing the nut with a torque wrench. The applied torques of the torque wrench are 100, 150, and 200 Nm, and the corresponding pretensions are 10.6, 15.2, and 25.6 kN. Figures 2 and 3 show the schematic and flow chart of the anchorage specimen preparation.

Schematic of the sample preparation of the anchorage specimen.

Flow chart for the sample preparation of an anchorage specimen.
Experimental scheme
The testing machine used in this study is an MTS Landmark 370.50 rock dynamic load fatigue-testing machine (MTS Landmark Servo Hydraulic System). During the cyclic loading test, axial load control is adopted, and the loading waveform is triangular; the cyclic tension path is shown in Figure 4.

Diagram of the tension path under cyclic loading.
The displacement control mode is adopted in the monotonic loading pull-out test, and the loading rate is 3 mm/min. In the whole loading process, an AE acquisition system manufactured by the American Physical Acoustics Corporation (MISTRAS Group, Princeton, NJ, USA) was used for data collection. Six AE sensors are used, and their spatial distribution is shown in Figure 5. The sensors are fixed to the steel tube with glue. The AE sensor model is Nano30, whose acquisition frequency is 125–750 kHz, frequency bandwidth is 100–400 kHz, resonance frequency is 150 kHz, and sensitivity is 67 dB. A schematic and an actual loading image of the anchorage specimen are shown in Figures 6 and 7, respectively.

Diagram of the spatial distribution of acoustic emission sensors.

Schematic of anchorage specimen loading.

Image of anchorage specimen loading.
As shown in Figure 4, the tension loading during the test process is divided into two parts: cyclic loading and monotonic loading. First, the anchor specimen is pulled out by using a five-stage cyclic loading path. After the disturbance of the cyclic load, the fifth stage of the cyclic load is unloaded to 0, and then the anchor bolt is pulled out by using the displacement control mode with a displacement rate of 3 mm/min. When the displacement of the bolt reaches 40 mm, the test is completed. The tension paths of the cyclic loading are divided into five stages; each stage comprises 20 cycles, and the loading frequencies are 0.17 Hz, 0.25 Hz, and 0.34 Hz, respectively. The lower limit tension T1min and upper limit tension T1max of the cyclic load in the first-stage cyclic load path are 10 kN and 20 kN, respectively. The lower limit tension T2min and upper limit tension T2max of the second-stage cyclic load path are T1min + 10 kN and T1max + 20 kN. By analogy, the upper and lower limit tension loads of the next-stage cyclic load path is from the lower limit Tmin + 10 kN to the upper limit tension Tmax + 20 kN of the previous stage’s cyclic load. The specimen label specifications are shown in Table 1. The experimental process is carried out according to the following loading and unloading paths:
Monotonic loading is used to determine that the ultimate load of the bolt is 122 kN, so the highest upper limit pull-out force is set as 100 kN.
The loading of the tension from zero to the upper tensile limit T1max = 20 kN is carried out for cycle I by using the force control mode with a loading rate of 1 kN/s; then, unloading to the lower limit of tension T1min = 10 kN is carried out. The loading and unloading are repeated 20 times to complete the first-stage cyclic loading experiment.
The cyclic loading path for the next stage is from the lower limit Tmin + 10 kN to the upper limit tension Tmax + 20 kN of the previous cyclic loading. The loading and unloading are repeated 20 times to complete the next-stage cyclic loading path.
Step 3 is performed repeatedly to complete the cyclic loading path up to the maximum tension of 100 kN and then unload to 0 kN after the end of the last cycle.
Monotonic loading is used to pull the bolt out to 40 mm when the test is completed.
Specimen grouping and label specification.
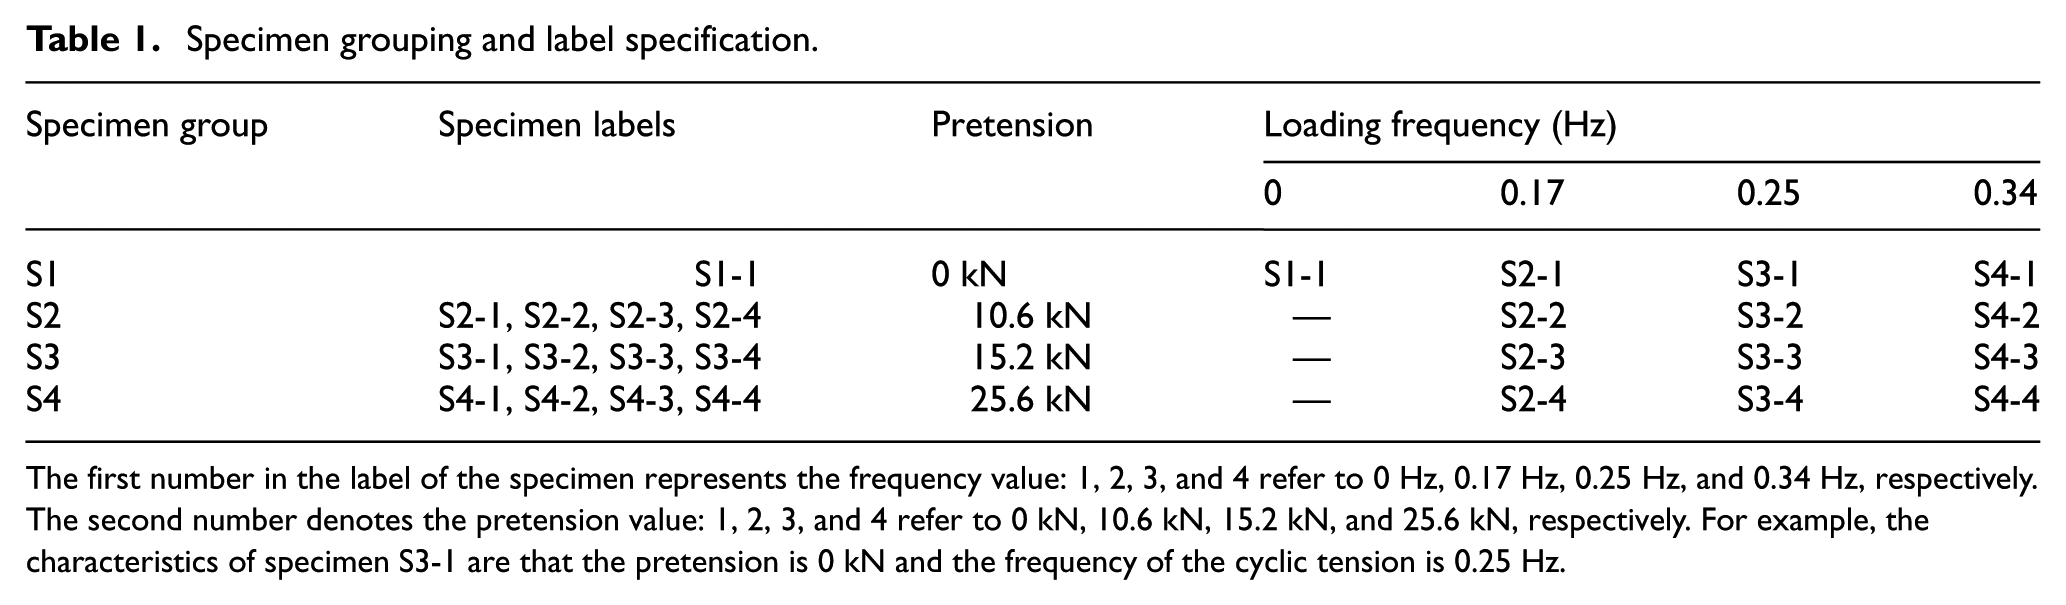
The first number in the label of the specimen represents the frequency value: 1, 2, 3, and 4 refer to 0 Hz, 0.17 Hz, 0.25 Hz, and 0.34 Hz, respectively. The second number denotes the pretension value: 1, 2, 3, and 4 refer to 0 kN, 10.6 kN, 15.2 kN, and 25.6 kN, respectively. For example, the characteristics of specimen S3-1 are that the pretension is 0 kN and the frequency of the cyclic tension is 0.25 Hz.
Analysis of test results
Mechanical characteristics of pretensioned bolts under cyclic loading
To study the mechanical characteristics of different pretensioned anchor bolts under cyclic loading, pull-out tests were carried out on anchor specimens with pretensions of 0 kN, 10.6 kN, 15.2 kN, and 25.6 kN using the same loading frequency. Due to the similarity of the results of groups S1, S2, and S3, only the pull-out process of the group S3 specimens is analyzed in detail. Figure 6 shows the pull-out tension-displacement curves of anchorage specimens S3-1, S3-2, S3-3, and S3-4.
Figure 8 shows that under cyclic loading, as the tension amplitude increases, the axial displacement corresponding to each level of cyclic tension also increases. Under the same cyclic tension amplitude, each cyclic process has a corresponding increment in the fatigue deformation, and the total displacement shows an increasing trend. As seen from the local enlargement diagram, every cyclic curve presents a sparse-dense two-stage development characteristic. A certain amount of displacement occurs in each tension cycle, and the increase in displacement decreases with the increase in the number of cycles. Thus, the accumulated total displacement increases gradually, which indicates that when the number of cycles of the same level cyclic load is sufficient, the displacement of each cycle tends to zero; that is, there is a certain displacement threshold. It can be inferred that the fatigue damage of an anchorage section under cyclic loading requires a certain critical value, and the increasing number of cycles does not necessarily lead to the failure of the specimens. These residual deformations are mainly caused by the adjustment of the internal structural planes of the anchorage agent and the closure of the cracks.

Tension-displacement curves of anchored specimens with different pretensions under cyclic loading paths. (a) Tension-displacement curve of S3-1 under cyclic loading path. (b) Tension-displacement curve of S3-2 under cyclic loading path. (c) Tension-displacement curve of S3-3 under cyclic loading path. (d) Tension-displacement curve of S3-4 under cyclic loading path.
Figure 9(a) shows that under the same loading frequency, the greater the pretension, the smaller the axial pull-out displacement. With the increase in the loading frequency, the greater the pretension force, the more significant the effect of the change in the displacement under cyclic loading. Figure 9(b) shows that under a cyclic load, with an increase in the loading frequency, the axial displacement of the anchorage specimens with the same pretension will also increase. The loading frequency has less influence on the axial displacement of anchorage specimens with greater pretensions. The results show that using a pretensioned anchorage can optimize the mechanical properties of the specimens, which is more beneficial to engineering applications.

Correlation curves for different pretensions, loading frequencies and pull-out displacements. (a) Pretension and displacement curves under different loading frequencies. (b) Loading frequency and displacement curves under different pretension conditions.
In Figure 9, the pretension, cyclic loading frequency and pull-out displacement curves of different specimens are fitted. The linear correlation between the pretension and displacement is greater than 0.8. The smaller the cyclic loading frequency, the higher the linear fitting degree between the pretension and the displacement. When the loading frequency in Figure 9(a) is 0.17 Hz, the optimal fitting degree is 0.96. In Figure 9(b), when the pretension is 15.2 kN, the loading frequency and displacement show a high linear fit degree, while the other three curves have low linear correlations. However, when the pretensions are 0 kN, 10.6 kN, and 25.6 kN, the fitting result between the loading frequency and displacement conforms to a quadratic polynomial.
Table 2 lists the displacements of specimens under different cyclic tension levels. With the increasing loading frequency, the total pull-out displacement increases. The total displacements of anchorage specimens S2-4, S3-4, and S4-4 decrease by 27.4%, 51.2%, and 83.0%, respectively, compared with those of anchorage specimens S2-1, S3-1, and S4-1. In this test, the anchorage specimens with a pretension of 25.6 kN have the best resistance to cyclic loading and are thus more suitable for cyclic loading conditions.
Displacement of the anchor bolt under different loading rates and pretension conditions.

Loading frequency effect of AE characteristics of pretension anchored specimens during pull-out
Figure 10(a)–(c) shows the relationship of the AE energy, cumulative AE counts, and AE emissivity of anchorage specimens S2-1, S3-1 and S4-1 during cyclic loading. Under the same cyclic tension path, with an increase in the loading frequency, both the maximum cumulative AE counts and the total AE activity decrease gradually, indicating that the damage degree of the system decreases. The region where the energy fluctuates greatly in the time-energy relationship corresponds to the transition between different levels of cyclic tension. The tension increases at the end of each level, which is prone to producing many cracks. Under the fifth level of cyclic tension, the energy is generally high, and the tension amplitude has a great influence on the energy under cyclic tension loading. In Figure 10(a)–(c), the black box regions A, B, C and D are the regions where the AE energy and AE counts rate suddenly increase simultaneously. At this time, large cracks appear within the anchorage ring or anchorage matrix. The AE counts rate does not seem to be very sensitive to the loading force compared with the AE energy, though the large crack propagation can be explained by the simultaneous increases in the AE counts rate and energy. 38

AE parameter curves under different loading frequencies. (a) AE parameter curves of specimen S2-1. (b) AE parameter curves of specimen S3-1. (c) AE parameter curves of specimen S4-1. (d) AE parameter relationship curves of specimens S2-1, S3-1, and S4-1.
The AE energy and AE counts rate can be used to analyze the timing of the large cracks that appear in the anchorage specimens. Figure 10(d) shows that the higher the loading frequency under a given cyclic path, the higher the average AE counts rate and the lower the total energy released during the cyclic loading. Under the given cyclic loading, the higher the loading frequency, the lower the total energy released, which leads to a lower degree of damage to the system when no prestension is applied. Figure 10(d) compares the cumulative AE counts during each cyclic loading level. The level of cyclic load can be clearly classified by the cumulative AE counts, and the shape of the cumulative AE counts curve does not change with different loading frequencies.
Table 3 is a statistical table of the total AE counts and average AE counts rate under different loading frequencies and pretension conditions. The average AE counts rate of anchorage specimens S2-1, S3-1, and S4-1 are 26.18, 98.323, and 122.65 times/s, and the total AE counts are 183,609, 156,319 and 101,791, respectively. For anchorage specimens with a pretension of 0 kN, the higher the loading frequency, the higher the AE rate and the lower the total AE counts. Therefore, increasing the loading frequency accelerates the damage process of the anchorage interface, consequently increasing the rate of microcrack formation and propagation in the anchorage interface so that the AE counts rate increases. The AE characteristics at different loading frequencies can be reflected by the average AE counts rate. Figure 11 shows that under a given loading frequency, the average AE counts rate and total AE counts are fewer for anchorage specimens with higher pretensions. With an increase in the loading frequency, both the average AE counts rate and the cumulative AE counts of specimens with higher pretensions decreased. The crack development of the anchorage interface under cyclic loading is a process of continuous closure and opening. With an increase in the loading frequency, energy is injected before the crack closes, which reduces the resistance to crack opening. Consequently, the cracks begin to expand, and the cumulative AE counts increase. Under a given cyclic loading path, an increase in the loading frequency results in a decrease in the action time under the same cyclic loading amplitude, and although the average AE counts rate is higher, the cumulative AE counts are gradually reduced.
Statistical table of AE parameters.
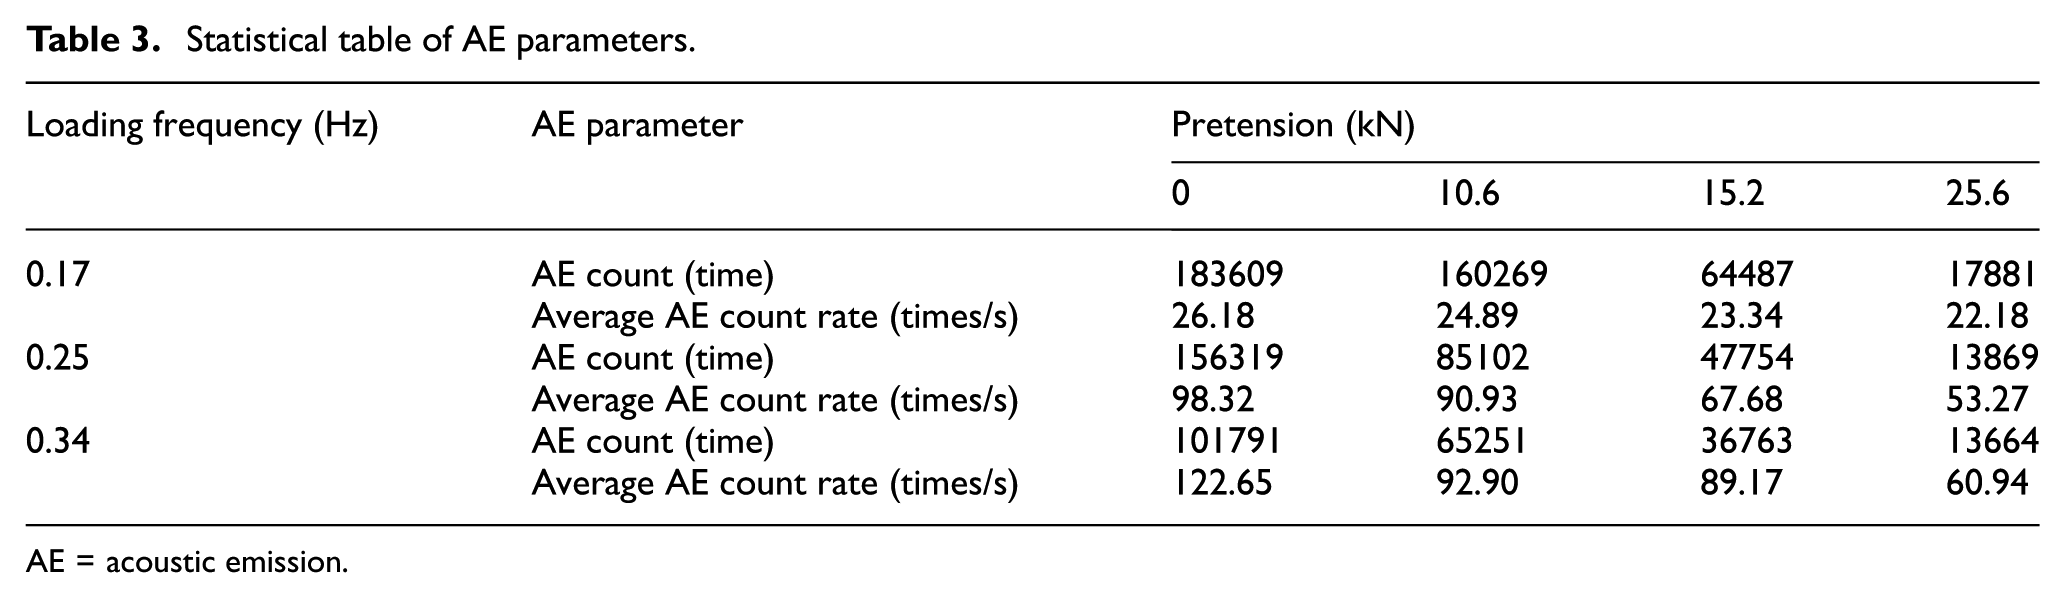
AE = acoustic emission.

The relationship curves among the loading frequency, the average acoustic emission (AE) count rate and AE counts under different pretension conditions. (a) The relationship between the loading frequency and the average AE count rate for different pretension conditions. (b) The relationship between the loading frequency and the AE counts for different pretension conditions.
Under loading frequencies of 0.17 Hz, 0.25 Hz, and 0.34 Hz, the cumulative AE counts of anchorage specimens with a pretension of 25.6 kN are 0.10, 0.09, and 0.13 times that of anchorage specimens with a pretension of 0 kN, corresponding to decreases of 90%, 91%, and 87%, respectively. Under the loading frequencies of 0.34 Hz and 0.25 Hz, the cumulative AE counts of anchorage specimens with a pretension of 25.6 kN are 0.78 and 0.76 times that of anchorage specimens with a frequency of 0.17 Hz, corresponding to decreases of 22% and 24%, respectively. The above results show that the pretension not only strengthens the performance of the anchorage system but also effectively resists the damage of the anchorage specimens under cyclic loading. Within a certain range, the greater the pretension, the stronger the resistance to failure under cyclic loading. The anchorage specimens with a pretension of 25 kN in the experiment are superior.
Tension amplitude effect of AE characteristics during pretension anchored specimen pull-out
The effect of the tension amplitude on the AE activity is discussed in terms of the cumulative AE counts. Under the pull-out test of cyclic loading, cracks develop in the anchorage system. The internal cracks generated at the anchorage interface accelerate their propagation and coalescence with repeated loading, and the damage degree can be characterized by the cumulative AE counts. From the pull-out test of pretensioned anchored specimens, the cumulative AE counts curves of 12 specimens show a logarithmic model under cyclic loading at different levels.
Figure 12 shows the relationship between the cumulative AE counts and the loading time of specimen S3-1. The curve of the cumulative AE counts under a cyclic loading path at different levels over time basically takes the form of a logarithmic model. In the first-level cyclic load path, the correlation coefficient of fitting is 0.79, which is slightly low. The correlation coefficient from the second level of the cyclic load is higher. The overall development law of the cumulative AE counts can be fitted by a logarithmic function

In this formula, A and B are the influencing factors of the cyclic tension amplitude, t is the time, and y is the cumulative AE counts

In this formula, T is the loading period, and F is the loading frequency.
From (1) and (2)

In this formula, n is the number of cycles, and f is the loading frequency.

Time-cumulative AE counts curve of specimen S3-1 under cyclic loading.
AE damage parameters and cyclic load damage effect analysis
Failure of the anchorage system is common with the failure of the anchorage interface, which is often the result of cumulative damage. In this study, as the continuous damage of the anchorage interface increased under cyclic loading, macrocracks gradually formed, which eventually led to the failure of the anchorage system. The AE damage parameter D was introduced to characterize the damage characteristics of the anchorage system under cyclic loading.
Assuming that the damage parameters of the rock are consistent with the AE activity, the general expression of the damage parameter 39 D is

where Ad is the damaged cross-sectional area and A is the undamaged cross-sectional area of the specimen. If the above formula is converted to an expression of the AE counts, the damage parameter Di in stage i is defined as follows

where Ni is the cumulative AE counts monitored in pull-out stage i and Nm is the total AE counts of the monotonic pull-out test. It is assumed that the damage parameters of the rock are consistent with the AE activity, and thus, the general expression of the damage parameter Di is as follows

where Nd is the cumulative AE counts in the pull-out process under cyclic loading, Ns is the AE counts in the monotonic pull-out process, and Dd is the damage parameter of the cyclic load.
Figure 13(a) indicates that with the increase in pretension, the cyclic damage parameters of the pretensioned anchorage specimens and the damage degree of the anchorage system both decrease. Table 4 reveals that under cyclic loading frequencies of 0.17 Hz, 0.25 Hz, and 0.34 Hz, the cyclic damage degrees of the anchorage specimens with a pretension force of 25.6 kN are 96.09%, 96.06%, and 96.24% lower than those of the anchorage specimens with a pretension of 0 kN. Figure 13(b) shows that under the same cyclic loading path, the greater the loading frequency, the smaller the cyclic damage parameters. From Table 4, it can be concluded that under cyclic loading frequency of 0.34 Hz, the damage degrees of the anchorage specimens with pretensions of 0 kN, 10.6 kN, 15.2 kN, and 25.6 kN are reduced by 7.99%, 41.53%, 35.56%, and 11.38% compared with those under the cyclic loading frequency of 0.17 Hz. Therefore, within a certain range, the greater the pretension of the anchorage specimen, the better the stability of the anchorage system during and after cyclic loading.

The relationship curves of the cyclic damage parameters under different loading frequencies and pretention conditions. (a) Pretension- cyclic damage parameter curves under different loading frequency conditions. (b) Loading frequency- cyclic damage parameter curves under different pretension conditions.
AE counts for the anchored specimens under cyclic and monotonic loading with different frequencies and pretension conditions.

AE = acoustic emission.
AE orientation point analysis for pretensioned anchorage specimens after cyclic loading
To describe the damage mechanism and failure characteristics of the anchorage specimens during the pull-out process from a microscale perspective, the internal incubation mechanism of the system failure was further discussed through the spatial distribution of the AE orientation points. The spatial distribution of the AE orientation points is located by multichannel AE sensors using three-dimensional time difference location technology. 40 The propagation characteristics of the cracks can be evaluated by AE energy. Specimens S3-1, S3-2, S3-3, and S3-4 are used to illustrate the analysis. Figure 14 shows the relationship curve between the tension and AE energy and the spatial distribution characteristics of the AE orientation points throughout the process of monotonic loading after a cyclic load disturbance.

Tension-energy curves and spatial distribution of acoustic emission (AE) orientation points during the pull-out process: (a) Tension-energy curve of specimen S3-1. (b) Spatial orientation AE point distribution of specimen S3-1. (c) Tension-energy curve of specimen S3-2. (d) Spatial AE point distribution of specimen S3-2. (e) Tension-energy curve of specimen S3-3. (f) Spatial AE orientation point distribution of specimen S3-3. (g) Tension-energy curve of specimen S3-4. (h) Spatial AE orientation point distribution of specimen S3-4.
Figure 14(a), (c), (e) and (g) presents a comparison of the time-tension and time-AE energy curves of anchorage specimens S3-1, S3-2, S3-3, and S3-4 during the pull-out process after cyclic loading. According to the AE energy activity from the anchorage specimens throughout the pull-out process, the pull-out process can be divided into several stages, which vary according to the specimens. The time-tension curve during the pull-out process for specimen S3-1 can be divided into three stages: (a) a period of energy increase, (b) a period of energy decrease, and (c) a period of energy calm. The pull-out process of specimens S3-2 and S3-3 can be divided into three stages: (a) a period of energy increase, (d) a peak energy period, and (b) a period of energy decrease. The pull-out process of specimen S3-4 can be divided into (a1) an initial period of energy increase, (d1) the first peak energy period, (f) a period of energy stabilization, (a2) a second period of energy increase, (d2) a second peak energy period, and (b) a period of energy decrease. Figure 14(b), (d), (f) and (h) shows the evolution of cracks in anchorage specimens S3-1, S3-2, S3-3, and S3-4 during the pull-out process after cyclic loading, captured in the form of acoustic information located in space. According to the tension, energy, and spatial distribution of the AE orientation points during the pull-out process, the damage failure mechanism of the bolt can be analyzed.
For the time-tension curve measured during the pull-out process of the specimen, in the period of energy increase (a), considerable AE energy is released during the linear growth stage of tension. The linear growth stage of tension is mainly affected by the elongation effect of the anchor rod, the regulation effect of the intershear lag between bond interfaces, and the occurrence and propagation of small cracks in the anchor ring. During the peak energy period (d), more active AE energy appeared because the failure mechanism is the breakage of the anchorage agent and debonding at the anchorage interface, accompanied by the elongation of a small part of the bar. The peak energy period (d) appears in specimen S3-3, and the high AE energy was mainly due to the elongation of the bolt body under the pull-out force, which can be confirmed by the ratio 0.80 of σi to σt. According to the spatial AE orientation points distribution corresponding to the tension-energy curve, the main reason for the lateral expansion trend of the S3-4 specimen in the energy stabilization (f) is the debonding of the interface and slipping between the anchorage agent and concrete matrix. This phenomenon can be determined according to the spatial distribution of the AE orientation points at the corresponding time and the ratio 0.23 of σi to σt. Different failure modes lead to different spatial distribution ranges of the AE orientation points.
There are two main factors affecting the spatial distribution of the AE orientation points: metal damage caused by bolt elongation and bond failure. Figure 14(a), (c), (e) and (g) shows that the greater the pretension of the anchorage specimen, the greater the transverse extension length of the time-tension curve in the pull-out process. Because the time is proportional to the displacement, the tension-displacement area is also increased gradually, and more energy is needed to destroy the anchorage system. Therefore, an appropriate pretension condition can effectively improve the reliability of an anchorage system under cyclic and monotonic action.
Discussion
To realize the nondestructive detection and safety monitoring of the anchorage quality, the pull-out test method of a short-encapsulation pull test (SEPT) is used to explore the AE characteristics of the failure process of the anchor under cyclic loading. SEPT is one of the effective methods at the laboratory scale to study the failure mechanism of an anchor. To do so, the anchor is inserted into a steel tube or concrete that simulates the matrix with the annulus between them being filled by a bonding material, resin, or cement. Martín et al. 41 theorized the constitutive model of the bolt-cement interface and verified the correctness of the theoretical model by testing methods similar to SEPT. Lin et al. 42 studied the relationship between the bolt shape and anchorage mechanical properties by SEPT. When the elongation and deformation of the bolt were similar to those of the in situ conditions, Bawden and Reichert 43 carried out “split-pipe” tests that are similar to SEPT in order to study the factors affecting the mechanical properties of the anchor bolts. The above reports verify each other, indicating that researchers prefer to use SEPT to evaluate the micromechanism of the anchorage and interface damage. The experimental method of this study coincides with SEPT, which proved to be reasonable and reliable, and therefore, basic research in the laboratory provides a good reference and guiding significance for the application of AE in the field.
Figure 8 shows that the displacement curves of each stage under cyclic loading exhibit sparse-dense two-stage development characteristics. It is found in the literature 12 that similar characteristics exist in the debonding process of a reinforced concrete matrix. With the increase in cycles, the deteriorative speed slows gradually. However, research on the response of pretension to cyclic loading shows that the larger the pretension, the smaller the relative displacement produced by each cycle. The mechanical nature of the effect of the pretension on anchorage specimens can be considered according to Ren et al., 44 who proposed an analytical solution for predicting the full-range mechanical behavior of grouted rock bolts in tension. Before cyclic loading, the pretension shifts the peak shear stress of the anchor to the end of the anchorage section. Based on the analytical solution, we speculate that under the same cyclic tension, an increase in the anchorage length leads to a smaller displacement of the pretensioned anchorage specimens, which needs further comprehensive research.
Regarding the amplitude effect of the anchored specimens during the pull-out process, formula (3) is put forward by fitting the test results. The fitting formula ignores several factors such as the pretension force, upper limit of tension, and lower limit of tension. If the formula is applied to engineering, we can determine the values of parameters A and B under cyclic loading with different cyclic tension amplitudes through a large number of experiments and then establish a sample library of tension amplitudes corresponding to parameters A and B. According to formula (3), the values of parameters A and B can be calculated from the measured cumulative AE counts, and the tension amplitude under cyclic loading can be inferred by comparison with the sample library. This study only makes some preliminary exploration and analysis; if the method is applied in the field, a further theoretical derivation is needed.
The concept of the cyclic damage parameter Dd is proposed in this study. According to the AE counts monitored in the cyclic and monotonic pull-out tests, the greater the pretension, the lower the cyclic load damage parameter. This parameter Dd can describe the damage degree of the anchorage system under cyclic loading. When the parameter Dd is applied in engineering, the sample database of accumulative AE counts corresponding to the anchorage failure degree should be established through field experiments. The damage degree of the anchorage system can be determined according to the accumulative AE counts generated by a cyclic load in engineering so that remedial measures can be taken, but its effectiveness in engineering practice needs to be tested.
Figure 15 provides local enlargements of Figures 14(a) and (b). Figure 15 shows that a small wave crest appears in the linear elastic stage of the resultant curves during the pull-out process after cyclic loading. During the tension loading process, a local debonding phenomenon occurs at the front end of the anchorage section, resulting in a small fluctuation of the pull-out force. Simultaneously, the AE energy fluctuates, which occurs in specimens S3-1 and S3-2 with low pretension. The damage of the anchorage specimens without pretension is more serious under cyclic loading, and local debonding occurs at the front end of the anchorage during the early stage of pulling out. In engineering practice, this energy fluctuation can be used to check the pretension magnitude of the anchorage and whether partial debonding occurs at the front end of the anchorage.

Partial fluctuation curve during the monotonic pull-out process. (a) Partial tension-energy of specimen S3-1. (b) Partial tension-energy of specimen S3-2.
Conclusions
Pretensioned bolt support plays an important role in the stability of roadways in underground coal mines. The mechanical response of bolts under cyclic loading will affect the stability of the roadways. In this study, pull-out tests of bolts under different pretension conditions were carried out to obtain the AE characteristics using cyclic loading with different frequencies and tension amplitudes. Some conclusions are summarized below:
During cyclic loading, the loading frequency has less influence on the axial displacement of anchorage specimens with greater pretensions. Under the same cyclic loading frequency, the average AE counts rates and total AE counts are fewer for anchorage specimens with higher pretensions. With an increase in the loading frequency, the average AE counts rate and AE counts of specimens with higher pretensions both decreased. In this test, the anchorage specimens with a pretension of 25.6 kN have the best resistance to cyclic loading and are more suitable for cyclic loading conditions.
Under cyclic loading, the cumulative AE counts in the anchorage specimen present a logarithmic trend. The fitting formula is y = Aln(n / f) + B, which can provide a reference for the inversion analysis of the cyclic tension amplitude.
The cyclic load damage parameter Dd is defined based on the AE parameters. During cyclic loading, with an increase in the pretension, the parameters Dd and the damage degree of the anchorage system both decrease. Under a given cyclic loading path, the greater the loading frequency, the smaller the parameter Dd.
After cyclic loading, the transverse extension length of the time-tension curve increases with the pretension, and more energy is required to destroy the anchorage system. The greater the pretension is, the better the stability of the anchorage system.
Footnotes
Handling Editor: Kenneth Loh
Declaration of conflicting interests
The author(s) declared no potential conflicts of interest with respect to the research, authorship, and/or publication of this article.
Funding
The author(s) disclosed receipt of the following financial support for the research, authorship, and/or publication of this article: This work was financially supported by the National Natural Science Foundation of China (Grant No. 51574226 and No. 51704277), the Fundamental Research Funds for the Central Universities (Grant No. 2017CXNL01 and No. 2018QNA27), and the Frontier Scientific Research Project of the China University of Mining and Technology (Grant No. 2017XKQY047).