
Abstract
WiFi received signal strength indicator seem to be the basis of the most widely used method for indoor positioning systems driven by the growth of deployed WiFi access points, especially within urban areas. However, there are still several challenges to be tackled: its accuracy is often 2–3 m, it is prone to interference and attenuation effects, and the diversity of radio frequency receivers, for example, smartphones, affects its accuracy. Received signal strength indicator fingerprinting can be used to mitigate against interference and attenuation effects. In this article, we present a novel, more accurate, received signal strength indicator ranking–based method that consists of three parts. First, an access point selection based on a genetic algorithm is applied to reduce the positioning computational cost and increase the positioning accuracy. Second, Kendall tau correlation coefficient and a convolutional neural network are applied to extract the ranking features for estimating locations. Third, an extended Kalman filter is then used to smooth the estimated sequential locations before multi-dimensional dynamic time warping is used to match similar trajectories or paths representing activities of daily living from different or the same users that vary in time and space. In order to leverage and evaluate our indoor positioning system, we also used it to recognise activities of daily living in an office-like environment. It was able to achieve an average positioning accuracy of 1.42 m and a 79.5% recognition accuracy for nine location-driven activities.
Keywords
Introduction
Indoor positioning systems (IPS) are increasingly needed as part of our daily life, as we increasingly spend 87% of our time indoors1,2 in increasingly more complex three-dimensional (3D) spaces. 3 IPS applications include smart building services, mobile asset or people tracking, 4 eHealth, 5 location-enabled games, and customised advertisements. Although a range of IPS techniques exist, they face different limitations in different scenarios regarding ease of use, requiring the use of or not of dedicated signal transmitters and receivers, power consumption, cost, and the heterogeneity of signal radio frequency (RF) receivers. This research targets using existing personal communication devices such as smartphones for indoor positioning rather than using additional specialised signal receivers. Under these requirements, WiFi or Bluetooth low-energy (BLE)-based positioning systems are the most widely adopted techniques. These received signal strength indicator (RSSI) techniques, from which position can be derived, can be divided into two types: First, the more straightforward to deploy, BLE or WiFi RSSI ranging, which uses path loss models can be used to calculate the user location. Even though these are easy to deploy, their accuracy can be severely decreased if there are obstructions, that is, a non-free space. Second, WiFi and BLE RSSI location fingerprinting can be used, which requires collecting a fingerprint or map of sets of RSSI measurements at reference locations in an offline phase for latter comparison with RSSI signals in an unknown location in the operational phase. Unlike BLE-based systems, for example, using iBeacon devices, WiFi location fingerprinting system does not need to deploy additional, specific, access points (AP). Scanning of barcodes and Quick Response (QR) Codes at known locations can be used as a crowdsourced way to collect and update RSSI fingerprints, that is, at known payment spots, which can significantly reduce the fingerprint collection work. However, these types of RSSI uses are also affected by the heterogeneity of the signal RF receiver in smartphones. Rather than the use of raw RSSI measurements as the fingerprints for the radio map database, the ranking of RSSIs from different APs can be used instead, and this mitigates against the heterogeneity of the RF receivers when constructing such fingerprints. Another positioning method proposed in Tsui et al. 6 applies unsupervised learning to handle the heterogeneity of RSSI receiver hardware to improve the location accuracy. However, over the growing numbers of deployed APs, an RSSI ranking of those APs can be applied, instead of applying additional unsupervised learning to process those measurements. Kendall tau correlation coefficient (KTCC) can be used to measure the ordinal association between two measured quantities (concordant and discordant ranking pairs). Besides, convolutional neural network (CNN) is good at feature extraction. RSSI ranking of different APs can be used as a feature to match patterns that can be applied in ranking-based fingerprinting systems. In addition, an AP selection algorithm to select a subset of all available APs not only reduces the computational cost for online positioning but also increases the positioning accuracy, for example, because some AP RSSIs are noisy or weak. 7
An IPS can be used to track the trajectories, paths or tracks of sequential locations of users, enabling indoor navigation services. Since the trajectory is based on sequential movement, motion models can be applied to help increase the tracking accuracy, for example, through using a particle filter or Kalman filter (KF). A further enhanced application of IPS navigation is that predefined hotspots or waypoints can be combined with the trajectories and used to recognise location-driven human activities of daily living (ADLs). There is a challenge that different users can vary the trajectories in time and space. Multi-dimensional dynamic time wrapping can be used to match paths from different or the same users that vary in time and space. 8
WiFi channel state information (CSI) can be used to recognise more fine-grained ADLs, for example, Wi-Vi, 9 WiSee, 10 and WiTrack. 11 The principle of such CSI-based sensing methods is to make use of channel information in the time and frequency domain, for example, the amplitude and phase of each subcarrier at each timestamp and to leverage how these changed features are affected by human activity between transceivers. By collecting and extracting these features at the training stage, test features can be matched with the training database to infer human motions and activities. However, such CSI-based methods rely heavily on a relatively stable RF environment, that is, they often rely on a single-occupant environment and no infrastructure or environment changes. Each occupancy or environment change would trigger an activity profile update or it may fail to work. Its recognition accuracy is reduced if there are more than two people in the same space. Although vision-based methods can offer positioning and ADL recognition services, these face problems of being privacy invasive and computationally intensive. Our purpose is to find the limitations of path matching to recognise location-driven ADLs to recognise coarse-grained activities such as to detect if someone went to the kitchen and dining area and stayed there. It is considered to be out of scope to consider more finely grained activities such as taking a cold drink from a fridge or making tea.
The main contributions of this article to build a novel RSSI ranking–based IPS that can also be used to recognise location-driven ADLs are three-fold:
Before constructing our radio map, our proposed AP selection based on a genetic algorithm (GA) is applied to reduce the positioning computational cost but also to increase the positioning accuracy.
Our novel RSSI ranking–based KTCC/CNN is used after our AP selection to improve positioning accuracy and to mitigate against signal receiver diversity. This technique could also be suitable for scenarios with dense Internets of Things, as transmitters embedded in smart objects can be treated as APs.
An extended Kalman filter (EKF) is then used to smooth the estimated sequential locations. Then, to the best of our knowledge, no one has in addition used multi-dimensional dynamic time warping (MD-DTW) to match similar trajectories or paths representing ADLs from different or the same users that vary in time and space. This can also be extended in multi-source signal scenarios, for example, combined with magnetic field sensing, to upgrade the path or activity recognition accuracy.
Methodology
There are usually two phases (offline training phase and online positioning phase) used by location fingerprinting methods. In our IPS, we also have such two phases, but after we collected the fingerprints, we select APs to improve location accuracy as some are noisey. In our previous work, 7 we proposed an interval overlap degree (IOD) determination method to do the AP selection. However, this method is based on the raw RSSI measurements, which is not suitable for ranking-based AP selection. Instead of using IOD, we propose another AP selection algorithm based upon a GA to select optimal APs. Then, the converted ranking fingerprints of the selected APs are be used to train our KTCC and CNN models to estimate the location of users.
In the online phase, the matching probability of using KTCC and CNN will be treated as weights of using weighted K-nearest neighbour (WKNN) classification algorithm to derive the user location.
Figure 1 depicts all procedures of our location fingerprinting IPS, in which we use AP appearance ratio before the AP selection algorithms and then, after estimating user’s location, we applied filtering algorithms to help increase our positioning accuracy. Then, combined path fingerprints will be used to recognise activities.

Overview of our combined WiFi RSSI ranking fingerprint positioning and activities of daily living recognition system.
Location determination using Euclidean distance
In most positioning methods, Euclidean distance (ED) is used to match the RSSI mean vector collected at an unknown location, with the RSSI mean vector at reference points (RPs) in radio map. The distance is expressed using the following equation

where
Then WKNN is applied to drive the user location, which is described as

where we use
Location determination using principal component analysis
Instead of choosing a subset of APs, 12 replace the elements with a subset of principal components (PCs), using a statistical procedure, where PCs are obtained by a transformation of the measured RSSI. The theory of this article is based on principal component analysis (PCA) to find an effective transformation such that the retained information in the chosen PCs can be maximised, which means it will not only reduce the computation cost but also increase the positioning accuracy by directly calculating the ED distance using the transformed RSSI

The concept of using PCA, which is a statistical procedure that uses an orthogonal transformation to convert a set of observations of possibly correlated variables into a set of values of linearly uncorrelated variables called PCs, is to reduce the dimensions by combining APs. In other words, information reorganisation is adopted, rather than AP selection. As shown in equation (3), the PCs

The property guarantees that using PCA can retain the maximised information when dimensions are reduced. PCA can be done by using eigenvalue decomposition of a data covariance matrix or singular value decomposition of a data matrix, usually after mean centring (and normalising or using Z-scores) the data matrix for each attribute.
Location determination using KTCC
Instead of using ED to match the RPs, we propose to use KTCC of RSSI ranking as the distance to match RPs. How to calculate KTCC can be expressed as equation (5) or (6)
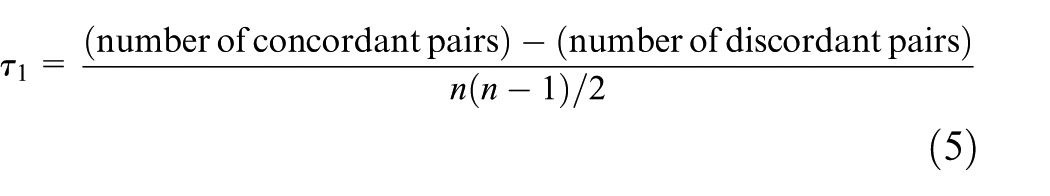
where we consider that the higher ordinal association τ between two quantities, the closer they are. Figure 2 visualised the concordant (blue) and discordant (yellow) pairs in a ranking fingerprint of five selected APs at two RPs. The blue parts represent the concordant pairs; the yellow parts are the discordant pairs.

Concordant and discordant pairs in KTCC.
For our KTCC method, we also use WKNN to derive the user’s location. However, we use
Location determination based on ranking-based CNN
Deep neural network models have been applied successfully to solve complicated problems, for example, facial recognition, driverless car, and machine translation. CNN is good at feature extraction. Our previous work 13 has tested that using KTCC can mitigate against the heterogeneity issue, which means the ranking relation between APs can help to match mobility paths as patterns. So, we propose that CNN can also be used to extract such features. Furthermore, several IPS employ deep learning to estimate users’ location. 14 However, most of those methods just use the raw RSSI measurements as the input data to train their positioning and do not consider the RF heterogeneity receiver impact and the consequent need to collect data from different smartphones. To mitigate against this hardware heterogeneity issue, RSSI ranking is used as our input.
For classification problems using deep neural network models, it is common to use a so-called softmax layer at the top of the network (Figure 3). For example, given three possible classes, the softmax layer has three nodes denoted by

Then, the outputs of softmax layer

An example of a deep neural network architecture (the input layer with 5 inputs, 15 neurons in each hidden layer, and 10 outputs in the output layer).
Figure 4 shows the architecture of the CNN model. Keras (for more details, see https://keras.io/; TensorFlow as a backend) was used to implement the CNN model. The model consisted of two one-dimensional (1D) convolutional layers and one max-pooling layer. After the convolutional layer, the model has a fully connected layer that is used to connect to the Softmax layer. The outputs of the Softmax layer become the weights in the location-determining phase.

The architecture of our CNN model (one example).
Probability comparison
In our IPS, we use WiFi RSSI ranks as our data input rather than using the raw RSSI measurements. Instead of using ED with RSSI values to compare which is stronger in the pairwise APs, we use a joint distribution. Let A represent the random variable for the RSSI measurements of AP A in the chosen time frame and B the corresponding random variable for AP B. Assuming the APs are independent, we choose AP A over AP B if P(A > B) > 0.5. More specifically, S1 is the set of RSSI values of AP A, and S2 is the set of RSS values of AP B in the time frame sampled

The reason why we chose this approach is based on the study by Elbakly and Youssef. 15 The RSSI measurements fluctuate over time, so it is better to use a probabilistic approach.
AP selection based on appearance ratio
In our experimental space, a total of 106 APs is detected in our pre-constructed radio map; however, if we use all APs, this will not only increase the computational cost to estimate locations but also reduce the location estimation accuracy. The accuracy of AP selection algorithms, would also suffers from imbalanced RSSI measurements, as not all RSSI measurements of all 106 APs can be recorded for each scan. For example, we collect fingerprints at each RP for 20 times, however, not all APs can be detected at each time. If
To solve this, we propose to select the APs using an appearance ratio first (when we set this ratio to 90%, 67 APs are selected), then using our AP selection algorithms is used on those selected APs. The idea of the appearance ratio is simple, as at each RP, we recorded several scans are recorded, then we based on its appearance ratio (the appearance times in every second divided by total scanned seconds) to select APs are selected at each RP, then combine all selected APs then together, which is in order to mitigate the filling values.
AP selection based on GA
Instead of selecting a specific number of AP, we use GA, an optimisation algorithm, to select the desired number of APs from all detected APs. The principle of GA is simple, which is based on natural selection – the process that drives biological evolution (Figure 5).

The general process when using a GA algorithm.
The GA repeatedly modifies a population of individual solutions. At each step, the GA selects individuals at random from the current population to be parents and uses them to produce the children for the next generation. After consecutive generations, it would evolve towards an optimal solution. The primary procedures of our GA are as follows.
Selection
This procedure is to select the individuals (parents), which contribute the population to the next generation. In our case, we randomly generate a specific number of selected AP list and then convert them to a binary vector: 1 means selected and 0 means this AP is not selected.
Individual solutions are selected using a fitness function, where fitter solutions will have more chance to be selected. Here, we use the performance of our validation dataset to measure the fitness; it can also be combined with information gain (IG) and mutual information (MI), which is mentioned in our previous paper. 7
Crossover
This procedure combines two parents to form children for the next generation. Based on our assumption, the excellent performance of positioning accuracy using KTCC is correlated with the specific sub-groups of all APs. If in this case, it also makes the GA better fit the ranking-based AP selection, as in the crossover procedure, they will change the sub-groups (DNA segment) to achieve a better positioning performance (new generation).
Mutation
In this procedure, random changes will be applied to those individual parents to form children. Namely, we randomly change the single segment from 1 to 0 or 0 to 1 based on the mutation rate.
EKF
EKF is an extension of KF. Although KFs 16 have been applied in a wide range of areas, in this case for navigation by acting as a filter they can smooth the point sequence to increase the indoor positioning accuracy. Some locations as points, because of noise, may be far away from a set of sequential locations or a path or trajectory. So, we can use the status (e.g. speed, direction) estimated from the first few points in this path to predict the status of remaining points. Then, all points would be closer to the path. KF is used to smooth the possible low-accuracy points which are far away the path. KF has a constraint that the dynamic system must be linear. However, this condition is hard to satisfy since the dynamic systems in the real world are always complicated and cannot be summarised with a linear function. EKF is developed for such a nonlinear system.
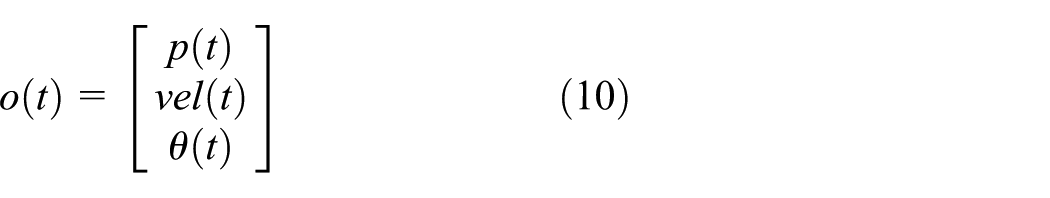
EKF is able to estimate and update the states of a nonlinear system by linearising it with the help of first-order Taylor expansion. In other words, when predicting the state in the next time step using state transition function, instead of finding the transfer matrix, we find the partial derivatives of the state transition function and observation function, represented by a Jacobian matrix. Different from the KF implementation, the state o(t) for EKF is defined as
where


By finding a matrix of partial derivatives of the fours above, we can get the linearised model of the system and estimate or update the states of the moving target. After path smoothing using EKF, MD-DTW will next be used to detect and match similar paths.
Path matching–based ADL recognition
The rationale for using path matching to recognise ADLs is threefold: (1) a trajectory is more distinctive than a position, (2) most office corridors are long and narrow pathway, and (3) most users follow a straight walking direction.
17
Hence, dynamic time warping (DTW) can be used to compare two time series with different lengths to improve the recognition and classification of our specific defined trajectories that represent activities.
18
Suppose there are two time series

An example of a warping path.
A traditional DTW can effectively classify two time series from a single source. However, in many cases, signals having multi-dimensions will be employed at the same time, which can be used to better align two time series compared to one dimension. Therefore, Ten Holt et al.
8
proposed an improved MD-DTW method which was used in gesture recognition conducted by the camera. Assume
Nguyen and Luo
19
used DTW with the magnetic field to predict the personalised route; Shi et al.
20
used DTW to improve the positioning accuracy. However, most researchers focused on using DTW to improve the IPS accuracy; no one has used such combined measurements to recognise ADLs. One reason is that with current positioning accuracy, it may not achieve a good recognition accuracy. In our research, we aim to recognise coarse-grained ADLs using combined estimated locations and RSSI ranking–based fingerprints. Since trajectories of human mobility contain the cue to infer ADLs, path matching can help us to find the closest trained path as well as its corresponding activity. Two kinds of WiFi fingerprint matching methods to localise are already introduced above. Compared to the location path (path of ground truth or estimated locations) matching scheme, ranking-based matching adds a matching process of RSSI ranking–based MAC address vectors from multiple points. Hence, fused matching can be implemented by using two different variables, estimated locations, and sorted RSSI ranking MAC address vectors. Their feature matrices
The

However, past work only focused on path matching using one of these two feature vectors
The fusion process is as follows. First, as the range of KTCC results is from 0 to 1, instead of standardising each type measurement, we normalised the distance between the estimated coordinates. Min–max normalisation can map the distance values to the range of 0 to 1 and make each type of result be within the same scale. Equation (12) shows the normalised distance

where z equals to
Experimental setup
Location fingerprinting
A field experiment was conducted in a 13.0 m × 30.0 m PhD office at the Queen Mary University of London. The training dataset was collected using smartphone (Nexus 5). Validation and test datasets were collected manually by holding the Nexus 5 at mid-body height in front.
Over 106 APs (with different MAC addresses) were detected during the whole training data collection procedure (we believe some of them are dummy ones); hence, this is also one reason why we need AP selection algorithm.
At each RP, the varying RSSI measurements (and hence varying ranking) were collected for 40 s. We use the ranking of collected RSSIs in 2 s as each training data for our model. Hence, each training RP has 20 RSSI ranking vectors.
The 113 reference points (RPs) shown in Figure 7 are our training data, which are used to train our models. Our validation dataset is the rest 70 TPs, which is used to validate our system (the layout fits for the ADL recognition). We collected data from those TPs 20 times; half of them will be treated as test dataset and the rest will be treated as validation dataset. Figure 7 also shows the layout of the office. The blue dots are RPs, which are 1 m apart. The red dots are TPs, and the distance between each TP is based on the length of each step.

A ground floor plan of a PhD students office.
Figures 8 and 9 show our fingerprint collection application and drone, respectively, as another key issue of location fingerprinting is time-consuming and laborious collection work. To solve this, we developed the fingerprints collection drone. However, it is not fully autonomous, for example, to keep it fly correctly within the designed path. The fingerprint collection application will collect raw RSSI measurements and simultaneously convert them to a ranking ordinal vector using probability comparison. As we also mentioned that it is onerous to collect and update the radio map. Currently, we set our drone as a carrier to carry the smartphones to collect fingerprints following the lines at a fixed 1 m height.

Our fingerprint collection application.
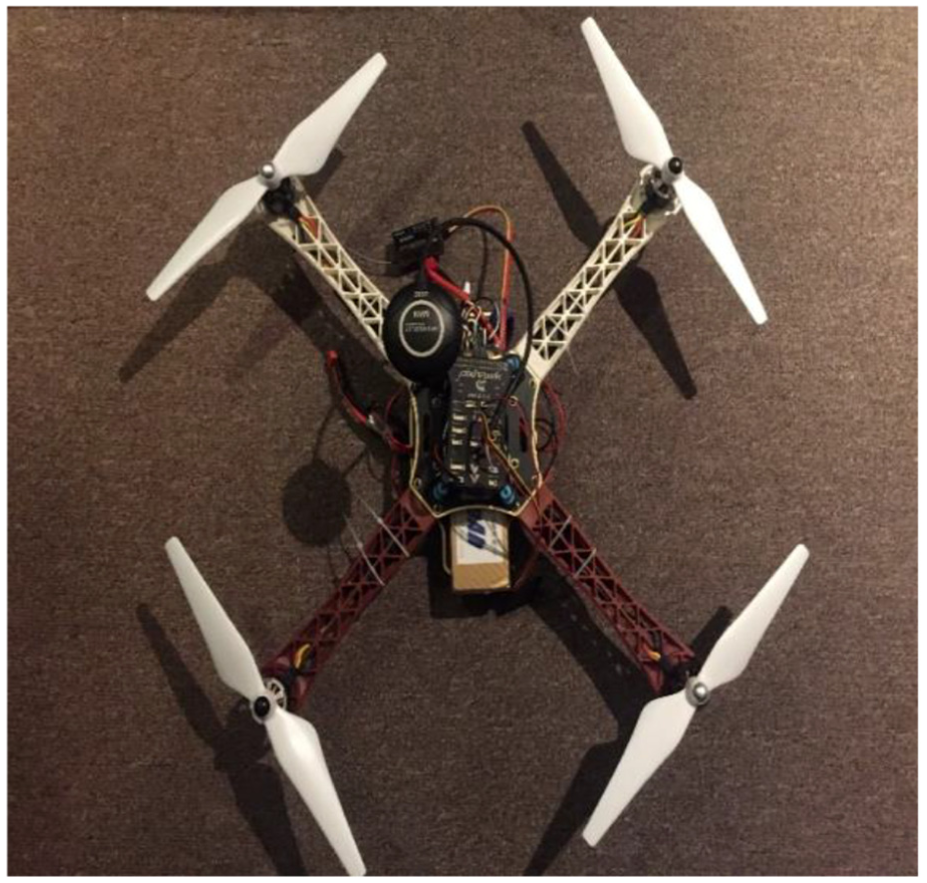
Our fingerprint collection drone (prototype).
ADL recognition
For the ADL recognition part, we designed nine specific activities which are listed in Table 1. Those nine activities are divided into two classes related to the length of the paths.
List of activities of daily living.
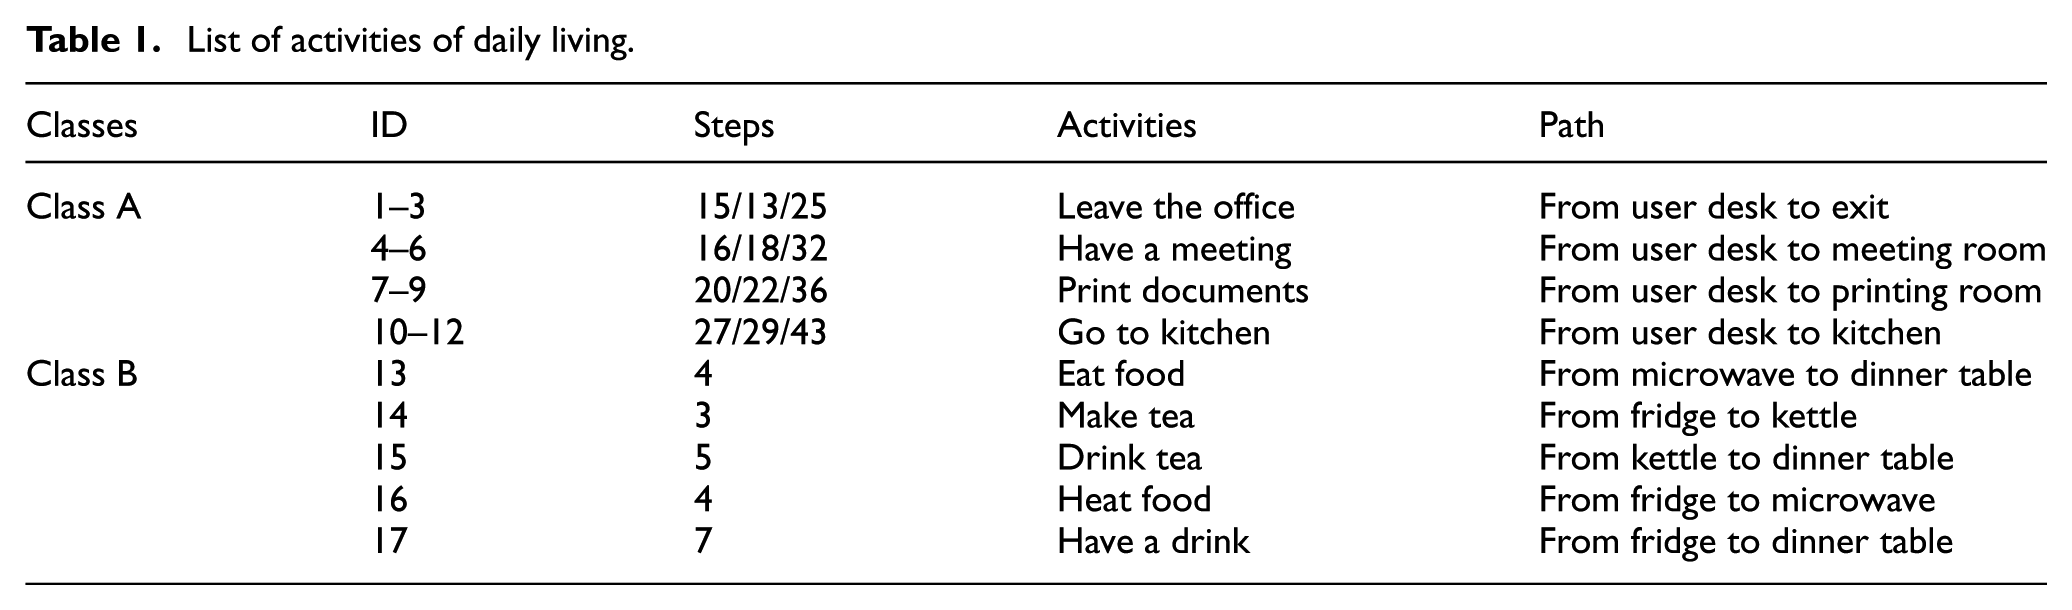
The activities among Class 1 with long paths are shown in Figure 10, and Class 2 activities with short paths are shown in Figure 11 (in the kitchen). Since the activity recognition accuracy is related to the path length and dimension of feature matrix, these two class activities can constitute a comparative test for the effect of path length on recognition accuracy. As shown in Figure 8, there are different directions (colours) from user desk to other places (exit, meeting room, printing room and kitchen). Therefore, there are three paths for each activity among class 1 – 12 paths in total. For activities among class 2, each of them has 1 path – 5 paths in all. During the experiment, we repeatedly collected activities for 20 times so that there were 17 × 20 = 340 paths.

Overview of class 1 activities.
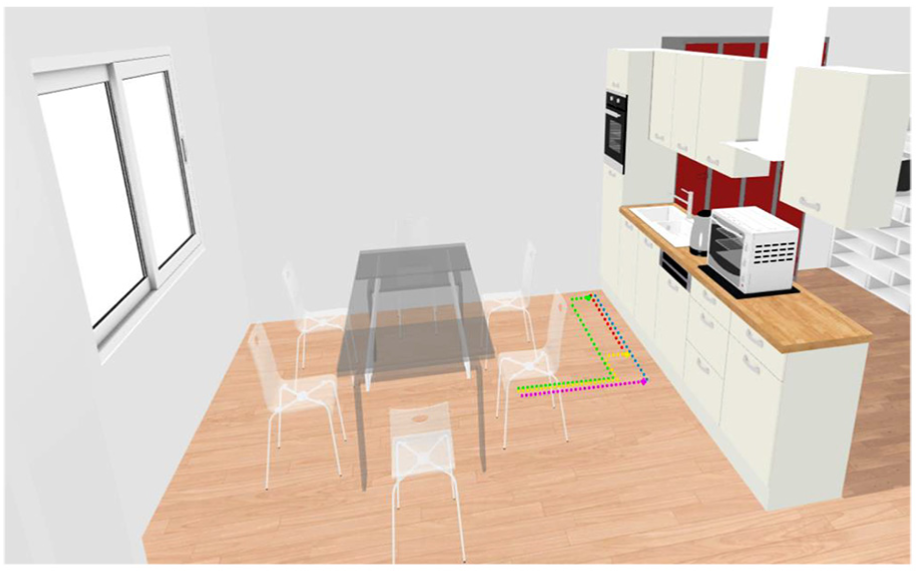
Overview of class 2 activities.
Evaluation
Location fingerprinting
In our pre-experiment, we have used two different types of radio map: one is using averaged RSSI measurements at each RP, which makes a relatively stable feature of each RP; another type is just to use the multiple scans measurements, which maintains data diversity. Then, we undertook repeated estimating locations by changing the parameter K in WKNN, which is shown in Figure 12. It shows that the positioning accuracy is related to k, and we will choose the best performance k for each method using the validation dataset. The best performances of these four methods are 2.57, 3.74, 2.44, and 2.18 m, respectively. It also shows that ED using averaged RSSI measurements performs better than using multiple measurements, and KTCC using ranking based on a total probability comparison performs worse than KTCC using multiple measurements. This maybe because KTCC may be sensitive to varying RSSI, which causes a varying RSSI ranking. Our focus is on ranking-based methods. So, in the following experiments, we use the multiple measurements radio map for ranking-based methods.

Performance using different K values in WKNN.
Furthermore, the best positioning accuracy for the above methods (same order) using a total of 106 APs is 2.91, 3.84, 2.77, and 2.51 m, and by using an appearance ratio method only (67 APs are selected from all 106 APs using the appearance ratio), the positioning accuracy increases by 11.6%, 3.3%, and 11.9%, respectively. However, ED (using averaged RSSI measurements) using whole APs performs 15.1% better than using appearance ratio selected APs, which means ED using averaged RSSI measurements can be more robust to use.
Using an AP selection algorithm not only reduces the online positioning computational cost but also increases the positioning accuracy. We have proposed our IOD AP selection algorithm which performs better than using IG and MI. 7 However, we found that PCA performs better than our IOD algorithm based on the results shown in Figure 13 (dashed lines show the best corresponding positioning accuracies). However, it is not a ‘real’ AP selection algorithm; it needs to calculate PCs each online scan, which has a higher computational cost than using AP selection algorithms when doing online positioning. In this article, we choose to deploy PCA as our positioning baseline method to compare with our proposed ranking-based methods, as it offers a higher positioning accuracy – the best accuracy is 2.01 m when using only 2D coordinates.

Performance when using IOD and PCA.
However, those AP selection algorithms are not designed for ranking-based methods. To solve this, we have proposed our GA algorithm to select APs, which can directly find the optimal AP list, instead of considering all APs.
Figure 14 shows the improved positioning accuracy (test dataset) by using our proposed GA, and its positioning accuracy converges after having 28 training epochs (validation:1.92 m, test: 1.94 m with using 33 selected APs). Then, the selected AP list will be used for our KTCC and CNN methods.
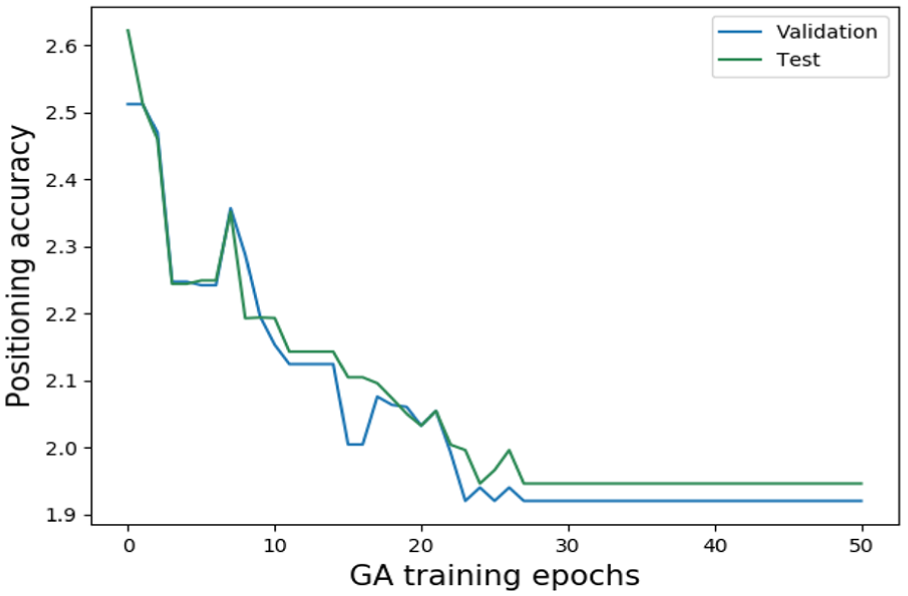
Improved positioning accuracy by using GA.
Figure 15 shows the performance of using our CNN model with GA selected APs; it also shows that over the training, the positioning accuracy increased and then decreased, which means that it relates to how well we trained the model. The best positioning accuracy achieved is 1.88 m, where the corresponding classification validation accuracy is 57%. Note that it is not necessarily the higher the classification accuracy, the higher the positioning accuracy. An over trained model will also cause a decreased positioning accuracy, which means if we use models like CNN, we need to keep the balance between classification accuracy and positioning accuracy. A similar positioning accuracy also means that less hyperparameter tuning is needed and has the ability to compete with the state-of-art neural networks used for IPS. However, it is possible to achieve a higher positioning accuracy by tuning the hyperparameters of neural networks. So, we can depend on the requirements to choose the methods. In our experiment, we used KTCC to do the ADL recognition, because of its simplicity. Both KTCC- and CNN-based methods perform 3.5% and 5.9% better than our PCA baseline method – the accuracy is 2.01 m.

Improved positioning accuracy by using CNN.
As the TPs are collected from several designed paths, we can deploy the EKF model to increase the positioning accuracy using a uniform motion model. The positioning accuracy increased from 1.94 m (KTCC) and 1.88 m (CNN) to 1.42 m and 1.54 m, respectively, when we use the EKF. Figure 16 shows the improved positioning accuracy (KTCC).

Improved accuracy using EKF.
To test our proposed RSSI ranking location fingerprinting method using KTCC again, 13 a repeat experiment was carried out in the Lab testbed. Figure 17 shows that when using a different phone (BlackView 1), the proposed method (averaged positioning error 2.42 m, 90% in 4.52 m) performs better than using the ED method (3.18 m, 90% in 4.51 m), which also proves that our ranking method is more robust and mitigates the RF receiver heterogeneity issue.
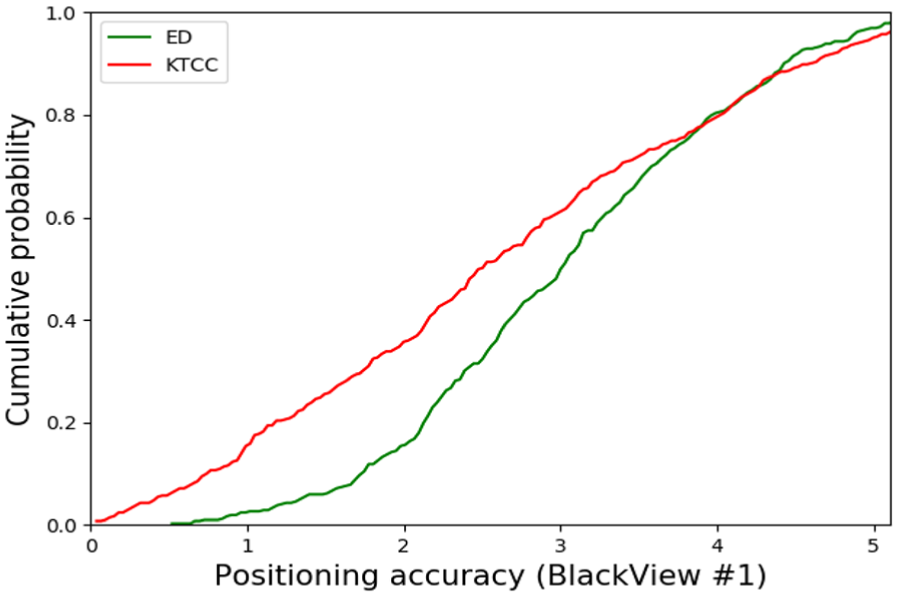
Accuracy comparison using a different phone (between training and testing).
ADL recognition
Figure 18 and Table 2 show the activity recognition accuracy of using estimated locations, ranking vectors and fusion-based methods. C1 is the set of class 1 activities, C2 is the set of class 2 activities and mix represents C1 plus C2 activities. From the result, we can see that the recognition accuracy of C1 is better than that of C2, which indicates that the activities with short paths are harder to be recognised than activities with long paths which also can explain the degradation of recognition accuracy for the mixed set compared to that of C1, which means the longer the path (but with less common points), the higher the accuracy. Moreover, the proposed fusion MD-DTW has the best recognition accuracy; it also means that ranking-based fingerprints can do more than just localisation, and it can also be explored to recognise ADLs.

Confusion matrix of our recognition results.
WiFi location–based activity recognition result.

DTW: dynamic time warping; KTCC: Kendall tau correlation coefficient.
In Figure 18, the confusion matrix of the recognition results describes how well the designed activities are recognized. The worst performance (15%) is to recognise the print document activity (80% data are wrongly recognised for activity 8 – the same type activity as 7 but uses a different path). However, it is acceptable as the final output still will be the print document activity. The reason for this is paths 7 and 8 share a lot of common points (step or distance), which makes it harder to discriminate between them. This also happens for path 3 and path 7, path 14 and path 16, and path 15 and path 17. However, it is found that if the paths have more than four different steps (2 m), the most recognition accuracies become 100%, which means it has a high probability to discriminate paths with a 2 m (distance) difference.
Conclusion
RSSI measurements for different smartphones at different times were collected. The heterogeneity of hardware impact decreases the positioning accuracy of conventional localisation methods. We have proposed to use KTCC and CNN with WiFi ranking to address this issue. We also introduced a ranking-based AP selection algorithm using GA, which not only reduces computational cost but also increases the positioning accuracy.
Our location fingerprinting validation results show that our IPS can get an average real-time positioning error of 1.42 m, which would not be severely affected by the heterogenous RF receiver device issue. It improves the positioning accuracy compared to existing state of the art IPS systems (our PCA baseline system). However, we do not know the exact APs number and their positions, so topology of APs is not taken into account.
This article also focused on the ADL recognition using WiFi ranking fingerprint-based location awareness. We designed 9 activities and 17 routes and validated our strategy in an office at the Queen Mary University of London. The best performance of our proposed fusion method is 79.5%, By extending our multi-source information fusion model, other signals like magnetic field 21 can also be fused to provide more eigenvalues for path matching to lift the recognition accuracy.
There are four directions for our future work. The first is that recurrent neural network (RNN) can be investigated to derive user’s locations and to recognise their activities, as it is a time-series data, for which RNN has a good capability to deal with. 22 Second, we can fuse more information, for example, GPS measurements and accelerometer measurements, to expand the data dimension and then to increase recognition performance when the size of the AP set is not large. Third, we aim to improve on ADL recognition23,24 using stay points (where a moving object stays for a period of time) and to combine other sensors such as inertial sensors to improve the separation of different spatial overlapping activities, which is one of the weak points in this study. Forth, we need to improve user’s trust in the system by safeguarding the privacy of sensitive users’ location tracking information.25,26
Footnotes
Acknowledgements
We also acknowledge the support of NVIDIA Corporation with the donation of the GPU used for the data analytics.
Handling Editor: Miguel A Zamora
Declaration of conflicting interests
The author(s) declared no potential conflicts of interest with respect to the research, authorship, and/or publication of this article.
Funding
The author(s) disclosed receipt of the following financial support for the research, authorship, and/or publication of this article: This research was funded in part by China Scholarship Council (CSC) and QMUL PhD Grants.