
Abstract
In indoor positioning techniques, Wi-Fi is one of the most used technology because of its availability and cost-effectiveness. Access points are usually the main source of Wi-Fi signals in an indoor environment. If access points are optimized to cover the indoor area, this could improve Wi-Fi signal distribution. This article proposed an alternative to optimizing access point placement and distribution by introducing virtual access points that can be virtually placed in any part of the indoor environment without installation of actual access points. Virtual access points will be created heuristically by correlating received signal strength indicator of already existing access points and through linear regression. After introducing virtual access points in the indoor environment, next will be the addition of filters to improve signal fluctuation and reduce noise interference. Kalman filter has been previously used together with virtual access point and showed improvement by decreasing error distance of Wi-Fi fingerprinting results. This article also aims to include particle filter in the system to further improve localization and test its effectiveness when paired with Kalman filter. The performance testing of the algorithm in different indoor environments resulted in 3.18 and 3.59 m error distances. An improvement was added on the system by using relative distances instead of received signal strength indicator values in distance estimation and gave an error distance average of 1.85 m.
Keywords
Introduction
Indoor positioning continues to develop with the current age of Internet of things (IoT). Navigation inside large infrastructure has been improved thanks to accurate positioning and location estimation. One of the common techniques used in indoor localization is Wi-Fi fingerprint mapping which is considered cost-effective due to requiring only hand held mobile devices such as smartphones and tablets in estimating user location. 1 As different facilities would already have existing wireless local area network (WLAN) networks, it is easier to locate access points (APs) and create fingerprint map (FM) of their received signal strength indicator (RSSI) values. 2 This gave rise to the idea of additional APs 3 in the WLAN network without affecting their operation by simply creating virtual access points (VAPs).
The other topic in this article is the VAP. VAP is defined as a virtual machine running on a single physical AP with different service set identifier (SSID). It can be virtually constructed to the AP on a certain location in the indoor environment through statistical models.4–6 The VAP can be constructed with relation to the current existing APs in the structure by linear correlation regression, which proves the advantage of VAP in fixed WLAN infrastructure since there will no longer be a need in deployment of actual APs.
Previous study was done on the creation of VAPs, 7 and it proved to be effective by reducing the error distance compared to only using RSSI values of existing APs. In that approach, VAP delivers the position of the user in the range of about 4 m, which is an improvement from just using APs. The inclusion of Kalman filter (KF) was also presented in a previous work. 8 The result of that experiment showed that KF made further improvement to VAP by reducing the noise in individual test points which made the overall average error distance lower. Even though performance is not better compared to recent studies on Wi-Fi fingerprint localization, this article’s intent is not on the performance increase but on the introduction of VAPs as low-cost substitution to installed APs in Wi-Fi environments.
To test the effectiveness of filters, this article aims to apply particle filter (PF) together with KF. Most indoor infrastructure have walls and partitions which obstructs line-of-sight (LOS) radio signal, and this proved to be an obstacle in indoor localization 9 proposed using PF to overcome LOS problems and showed good results. Since KF is good in linear calibration, the article hopes to improve the performance of localization using non-linear calibration.
In summary, this article contributes an RSSI-based indoor localization by the following:
Proposing a VAP algorithm to build VAPs into an indoor environment where it will act in the same manner as a normal AP. This is tested in different scenarios. VAP RSSI is generated using statistical analysis of its correlation with other APs. The statistical analysis used by VAP is an advantage over other APs since the data obtained by VAP can be used to predict RSSI values of APs in the indoor environment.
The application of KF to calibrate the RSSI signals statistically generated by the VAP. The advantage of using KF is its ease of use since it only requires the RSSI vectors and coordinates to perform calibration on the location estimation. This filter is used in the linear calculation of location estimation.
The application of PF in combination with KF which will then estimate the location of the mobile user. The system provides the calculation assistance in calibration of the KF. PF is used to do non-linear calibration of the algorithm which is unlike the KF which is only capable of using the linear calibration. The combination of these two filters will compensate for the drawbacks of using only linear or non-linear calibration of the RSSI signals.
Related works
Fingerprinting technique has been the core foundation of Wi-Fi positioning system. 10 Its major component is the recorded RSSI values of radio signals present in the indoor environment, usually from APs. These data are used to generate a map of the environment with different power level of signals received from the wireless network. This map is then used to obtain current location of mobile user in real time by comparing RSSI values received in their mobile devices, with those stored in the FM. Generating the FM requires a training phase for evaluating the indoor environment also known as the offline phase. In this phase, RSSI is usually recorded from APs, since they have fixed location and maintained signal power levels.
Since APs play a fundamental role in Wi-Fi positioning systems, its placement and numbers affect the overall result of location estimation. 11 The established map is crucial since it will serve as the reference map for any mobile devices. Most maps are generated only once and are updated if additional APs are added in the wireless system. One method of adding APs without the tedious survey process is the addition of VAPs. This approach improved indoor localization by simply adding VAPs in the evaluated area without making changes in the existing wireless network. It also has the feature of choosing AP location that can give the optimal signal distribution which can affect the correlation of RSSI from different existing APs.
In the fingerprint-based localization phase, the data collection phase is a very important and time-consuming process, especially with the addition of VAPs. But since VAPs are created by statistical analysis, no additional hardware will be needed in the study. This has motivated the research to create a VAP in the current existing Wi-Fi environment, creating an algorithm that will make use of VAP and fingerprint scheme to achieve a better performance compared to the conventional fingerprint scheme.
In a previous work,
11
the goal was to create a VAP in the indoor environment with optimal placement.

where
Another important factor to consider is the correlation of the temporary VAPs and APs during data gathering in the offline phase. A high correlation with absolute value of greater than 0.50 indicates that APs significantly affects what
VAP is created in an open spaced indoor environment without any obstacles. Two VAPs were added to the existing three APs, whereas one VAP was placed in the exact opposite of one existing AP and the other VAP was placed in the middle of the indoor environment. Although the experiments cause the best results, it was done with a series of trials and simulations in order to determine the VAP location. This was done during the data collection phase for the FM and takes more time than conventional data collection where RSSIs of the existing APs are collected. In the same manner, the creation of the VAP also requires much time as in the case of VAP location.
VAPs will be created in the FM by first simulating an AP in a strategic location. RSSI values will be obtained in the test environment. After obtaining the RSSI values, regression coefficient will be computed together with the already existing APs. VAPs will be created by the regression coefficient using the equation

where
System model
Design philosophies
Previous studies on VAP yielded improvement in location estimation accuracy over standard fingerprint localization technique which made its study a topic of interest. One of the reason for pursuing VAP is because it only needs a temporary AP to be placed in a strategic location to harness RSSI data for correlation and linear regression calculations. VAP system also has a disadvantage due to its dependence on RSSI signals from other APs. Therefore, there is a need for calibrating RSSI values to improve the performance of the VAP system. Many papers introduced many filters in their indoor localization systems, mostly using KF and its variation, and PFs for complex and higher computational requirements. A study done on VAP with additional filters 12 showed that integration of filters in the system will not hinder VAP but improve its performance. To further test this effect, experiments in different indoor environments will be done to compare the results of VAP performances with and without filters.
Problem analysis
The VAP model provided the innovation of adding a virtual hardware similar to actual APs without physically installing and integrating it into the WLAN of an indoor environment. It provided advantages over other indoor localization because it only utilized existing APs without making alterations in the already existing infrastructures. However, the study on the VAP has it disadvantages, such as its dependency on the positioning and placement of a VAP in the indoor environment. The result of a previous study on VAP showed that changing the placement of a VAP actually increased the error distance instead of decreasing it. The result denotes that not all desired location of VAP can improve the performance of localization. Correlation of APs and VAPs directly influenced the increase or decrease of error distance of estimated location. Locating the optimal location of VAP by trial and error is not an efficient method but it can be avoided by calibrating the RSSI signals through filters. Table 1 shows the difference of error distance between APs and VAPs with respect to their placements.
In past experiments, applying filters reduced the time-consuming process of locating the optimal placement of VAPs. Using filters to calibrate the predicted RSSI values of the VAP assisted in the reduction of data gathering in the offline phase. The disadvantage of using only VAP is the lack of filtering in the RSSI signals of both APs and VAPs. Since both APs and VAPs are used to estimate mobile user location, it is necessary to calibrate both RSSI signals in the offline and online phase. The first filter used in VAP, the KF, showed a decrease in error distance compared to using only uncalibrated RSSI values during location estimation.
Error distance comparison of APs and VAPs.

APs: access points; VAPs: virtual access points.
System architecture
Offline phase
In order to generate the VAP matrix, RSSI values must first be collected from temporary APs that positioned in the place of VAPs. Correlation coefficient also needs to be calculated to determine the optimal placement of the VAPs.
In this phase, it is required to collect fingerprint data using RSSI signals from existing APs. These RSSI signals will be recorded with respective coordinates in the two-dimensional (2D) plane. To simulate the VAP, a device capable of emitting radio signals will be placed in the desired location of the VAP. These devices will act as VAP in order to gather correlation data with other APs. APn in dBm will be the measured RSSI of APs in each RPs. The generated FM will have N number of APs and M number of VAPs. After completing the survey of the indoor map, AP and VAP correlation
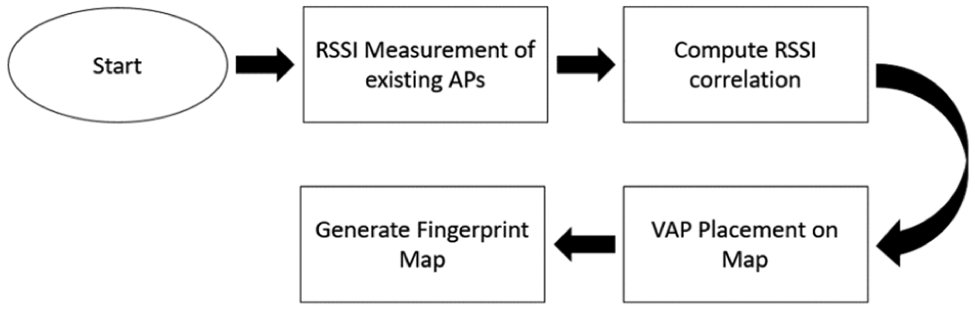
System flow during the offline phase.
Online phase
In order to make use of filtering schemes, VAP will be integrated with KF and PF. The integration of VAP with KF and PF will be done in the online phase where the KF process will be executed. After KF is executed, PF will be the last filter to be used in the whole filtering process of the VAP.
In this phase, real time measurement of RSSI from APs to the mobile device will be recorded and the VAP algorithm
8
will compute for the VAP RSSI. This will create a matrix of RSSI values of combined

System flow during the online phase.
KF filtering module
The KF function module operates independently with the VAP function module but requires the created VAP value from the VAP function module to calculate the optimal VAP value. This module is divided into four submodules such as the Set Prediction, the Computing for Kalman Gain, the Updating of Predict State Value, and the Updating of Error Covariance. 13 These four submodules are repeated in a loop with the VAP value as an important external value. The output of this module is a VAP value which will be then used in the localization submodule of the VAP function module. This KF module leads to the improvement of localization accuracy in the indoor localization algorithm using VAP proposed.
In Labinghisa et al., 12 during the Prediction step, xk is the predicted state estimate of the object from its observed measurements (RSSI), with changes as k – 1, or the previous state with k representing time as shown in equation (3). xk will be the present location of the user. In this step, Fk represents the matrix of set predictions made from xk – 1 to xk. Also computed in this step is the predicted covariance matrix Pk as seen in equation (4).


Pk is the covariance used to make a set matrix based on Gaussian distribution.
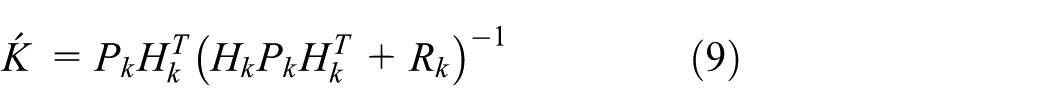
First, Kalman gain K will be determined to update the measurement date. Kalman gain is the matrix that outputs the minimum mean-square error by combining the variables from the predicted state and the observed measurement with noise covariance Rk, as seen in equation (5).
The observed measurement are represented by zk, with Hk representing the matrix of it. This is seen in equation (6) with vk as noise added in the system.


Updated step is represented in equations (7)–(9) where the measurement, covariance, and Kalman gain are updated based on the Kalman gain of equation (9). This updated values will determine the latest or the last known location of the user. This process is computed continually based on the received RSSI measurements.


Particle filtering module
PF represents the density function of estimated position by creating random probabilities that contains weight. This randomly weighted probabilities, particles, will be updated each time new measurements are obtained, continuing the update process into correcting the predicted particles. The most weighted particle in the form of RSSI measurements will determine the estimated position of the user.14,15

The prediction and correction steps are the main iteration steps for continuously estimating state. PF tries to estimate the probability distribution
Then the particle weights will be updated as

Then this weight equation (11) is normalized in order to obtain posterior density function. After several iterations, N, at time t, will be considered as the number of particles such that
Experimental results and analysis
Further experimentation
Further experiments are executed on the engineering building of Tongmyong University. Figure 3 shows the selected experimental environment for the indoor localization. For further experimentation, the engineering lobby first floor was used as the test bed. The lobby is an open space environment without any obstacles. A total of 74 RPs were used to construct the FM. Each RP has a dimension of 1 × 1 m space. And the two VAPs were optimally placed in locations that has high correlation with the existing APs. The placement of the three APs and two VAPs is as seen in Figure 3.

Lobby of Tongmyong University engineering building and layout with RPs.
During the data collection phase of the proposed algorithm, two VAPs will be added in the environment equation (2). These two VAPs are actually devices that act as temporary APs and they are used only to simulate AP signal correlation with the other existing APs in the environment. The role of the two temporary devices are to be powered only in this phase of the experiment to collect RSSI data. The FM generated will be composed of three APs with two VAPs, making a total of five APs. The indoor environment was represented by 74 RPs with unique RSSIs. The collected RSSI data will be used to calculate the correlation and regression coefficient.
During the online phase, only the existing APs will be remaining, since the two devices acting as VAPs in the data collection phase is removed. The three existing APs will provide the RSSI data for the mobile user. Once the mobile device of the user picks up the RSSI signal from the three APs, this signal will be used to calculate the VAP value for fingerprinting and will be compared with the FM. Using Euclidean distance, the current location of the mobile user will be estimated by using the least error distance with the RPs. Four scenarios were implemented in the experiments. The first and second scenarios represent the same trajectory path for the mobile user but VAP numbers and placement will be different. Figure 4 shows the first scenario with only one VAP while the second scenario with two VAPs in place.

First and second scenario of the experiments using the same path trajectory but different VAP placement.
In previous experiments, 11 the second scenario showed better results compared to the first scenario. In this case, additional experiments were conducted using the second scenario as the template. Figure 5 shows different trajectories observed by the selected mobile users. The third scenario is based on a straight path to test the effectivity of KF and the fourth scenario represents a circular path.
Third and fourth scenario of the experiments using the same VAP placement of second scenario but different path trajectory.
The results of the four scenarios will be compared and Table 2 shows that the average error distances of the conventional localization algorithm using FM, the localization algorithm using VAP, the previously proposed system of using KF (VAP + KF), and last is the proposed further experimentation using additional PF (VAP + KF + PF). Comparison is made in all scenarios in meters (m) as the unit. First, second, third, and fourth scenarios will be labeled as Scenario 1, 2, 3, and 4, respectively.
Engineering building lobby error distance comparisons.

FM: fingerprint map; VAP: virtual access point; KF: Kalman filter; PF: particle filter.
An error distance of less than 2 m up to 6 m showed in the first scenario of Figure 6 belongs to the VAP + KF + PF. It is the algorithm that exhibits the least average error distance of 3.42 m compared to the previous three algorithms tested. The apparent difference of error distance seen in Figure 6 is due to the addition of only one VAP. FM and VAP have almost the same results since one VAP did not affect much of the location estimation. VAP + KF and VAP + KF + PF have almost 1 m difference.
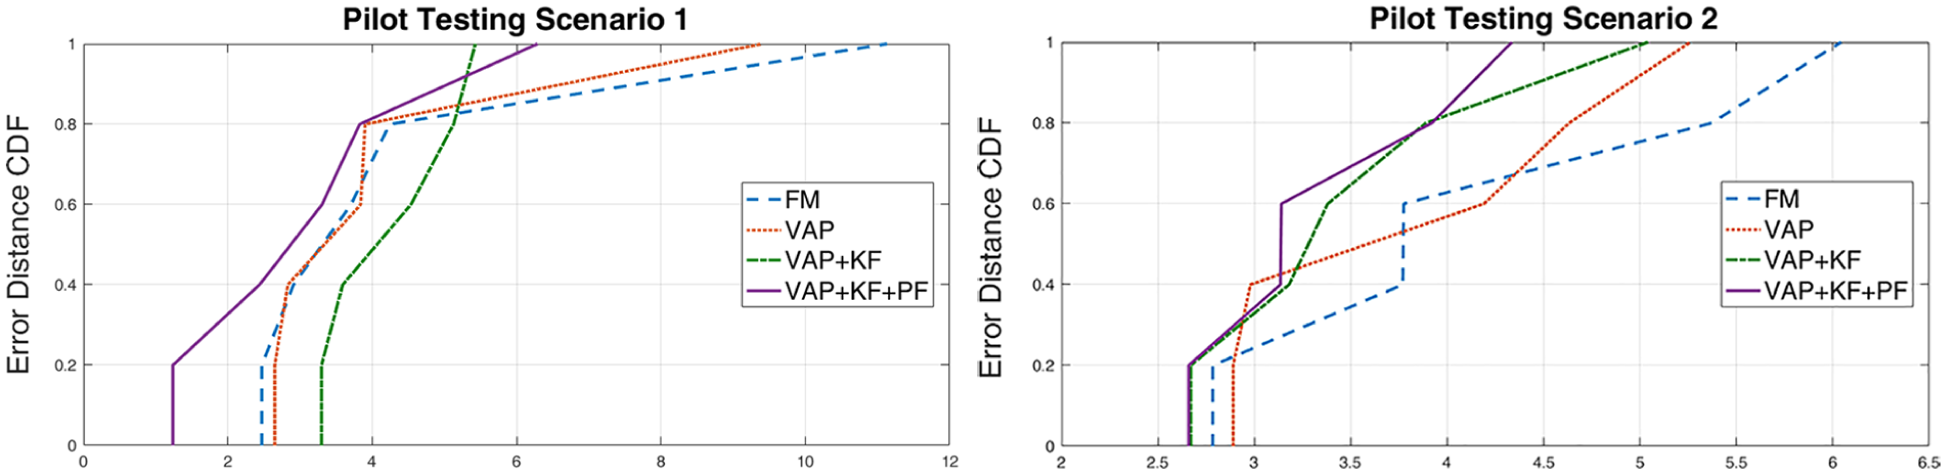
CDF of error distance observed in different RPs during the pilot experiments in the first and second scenario.
In Figure 6, the second scenario has almost identical values for FM with VAP and also VAP + KF with VAP + KF + PF. FM still showed the worst error distance with average value of 4.35 m compared to the other three algorithms but gradual decrease in error distance is seen from FM to VAP + KF + PF in Figure 6. The similarity of VAP + KF with VAP + KF + PF seen in the figure is due to the effect of adding two VAPs in the system. By strategical placement of VAPs symmetrical to existing APs, the results of VAP, VAP + KF, showed a decrease in error distance compared to the first scenario.
Main building experiment comparison
In a past presented paper, 12 experiments were executed on the main building of Tongmyong University. Figure 7 shows another experiment done on the main building with two scenarios. Both scenarios were done within the lobby of the main building. The lobby was chosen because of its wide area and the number of existing APs, which are sufficient for the experiment. Both the scenarios are a lap around the lobby as seen in Figure 8. FM was generated by using 2 × 2 m space for RPs. There are a total of 141 RPs in the main lobby of the building.

Tongmyong university main building lobby layout. First scenario makes a lap around the lobby without much obstacles. Second scenario makes a lap around the lobby by passing through walls and obstacles.

The lobby scene of main building in Tongmyong University used for the experiments.
The area of the test bed is approximately 30 × 30 m with three existing APs from a telecommunication company to provide Internet at the university. The APs used were commercial types of APs but access is restricted to only RSSI and media access control (MAC) addresses, given their SSID. Two VAPs were added in the test bed, labeled “AP01” and “AP02,” positioned in the center of the lobby. The existing APs in the experiments are labeled the “Left,”“Right,” and “Door” APs.
The experiment was done on the main building to compare different kinds of indoor environments. As seen in Figure 7, the main building has many obstacles that will cause loss of sight which is a factor in Wi-Fi-based indoor localization. Two large diamond shaped rooms obstruct the LOS of the Right AP while the hollow circles are large columns in the center of the building. These columns create the most obstruction between all APs and VAPs. To compare the results of the experiment done on the lobby and main building, Table 3 shows the error distance from the main building. In the table, the two experimental scenarios, first and second are labeled as Scenarios 1 and 2, respectively.
Main building error distance comparisons.
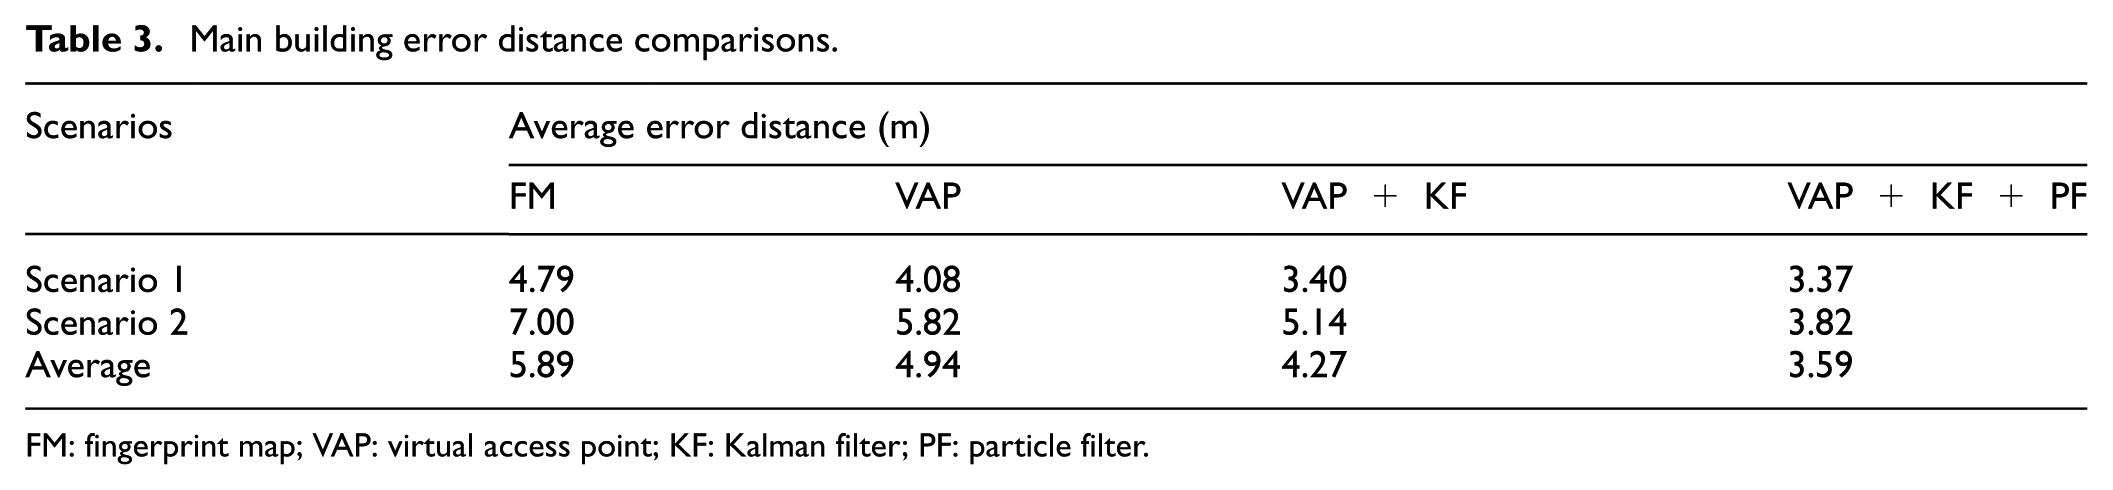
FM: fingerprint map; VAP: virtual access point; KF: Kalman filter; PF: particle filter.
The overall average of the experiments using FM is 6.89 m almost 1.5 m greater than the average of the experiments done on the lobby. Scenario 2’s result was not better than all scenarios in the first building. This shows the effect of many obstructions in the indoor environment. But the experiments on the main building also showed the effectiveness of VAP and the added KF and PF by reducing the overall average error distance to almost 3.5 m. This showed that both filters work well in environments with many obstacles.
To describe the error distances observed in each scenario, Figure 9 shows the differences of FM, VAP, VAP + KF, and VAP + KF + PF in each RPs.

Estimated error distance comparison in each RP on first and second scenario of main building experiments.
System improvement
An improvement for the system was made by optimizing the distance estimation and increasing the scope of the experiment to the first floor of the Engineering Building No. 15. Three existing APs installed by a private Internet provider and two VAPs were used as nodes in making the FM as seen in Figure 10. The overall area is approximately 45 m in length and a 12 m in width and with three entrances. In this experiment, the central entrance and the corridor are the only area mapped with RPs. A total of 40 RPs with unique RSSI are used as the FM database. Each RP are spaced about 2 m from each other. Three APs are labeled AP1, AP2, and AP3 as seen in Figure 10 while two VAPs, namely, VAP1 and VAP2 are used.

Engineering Building No. 15 layout utilizing a new test layout.
The improvement made on this experiment compared to previous main building and further experimentations is the use of an efficient distance estimation formula. The previous experiments adapted the standard Euclidean distance estimation directly on RSSIs which resulted to a lower performance compared to recent studies using Wi-Fi localization.
The model used for distance measurement and estimation is Experimentally Derived Signal Strength Distance Relation Model (EDR) by Türkoral et al. 17 Their proposed model is based on an experimental method as an alternative to the other indoor distance estimation techniques. It is due to hardware specifications that some APs have a certain distance limit for their maximum RSSI to change values. From AP to as much as 2 m away, the maximum RSSI is constantly received before changing. And from about 12 m away, the similar minimum RSSI value is received before being completely out of coverage. 17 Different results can be achieved depending on the indoor environment and the hardware used since the model is based on the actual distance and measured RSSI during the experiments.
After measuring the actual distances and RSSI levels from APs, the mean of the RSSI recordings are plotted with respect to the distances they are measured. Then an exponential curve is fitted to the RSSI distance plot to produce EDR coefficient by using the MATLAB Curve fitting function. The resulting coefficients from curve fitting are a and b and are applied in natural logarithm e to determine real distance

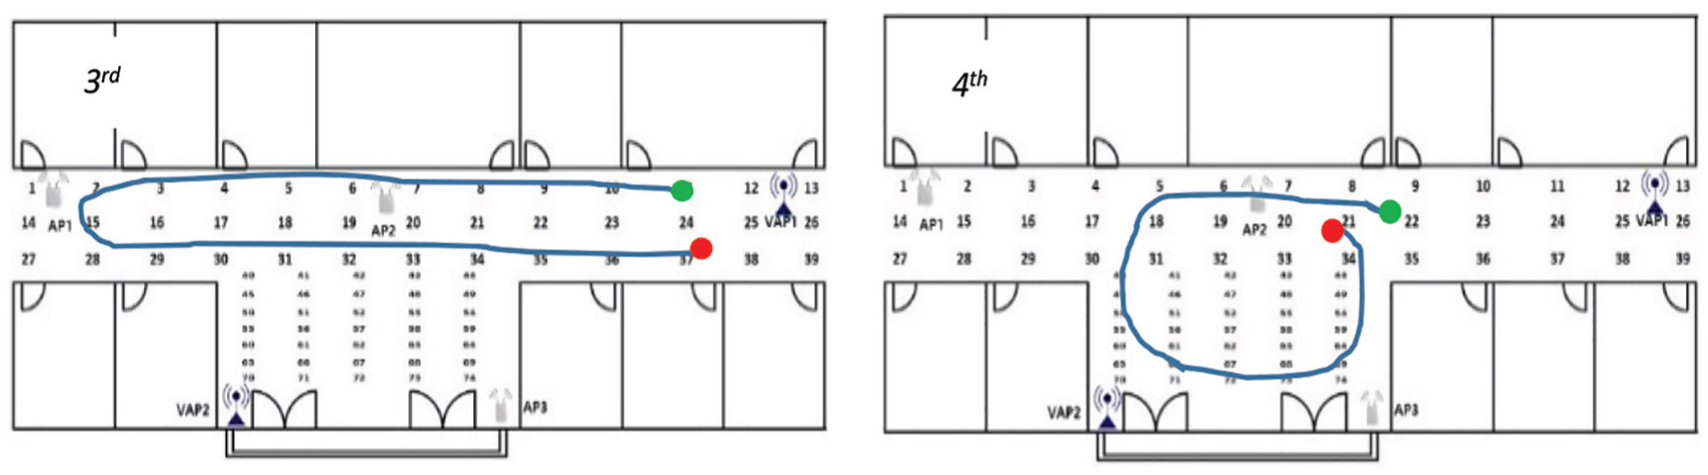
When the relative distances were applied in the FM, three test scenarios were conducted to check the improvement in the system as seen in Figure 11. The first test scenario is using static points for determine the location. Six positions were tested using standard FM, VAP, VAP + KF, and the proposed system model VAP + KF + PF. The second test scenario was a straight trajectory made in the corridor from AP3 toward AP1. The green dot represents the starting location and the red dot sets the stopping point. Finally, the third test scenario requires the tester to walk starting from AP1 then make a turn toward VAP1 and making their way to AP3. For this experiment LG G4 smartphone is used and the distance estimation and location estimation is done in MATLAB after data were collected.

New test scenarios for system improvements. Static location testing (left). A straight line with starting point in green, AP3 toward the red stop point, AP1 (right), and a trajectory with green start point at AP1 passing through the lobby entrance and stopping at red point AP3 (bottom).
Similarly with the main building and further experimentations, the performances in the three scenarios is compared to FM, VAP, VAP + KF, and VAP + KF + PF in a table as seen in Table 4. In comparison, about 2 m improvement is seen in the VAP + KF + PF from 3.18 and 3.59 m in the earlier experiments. This indicates that distance estimation has a significant impact in the localization accuracy of Wi-Fi RSSI fingerprinting compared to applying Euclidean distance estimation directly on the RSSI without considering actual distance measurement, hardware specifications of APs, and indoor environmental differences.
Engineering Building No. 15 first floor error distance comparisons.

FM: fingerprint map; VAP: virtual access point; KF: Kalman filter; PF: particle filter.
Discussion
Prior to making this article, there were experimental results from indoor localization using VAPs to show the effectiveness of the algorithm in the Wi-Fi system by having increased accuracy over traditional fingerprinting method using only Wi-Fi. Another paper was also written about the addition of KF in the indoor localization system using VAP. In that paper, KF made improvements on the RSSI data by reducing noise in the system and increased the performance of the VAP algorithm.
In this article, two experiments were conducted on separate indoor environments. The engineering lobby experiment was done in a lobby with no obstacles while the main building experiment was done in the lobby with walls and obstacles. The aim was to determine the effectivity of VAP and filters in environments with and without obstacles. Previous experiment8,12,18 used KF as the filter and showed better performance compared to not using filters. In this article, PF was the added filter to improve filter performance since it can be used in non-linear calculations. This study showed that using filters together with VAP algorithm can improved indoor localization accuracy. The average results of the proposed algorithm were 3.42 m during the lobby experimentation and 4.49 m during the main building experimentation. The difference of their results is about 1 m, which can be caused by the existing obstacles in the main building. Unlike the main building, the lobby experimentation was a controlled experiment where obstacles were removed to ensure LOS from the APs and the mobile user.
Improvements on distance measurement and estimation also helped in increasing the system performance by about 2 m compared to previous experiments and the proposed system has an average error distance of 1.89 m. This impacts the use of relative distance effect compared to just utilizing RSSI values in estimating location and error distance.
Application of other filters are also encouraged to be applied in VAP, KF, and PF. Further studies can be made in the application of VAPs and filters by using multi-floor indoor environments to test if VAPs can be effective in such scenarios. Since VAPs are dependent on the APs, it will have minimum impact on the behavior of the mobile user which can also be another aim in studying filter application in the mobile user. Another factor to be studied is the effectiveness of the proposed algorithm in a completely non-line-of-sight (NLOS) environment and analyze its performance. Such NLOS environments are different walled rooms and different floor levels in which RSSI signals are difficult to obtain during the offline and online phases of fingerprinting.
Footnotes
Handling Editor: Paolo Barsocchi
Declaration of conflicting interests
The author(s) declared no potential conflicts of interest with respect to the research, authorship, and/or publication of this article.
Funding
The author(s) disclosed receipt of the following financial support for the research, authorship, and/or publication of this article: This work was supported by the National Research Foundation of Korea (NRF) grant funded by the Korea government (MSIT) (No. 2019R1F1A1062670).