
Abstract
According to the characteristics of the underground coal mine roadway structure and disaster environment, this article proposes an underground emergency rescue communication system based on wireless mesh network and its corresponding environmental monitoring subsystem. We design the structures of the emergency rescue communication system and the wireless mesh nodes. The nodes are designed with intrinsic safety features. The work also develops wireless multi-parameter environmental monitoring terminals, and sets up the software platform for the environmental monitoring subsystem. The developed underground coal mine emergency rescue communication system based on wireless mesh network and environmental monitoring subsystem are tested both on the ground and in a real underground roadway environment. Experimental results from the testing show that the signal strength is -45 dBm on average, and the bandwidth attenuation of each hop is less than 10%, the transmission delay after the 11th hop is only 14 ms. The developed emergency rescue communication system is functionally stable, the environmental monitoring subsystem is capable of performing real-time monitoring of various underground environmental parameters, and achieves high accuracy in monitoring.
Keywords
Introduction
Most mine accidents happen in underground coal mines. Due to the complex geological conditions of underground coal mines, after an accident occurs, hazardous factors such as marsh gas, carbon monoxide, water, and fire coexist. This increases the chances of secondary disasters such as explosion, poisoning, suffocation and landslide, making the rescue process extremely dangerous.1,2 In order to ensure the safety and efficiency of the rescue process, rescue workers require detailed real-time knowledge of the various environmental parameters of the downhole in the disaster area. However, after an accident, often the monitoring and communication systems of the mine are disrupted, thus being unable to provide the necessary support to the emergency rescue operators.3,4 Therefore, it becomes necessary to set up temporary underground emergency rescue communication systems (ERCS).
At present, the underground emergency communication systems employed by mine rescue teams in China mainly consist of voice communication systems. The popular systems are sound-powered wired telephones used in disaster areas, the SC2000 wireless telephones imported from South Africa, the KTW2 mine emergency voice communication equipment developed by China using wired AP expansion, the KJT95 voice and short message communication equipment, and the WLX-1 communication equipment using rock and tunnel ultra-low frequency voice technology and software radio technology. 5 Traditional voice communication systems are only capable of transmitting a limited amount of information, and are unable to perform real-time transmission of a variety of rescue information. This limits the capability of rescue teams from assessing the complete situation of the disaster area. In addition, these wired communication systems require physical cables, which lead to short transmission distances, poor portability, and low flexibility. 6
In recent years, several new communication technologies have been developed for use in coal mine emergency rescue operations. Australian and Canadian companies have developed underground ERCS technologies based on through-the-earth communication technology, 7 which uses ultra-low frequency signals that penetrate through the earth and enable ground-to-underground communication at any arbitrary position. However, the wavelength of ultra-low frequency signals is relatively longer, and hence, the required antenna size also becomes relatively larger. Since the underground environment is not suitable for the deployment of large sized antennas, these devices are difficult to deploy. As a result, through-the-earth communication technology is mostly used for one-way communication in the ground-to-underground direction, and is unable to meet the needs of two-way communications needed in emergency rescue scenarios.
In Hargrave et al. 8 and Einicke et al. 9 the authors combine Wi-Fi technology with wired networks to design a WLAN-based broadband communication system, where the high bandwidth can support reliable transmission for various types of data. However, in practical rescue scenarios, rescue workers have to carry a large number of cables to configure the fundamental wired infrastructure required to support the wireless access points. In addition, these cable relays are vulnerable to secondary disasters which can easily damage the infrastructure, leading to poor stability of the network and low efficiency of the rescue operations. Another proposed approach10–12 is the use of a system of underground wireless sensor network based on the Zigbee technology, where a large number of sensor nodes are laid out to monitor the environmental parameters at the accident scene in the coal mine. However, due to the inherent narrow bandwidth of Zigbee sensor network, it is difficult to simultaneously support a variety of data transmission with high quality and networking capacity. This makes it unsuitable to be set up as the backbone of an underground emergency communication network.
At present, the types of wireless communication which supports both high bandwidth and fast networking ability, mainly include Mobile Ad hoc Network (MANET) and wireless mesh network (WMN). MANET does not require an infrastructure network, and adjacent nodes within the network can mutually and autonomously connect to each other. This leads to very high capacities of self-organization, robustness, and stability. 13 A MANET can be used in military battlefields, medical emergency rescues and other special and urgent environments. However, MANETs are mainly used for small-scale networking and the formed network is difficult to integrate with other heterogeneous networks to establish the underground mass communication network needed in coal mines. 14
WMN is an extension of the MANET. As depicted in Figure 1, the major difference between WMN and single-structured MANET is that the nodes of WMN have distinctive layered structures.15–17 The backbone layer of the WMN network is composed of mesh routing nodes, which is the main component of WMN. Once the backbone mesh network is constructed, the position of each routing node is relatively determined, which makes the network topology relatively stable. Multiple antenna and radio frequency (RF) technologies are adopted for the interconnection and network coverage of the nodes, resulting in a wider network bandwidth. Some of the nodes also function as gateways and can be used for the integration of the WMN with the external heterogeneous network.

Layered structure of WMN.
In previous works,18–20 the authors propose a coal mine emergency communication systems based on mesh network. In Song et al., 21 a commercial mesh equipment is setup in the mine, and its applicable performance measures such as the multi-hop transmission capacity and delay in underground environment are studied. In Griffin et al. 22 mesh equipment is deployed in different tunnel spaces, and the propagation model of wireless signals in different underground mine structures such as straight and cornered tunnels, and cross lanes are investigated and tested. In Feng and Qian, 23 multi-RF mesh network routing nodes are designed, in which a 5.8 GHz frequency band is used for returning information transmission from the backbone network, while a 2.4 GHz frequency is used for the node coverage in order to reduce the signal interference issues among nodes. In Zhang et al, 24 a testing WMN for a coal mine is simulated on the NS2 simulation platform and the simulation result shows that the multi-RF multi-channel technology can effectively improve the bandwidth of coal mine backbone mesh network. In Huang et al. 25 applications of omni-directional and directional antennas in underground WMN are studied; the results of the tests indicate that directional antennas can further improve the transmission distance. A large number of studies have demonstrated that the WMN can accommodate the special rescue environment of underground coal mines, providing an effective scheme for building coal mine ERCS.
Therefore, in view of the particularity of underground coal mine disaster environments, in this research, a WMN-based underground ERCS and an environmental monitoring subsystem (EMS) are developed. The developed system is robust and has a flexible arrangement to support the reliable transmission of various kinds of data. The EMS can perform real-time monitoring of the environmental status of underground disaster areas, providing scientific evidence needed for decision-making for both ground command and underground rescue. This has the potential to greatly improve the work efficiency of coal mine emergency rescue operations, and hence avoid the occurrence of secondary accidents during the rescue process. The main contributions are summarized as follows:
We propose an ERCS based on WMN. We design the multi-RF WMN routing nodes with circularly polarized antennas, thus significantly improving the network performance and anti-interference capabilities. All the equipments have passed the intrinsic safety design of China.
Full implementation and experimental verification in a real scenario. Our experiments show that the signal strength between the backbone mesh nodes is −45 dBm on average, the bandwidth of the backbone network after the 11th hop is 13.1 Mbps, and the bandwidth attenuation of each hop is less than 10%, the transmission delay after the 11th hop is only 14 ms, the developed ERCS is functionally stable, and the EMS is capable of performing real-time monitoring of various underground environmental parameters, and achieves high accuracy in monitoring.
The remainder of the paper is organized as follows: in section “Underground Coal Mine ERCS,” the general structure of the underground coal mine ERCS is proposed, and a backbone WMN is designed. In section “Design and implementation of the EMS,” the environmental wireless monitoring terminals and its software for the EMS are developed. In section “System performance tests,” the various functions of this system are verified and validated through experimental tests. The conclusions of our work are summarized in section “Conclusion.”
Underground coal mine ERCS
System structure
As shown in Figure 2, a WMN-based underground ERCS can be divided into three parts 20 : (1) emergency rescue command center on the ground, (2) underground coal mine backbone WMN and (3) underground wireless data terminals.
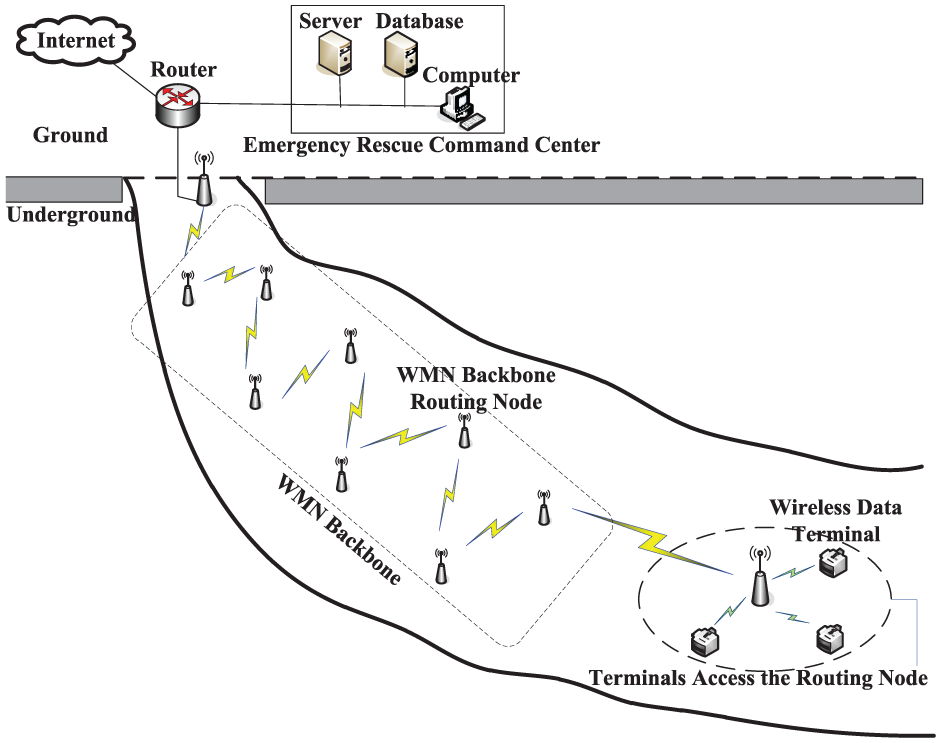
System structure of the underground coal mine ERCS.
The ground emergency rescue command center is mainly composed of rescue command computers laid on the ground. The ground commanders keep in touch with the underground rescuers through the command center computer software, and perform real-time command and dispatch operations. In addition, to facilitate backup and post-mortem analysis of the disaster scene, the command center computers transmit the video, voice, and other environmental monitoring data to external servers in the cloud.
After an accident occurs, an underground coal mine backbone wireless mesh is temporarily setup by the underground rescue operators using a carry-along mesh routing nodes in a “lay and play” fashion. Starting from the command center, the underground rescuers lay the backbone mesh routing nodes in accordance with the planned rescue path. Each node is sequentially laid out and checked for reliable communication with the command center. Once a node’s connection is verified, the next node is laid. In this way, when rescuers arrive at the scene of accident, the construction of the entire backbone WMN is already complete.
The wireless data terminal consists of terminal equipment such as intrinsically safe typed mobile phones for mine use, cameras, and environment monitoring terminals. The wireless data terminal, taken into the underground disaster scene by rescuers, is the major component of the rescue communication system. The generated information is transmitted back to the command center via the backbone WMN, which ensures that the command center has a comprehensive overview of the underground environment and the on-site status of the rescue operation.
Based on the type of variations in the underground wireless data terminals, as depicted in Figure 3, the WMN-based underground ERCS can be divided into three sections with respect to their functions: (a) the video surveillance subsystem, (b) the voice dispatching subsystem, and (c) the EMS. In the video surveillance subsystem, an intrinsically safe camera approved for mine use transmits the underground video data to the ground rescue command center through the backbone WMN. In the voice dispatch subsystem, the underground rescue operators make voice calls to the ground command center via the backbone WMN using mobile phone approved for mine use. The description and details of the function of the EMS and its implementation will be provided in the following sections.

Functional structure of the underground coal mine ERCS.
Design of the backbone WMN
The backbone network determines the communication performance of the whole WMN. 16 In the coal mine environment, branched roadways extending out from the main roadway have long, straight structures. Therefore, the backbone WMN adopts a chain topology. 20 As shown in Figure 2, mine rescue operators place a backbone routing node device regularly at appropriate distances. Each node connects to the other nodes through a 5.8 GHz frequency band. It connects to the wireless data terminals under the node through a 2.4 GHz frequency band. There is less interference in the 5.8 GHz band than in the 2.4 GHz band, and the transmission rate is faster. Therefore, adopting a 5.8 GHz frequency band in the backbone mesh network link ensures the stability of the whole network. At the same time, using the 2.4 GHz frequency band to carry out the network coverage under each routing node solves the problem of channel interference in terminal access and information return, thus significantly improving the network performance.
The intrinsic safety design of the backbone routing equipment should be performed according to the particularity of the coal mine underground environment. Table 1 lists the performance parameters of several typical mesh wireless node products. We can see that the mesh products from the StrixSystems have advantages over other products in terms of fast networking speed, strong capacities of self-healing and scalability, low time delay, and low descending speed on the multi-hop throughput. 26 As a result, in this article, the MWS100-HSX10 wireless mesh nodes from the StrixSystems are used as the routing nodes of the backbone network in the underground emergency rescue system.
The comparison between wireless mesh node products.
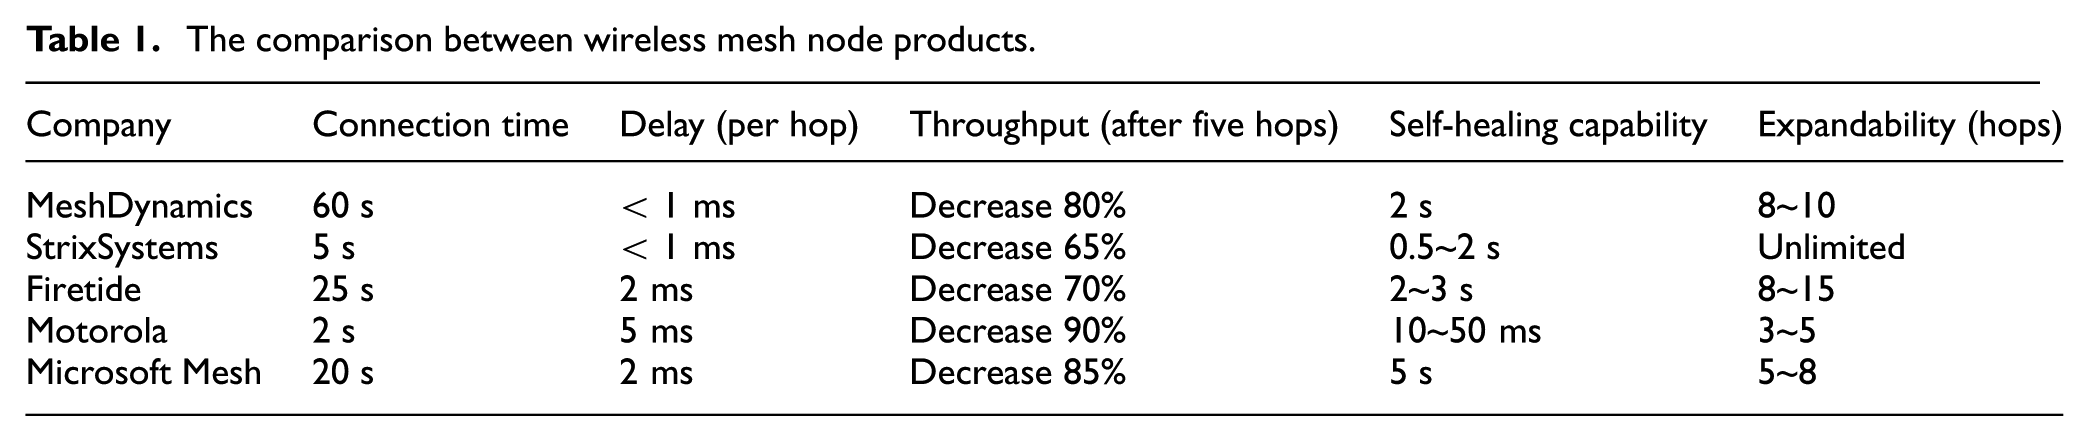
Figure 4 is the photo of the actual product of a MWS100-HSX10 wireless mesh node from StrixSystems. The MWS100-HSX10 can be mainly divided into four modules: (a) a client connect module (CC), (b) a network connect module (NC), (c) an Ethernet access module, and (d) a power module. The CC module adopts a wireless transmission card working at a 2.4 GHz frequency band, which through an external antenna, covers the current region of the mesh network. Through the CC module, the wireless data terminals can access the mesh network. The NC module adopts a panel card for wireless transmission working at a 5.8 GHz frequency band, which connects to the backbone mesh network through an external antenna to complete the function of return data transmission. The Ethernet access module comes with the Strix Manager/One network management software, which can be used to configure and manage the node equipment. The power module allows the user to power the product using a special power supply.
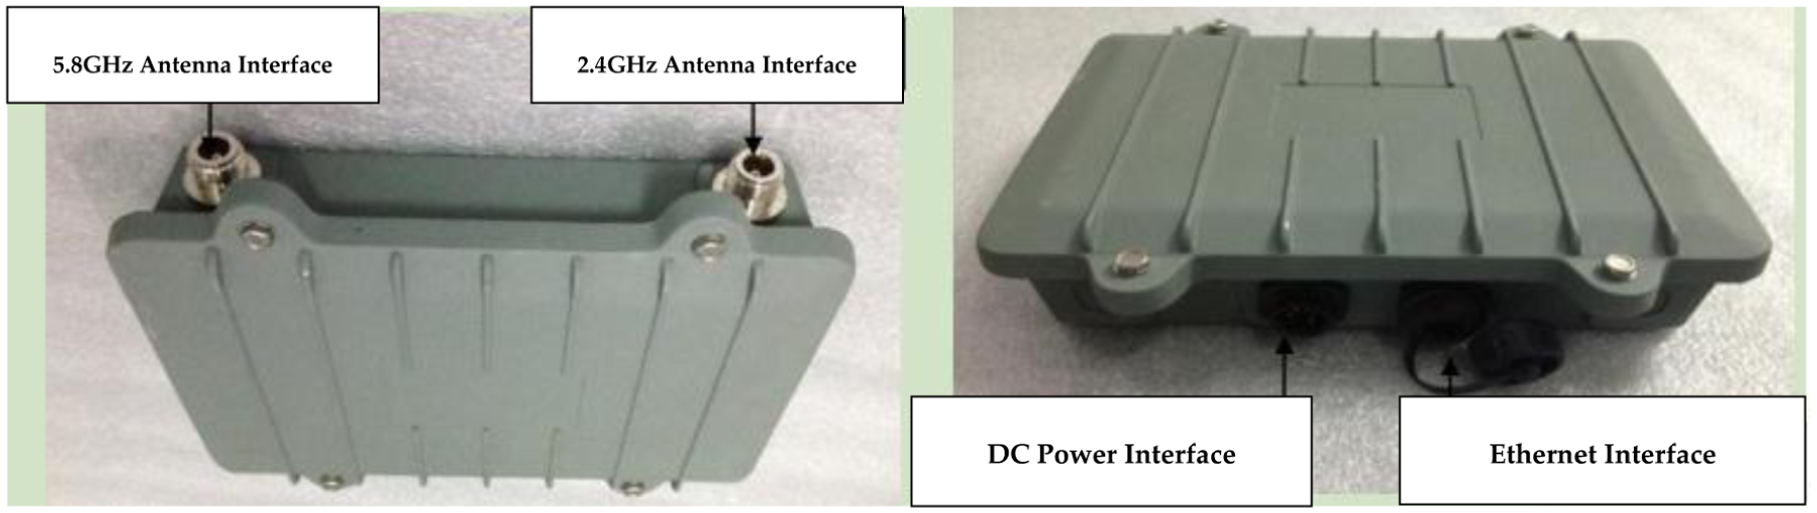
MWS100-HSX10 wireless mesh node.
Both the CC and the NC modules need to connect to the external antenna. Due to the particularity of the underground roadway environment, it is necessary to choose antennas with small size and strong capacity to resist interference. Compared with linearly polarized antennas, circularly polarized micro-strip antennas have special characteristics such as being light weight, having small size, and possessing anti-rain and anti-fog capabilities. They are also resistant to severe vibrations and multipath reflections. 27 At the same time, since the underground roadways are mostly long and straight, directional antennas, which have high anti-interference capabilities under such structures, are capable of transmitting over even further distances. 25 Therefore, the designed node adopts a schematic plan of externally oriented circularly polarized antennas. In subsection “Antenna performance test” the performance comparison of linearly polarized antennas and circularly polarized antennas is discussed.
According to the industrial and national standards of China, equipment put into a mine must pass through intrinsic safety design and test. 28 Figure 5 shows the diagram of the intrinsic safety design and the actual-product photo of the routing nodes in the backbone network. The designed mesh node integrates two MWS100-HSX10 products, which are correspondingly used for the downlink and uplink communications. Two 18 dBi directional circularly polarized antennas are used for backbone network data transmission, and two 13 dBi directional circularly polarized antennas are used for wireless coverage under the mesh nodes. In addition, there are two intrinsically safe power supplies, which can work for eight consecutive hours without interruption after being fully charged. The designed mesh node had to pass multiple types of tests such as structure and shell material test, spark test, shell protection test, alternating test on humidity and heat as well as power frequency voltage withstand test. The final product obtained the qualified explosion proof certificate (Certificate No.CCCMT14.0409)
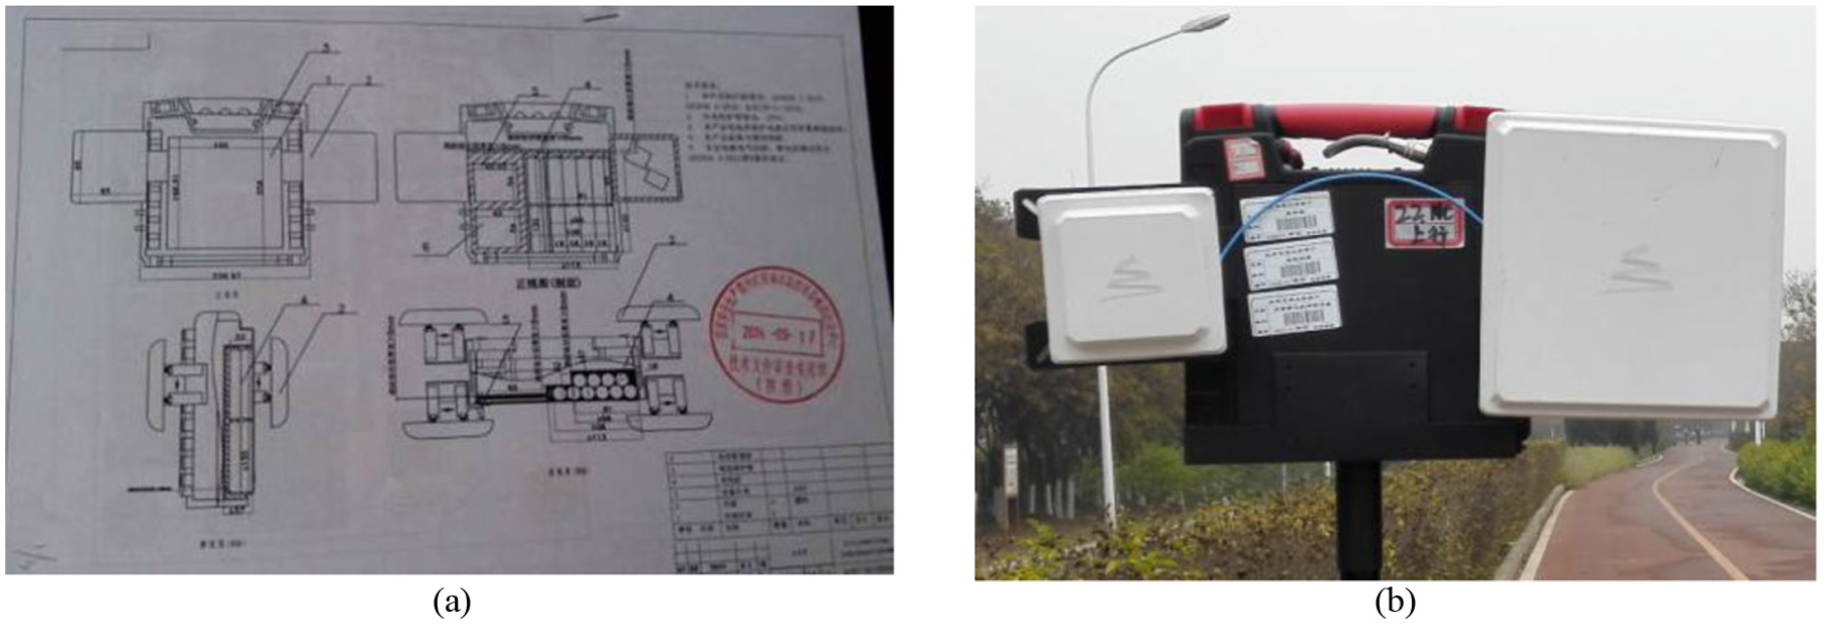
(a) Intrinsic safety design diagram (drawing) and (b) the actual-product photo of the mesh node.
Design and implementation of the EMS
Overall framework
The EMS is an important component of the ERCS used in underground coal mines. The environmental monitoring terminal carried by underground rescue workers continuously performs surveillance of the surrounding environmental parameters. When a certain parameter exceeds the standard limit, the wireless environmental monitoring terminal immediately triggers an alarm, to ensure the safety of the rescuers. The environmental monitoring terminal also continuously sends information regarding the environmental parameters through the backbone WMN to the ground rescue command center. The command center carries out unified dispatching according to the transferred data from the surveillance terminal to ensure a smooth rescue process.
The EMS consists of wireless environmental monitoring terminals and software for the monitoring system. The wireless environmental monitoring terminal can monitor multiple environmental parameters, and can trigger a safety alarm when it detects anomalies in these parameters. The monitoring system software running on the computer in the ground command center receives and displays the real-time data from the underground wireless monitoring terminals. The overall framework of the EMS is shown in Figure 6.

An overall framework of the EMS.
Design of the wireless environmental monitoring terminal
The functional module structure of the wireless environmental monitoring terminal is shown in Figure 7. The multi-parameter sensor module collects eight types of data on environmental parameters, which are sent to the processor module. The processor module filters, amplifies, and A/D converts the signals and then performs computations on these data. The processed data are displayed on the liquid crystal display (LCD), and is also simultaneously compared with the preset safety thresholds. Sound and light alarms are triggered if the safety threshold for any parameter is exceeded. At the same time, the wireless communication module of the monitoring terminal transmits the surveillance data back to the ground command center computer through the backbone WMN.

Function module structure of the wireless environmental monitoring terminal.
Hardware platform
The multi-parameter sensor module of the wireless environmental monitoring terminal can monitor eight types of environmental parameters: methane (CH4), oxygen (O2), carbon monoxide (CO), carbon dioxide (CO2), hydrogen sulfide (H2S), temperature, humidity, and air pressure. Table 2 lists the sensor type and the technical specifications adopted by the multi-parameter sensor module.
The sensor type and the technical specifications.

According to the “Coal Mine Safety Regulations” 29 in China, the parameter thresholds of the wireless environment monitoring terminal are set as follows: when the content of oxygen is lower than 20%, or the content of carbon dioxide is higher than 0.05%, or the content of carbon monoxide is more than 0.0024%, or the content of hydrogen sulfide is higher than 0.0006%, or the content of methane is higher than 0.7% in a unit volume, the wireless environmental monitoring terminal should trigger an alarm.
The processor module uses the industry mainstream ARM9 microprocessor, and has an embedded Linux system as the operating system. The wireless communication module uses the wireless module PM201 which supports the RS485 communication protocol, and accesses the backbone WMN to transmit and receive data. The power module is tested for intrinsic safety in accordance with the general requirements of the rules for the explosion protection of electrical equipment in explosive environment 28 in China.
Design of the wireless communication module
The communication module of the wireless environmental monitoring terminal is connected to the backbone WMN, and transmits the parameters collected by the multi-parameter sensor using a customized RS485 communication protocol. At the same time, it receives the control data from the ground command center computer. The customized RS485 protocol data frame format used by the module is shown in Table 3.
The customized data frame format of the RS485 protocol.

Each terminal has a unique address code. The establishment and removal of communication links is controlled by data frames issued by the computer in the ground command center. The command center computer transmits the communication instructions for the data requests to a unique address code. Once the request is received by a terminal with the specified address, it returns a data packet containing the eight parametric data values. The format of the data packet is shown in Table 3. When the data field of the data frame of the command center is set to 0x01, it represents the data request. The data field of the data frame of the environmental monitoring terminal includes the data type (1 byte) and the monitored parameter value (2 bytes). Wherein, the data type 0x01 represents methane (CH4), 0x02 represents oxygen (O2), 0x03 represents carbon monoxide (CO), 0x04 represents hydrogen sulfide (H2S), 0x05 represents carbon dioxide (CO2), 0x06 represents pressure, 0x07 represents temperature, and 0x08 represents humidity.
Design of the processor software
Once the system boots up and initializes, the processor of the wireless environmental monitoring terminal runs the monitoring program. The monitoring program then starts to listen to the instructions from the command center computer and receives the parametric data collected by the multi-parameter sensor module. The data processing module amplifies and converts the collected data. This data are displayed on the LCD of the surveillance terminal as well as saved in the memory of the registers of the system. The received environmental parameters are also compared with the alarm thresholds, and an alarm is triggered if any of the thresholds is exceeded. When the surveillance program of the environmental monitoring terminal receives the data request instruction from the ground command center computer, it compares the address in the request with the address of the terminal. In case of a match, it will transmit the requested data back according using the customized RS485 protocol. The workflow (operating flowchart) of the software in the processor module is depicted in Figure 8.
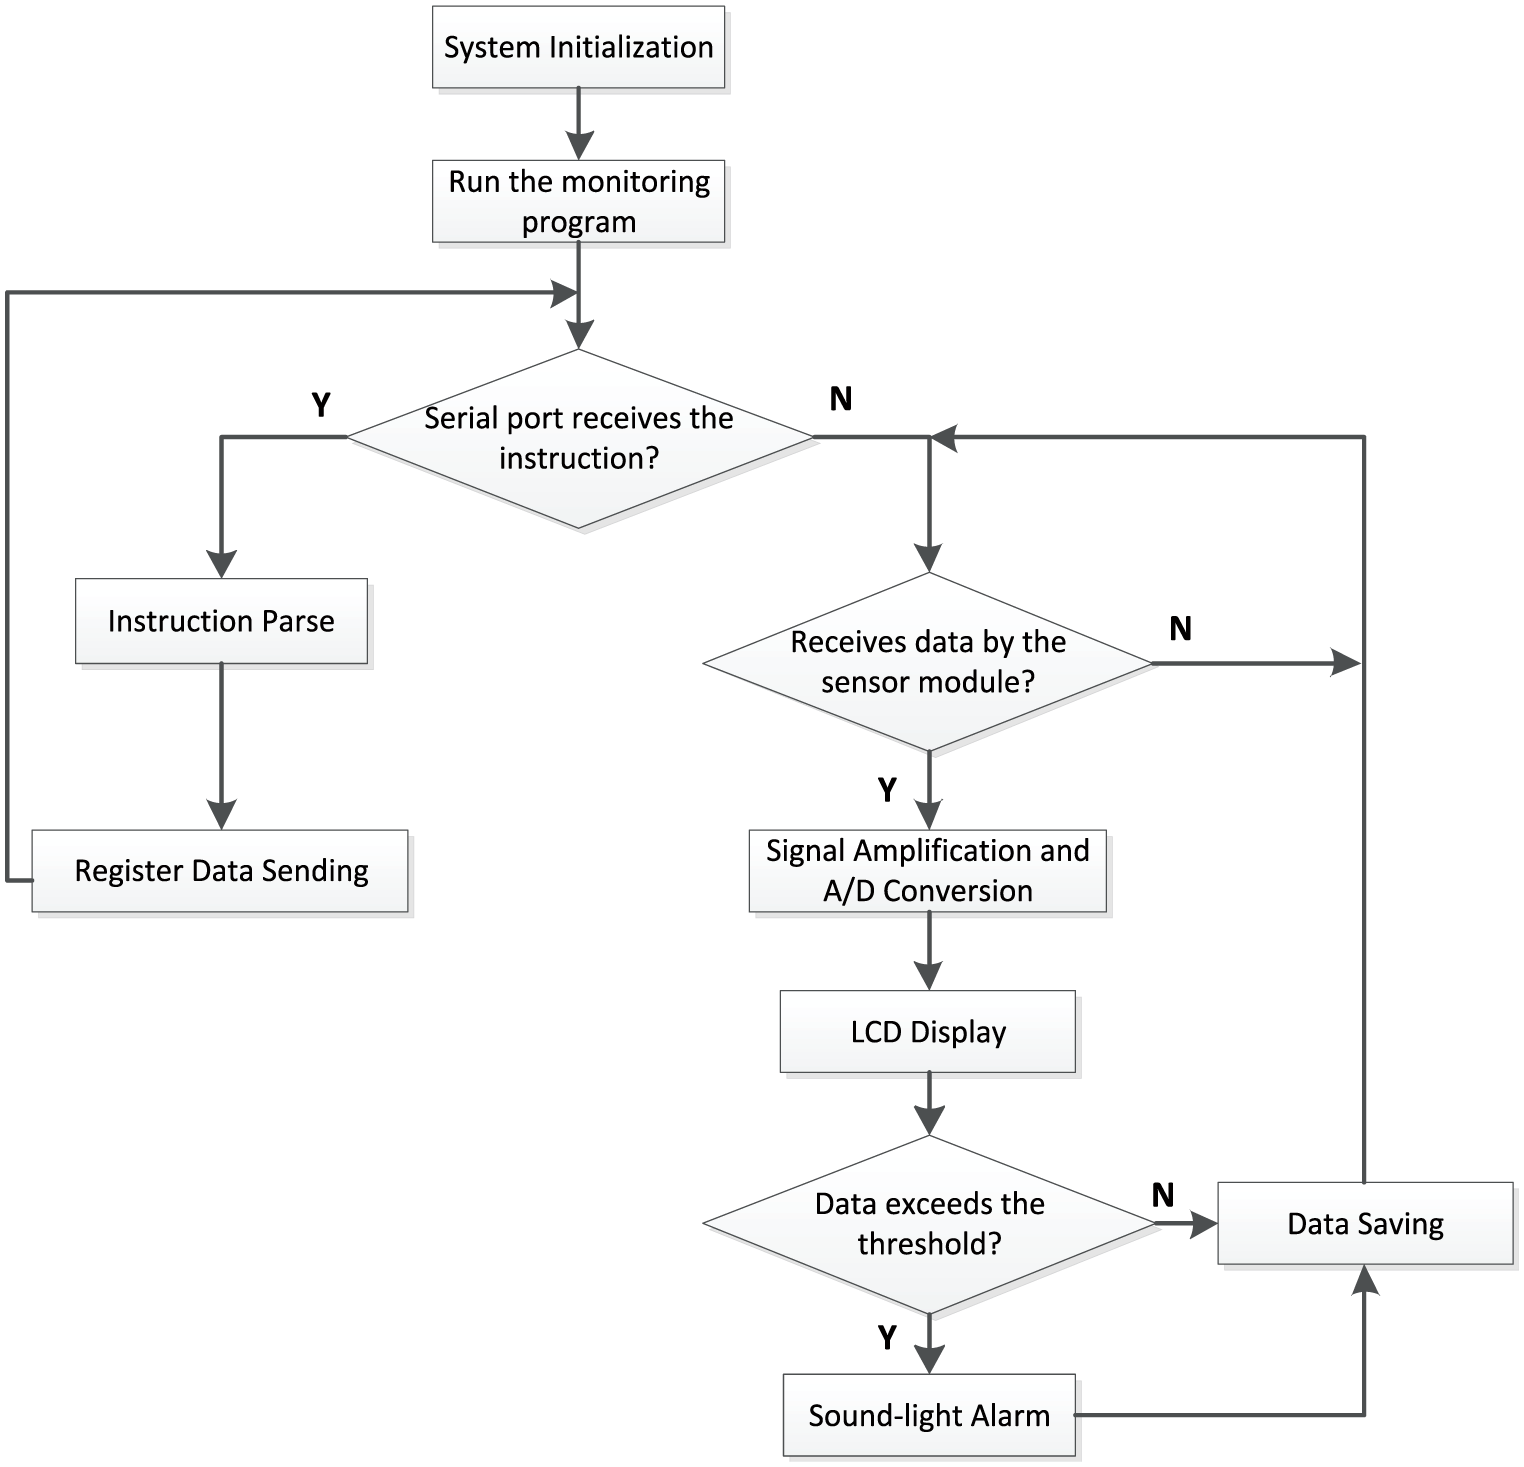
Workflow of the software on the processor module.
Figure 9 shows the actual-product photo of the wireless environmental monitoring terminal with the intrinsic safety design. The wireless environmental monitoring terminal has passed through many tests such as structural and shell material test, spark test, enclosure protection test, alternating humidity heat test, and power frequency voltage endurance test. The product has obtained the qualified explosion proof certificate (Certificate No.CCCMT14.0490)

The actual-product photo of the wireless environmental monitoring terminal.
Design of the monitoring system software
The monitoring system software is installed on the computers of the ground rescue command center. The overall design goal is as follows: a ground rescue command center computer can graphically display the dynamic changes in the multiple parameters of the underground environment in real time; they can set the alarm threshold of the environment parameters; once a parameter is overrun, an alarm is triggered immediately; the software can record, store and backup the monitored environmental parameters in order to facilitate subsequent investigations into underground mine disasters.
The software of the monitoring system is mainly composed of the communication module, the data processing module and the environment parameter visualization module. The overall architecture is illustrated in Figure 10. The communication module exchanges information with the underground wireless environment monitoring terminal, from which it receives data for the various environmental parameters, and forwards them to the data processing module. Finally, the data are displayed on the computers in the ground command center by the environmental parameter visualization module.
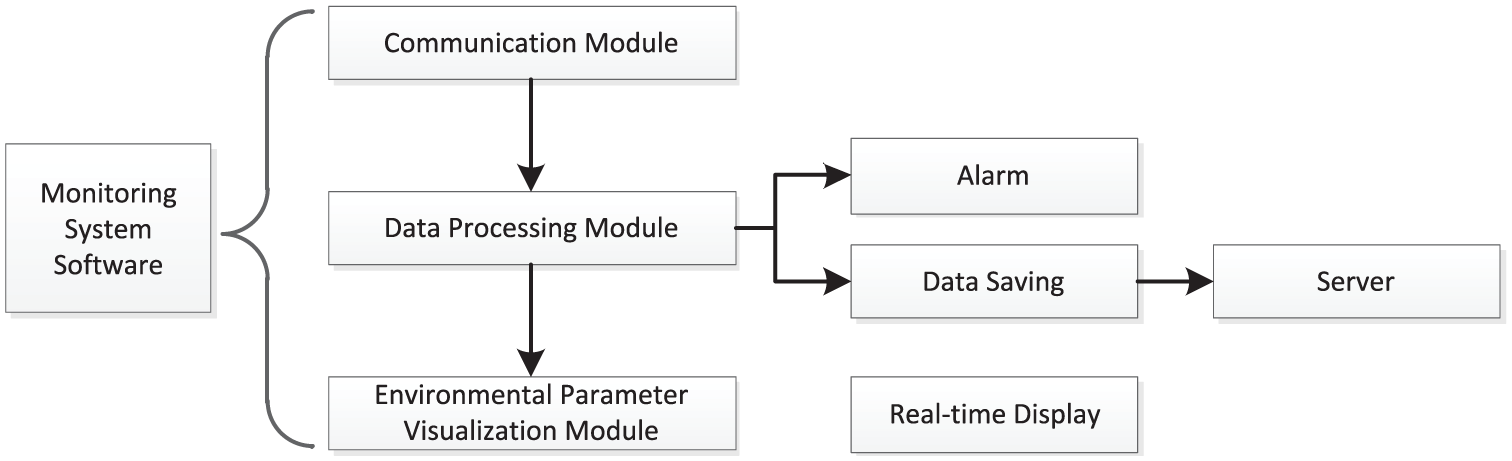
Architecture of the monitoring system software.
Communication module
The communication module of the ground command center computer accesses the backbone WMN through the gateway nodes, and periodically broadcasts data request instructions according to the customized RS485 communication protocol. These requests wake up the environmental monitoring terminal with the specified address, which then uploads the monitored environmental parametric data. The parametric data from the terminal are first received by the buffer area of the serial port, and then after performing reading and filtering, it is sent to the data processing module. The communication module uses the C++programming language to call the CSerialPort serial class of the Microsoft foundation class (MFC) to implement the function of the module. The designed program flowchart of the communication module is depicted in Figure 11.

The design of program flowchart on the communication module.
Data processing module
The data processing module is used for processing and storing the surveillance data from the wireless environmental monitoring terminal, triggering an alarm when the value of the data exceeds the threshold. This threshold is identical to that in the wireless environmental monitoring terminal. After receiving the eight types of environmental parameter data, the communication module of the rescue command center sends the data to the data processing module for processing and storage. From the data frame format in Table 3, we can see that the format of the data returned by the terminal is “FE FE 68 01 03 Data CS 16.” After the data processing module receives these data, it is necessary to first evaluate the length of the data packet and discard it in case of abnormal packet length. The data processing module needs to classify eight types of parametric data according to the categorized type of the parameters. Then these data are converted into the decimal format and forwarded to the environmental parameter visualization module. At the same time, the monitored data are compared with the thresholds, and if the thresholds are exceeded, an alarm is triggered. The data processed by the data processing module are stored immediately to the local hard disk of the command center computer. It is also periodically backed up to the server in the rescue center with a preset transmission cycle. The design flowchart is shown in Figure 12.

Flow chart of the data processing module.
Environmental parameter visualization module
The environmental parameter data are processed by the data processing module and then sent to the environmental parameter visualization module for visualization. This module displays the changes in the underground environmental parameters as real-time dynamic curves. In order to enable ground command personnel to explicitly and comprehensively understand the underground environmental parameters, this module has eight types of parameters designed in the same interface. The function of this parameter visualization module is implemented in the C ++programming language by calling the MFC based CHistogramCtrl open source class. 30 A dynamic curve window is established using the “create” function, and curves with scrolling effects are drawn using the “DrawLine” function. The flow chart of the parameter curve drawing is shown in Figure 13.

Flow chart of the parameter curve drawing.
Since the quantitative level of each parameter data is different in magnitude, in order to make it easier to observe the variation in the parameters, the data of the parameters have been magnified. The main interface of the environmental parameter visualization module is shown in Figure 14.

The main interface of the environment parameter visualization module.
System performance tests
Antenna performance test
In order to select the proper external antenna for the mesh routing nodes of the backbone network, the performances of linearly and circularly polarized antennas are tested and compared. The test results explain why during our design in section “Design of the backbone wireless mesh network” external directional circularly polarized antennas were adopted by the node.
A location on the ground without shelter is selected as the test environment. Two wireless mesh routing nodes, at a distance of 1 km from each other, are connected using the same type of antennas to form a single-hop network. The computers in the rescue center are connected to this network through routers, as shown in Figure 15.

A schematic diagram of the antenna performance test.
The transmission performance of the backbone WMN can be quantified by three parameters: the signal strength, the transmission bandwidth and the transmission time-delay. 31 The transmission bandwidth, the signal strength, and transmission time-delay of the single-hop network are tested by mounting an 18 dBi directional lineally polarized antenna, a 13 dBi directional circularly polarized antenna and an 18 dBi directional circularly polarized antenna, respectively. The transmission bandwidth and the transmission time-delay are determined using the network performance test tool “Iperf,” 32 and the signal strength is obtained by using the self-contained command “get wlnc,” which is part of the command set of the mesh routing node. Table 4 shows the test data for the three experimental trials.
The test data for the antenna performance test.
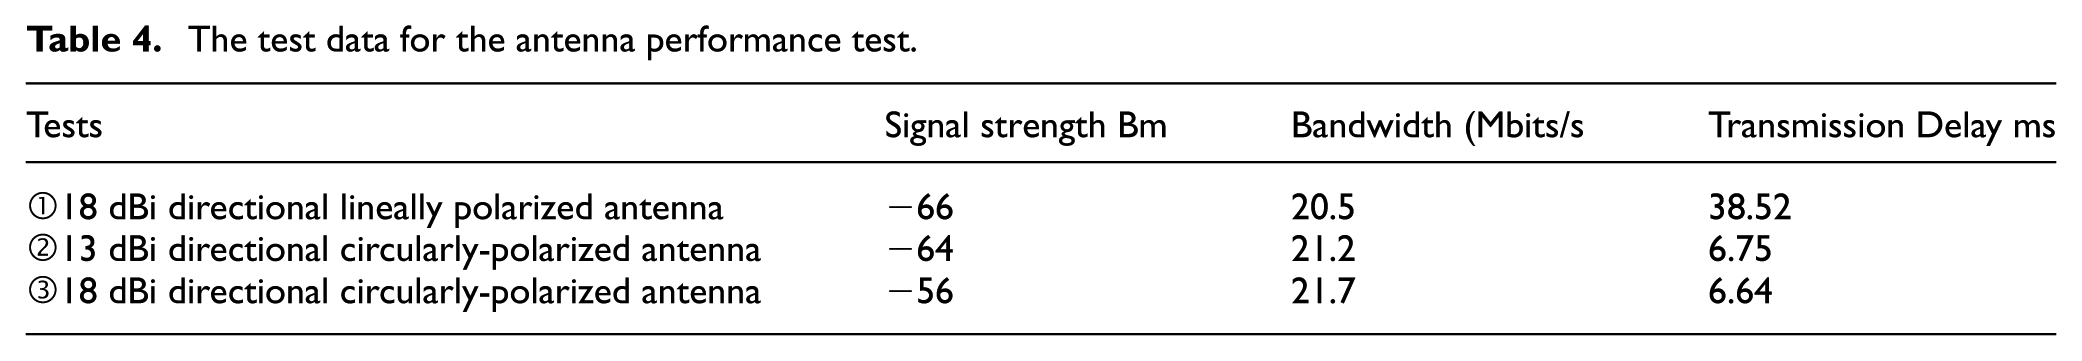
By comparing tests ① and ②, it can be found that even if there is an obvious decrease in the antenna gain (down by 27.78%), all indices still indicate some kind of improvement. Among these, the signal strength increases from -66 dBm to -64 dBm (a 2 dB improvement); the bandwidth increases from 20.5 Mbits/s to 21.2 Mbits/s (a 3.41% increment); and the average time delay reduces from 38.52 to 6.75 ms (an 82.48% reduction). The test results show that the utilization of a linearly polarized antenna is obviously superior to that of a circularly polarized one. Even in case the antenna gain is reduced, the performance of the transmission is still enhanced to a certain extent.
By comparing test ② and test ③, we can observe that when we adopt circularly polarized antennas with the increase of antenna gain, there is a certain level of improvement in all the index terms. Among them, the signal strength increases by 8 dB, the bandwidth increases by 2.36%, and the average time delay reduces by 1.63%. The test results show that the increase in the gain obtained by using the circularly polarized antenna can improve the transmission performance of the network.
Therefore, from the results of these antenna performance tests, for the design of backbone WMN nodes, we choose an 18 dBi directional circularly polarized antenna for the backbone network data return transmission, and a 13 dBi directional circularly polarized antenna for wireless coverage under the mesh node.
Performance testing of the backbone mesh network on the ground
In order to test the communication performance of the backbone mesh nodes on our ERCS, we carried out performance tests on the backbone ground network. The test site was chosen as Grand Canal Forest Park, Tongzhou, Beijing. The test utilized 24 wireless mesh node devices to establish the chain backbone WMN. Due to the variations in the surrounding terrain and environment, the distances between nodes varied. The total length of the wireless link was about 15.1 km, as shown in Figure 16. The computer at the rescue center was connected to the backbone wireless mesh through routers.

Distribution of the backbone mesh nodes for ground testing.
The transmission bandwidth, the signal strength, and the transmission time delay of the 24-hop backbone wireless mesh consisting of 25 nodes were tested in two sets of experiments. The experimental data are shown in Table 5.
The test data for the ground test.
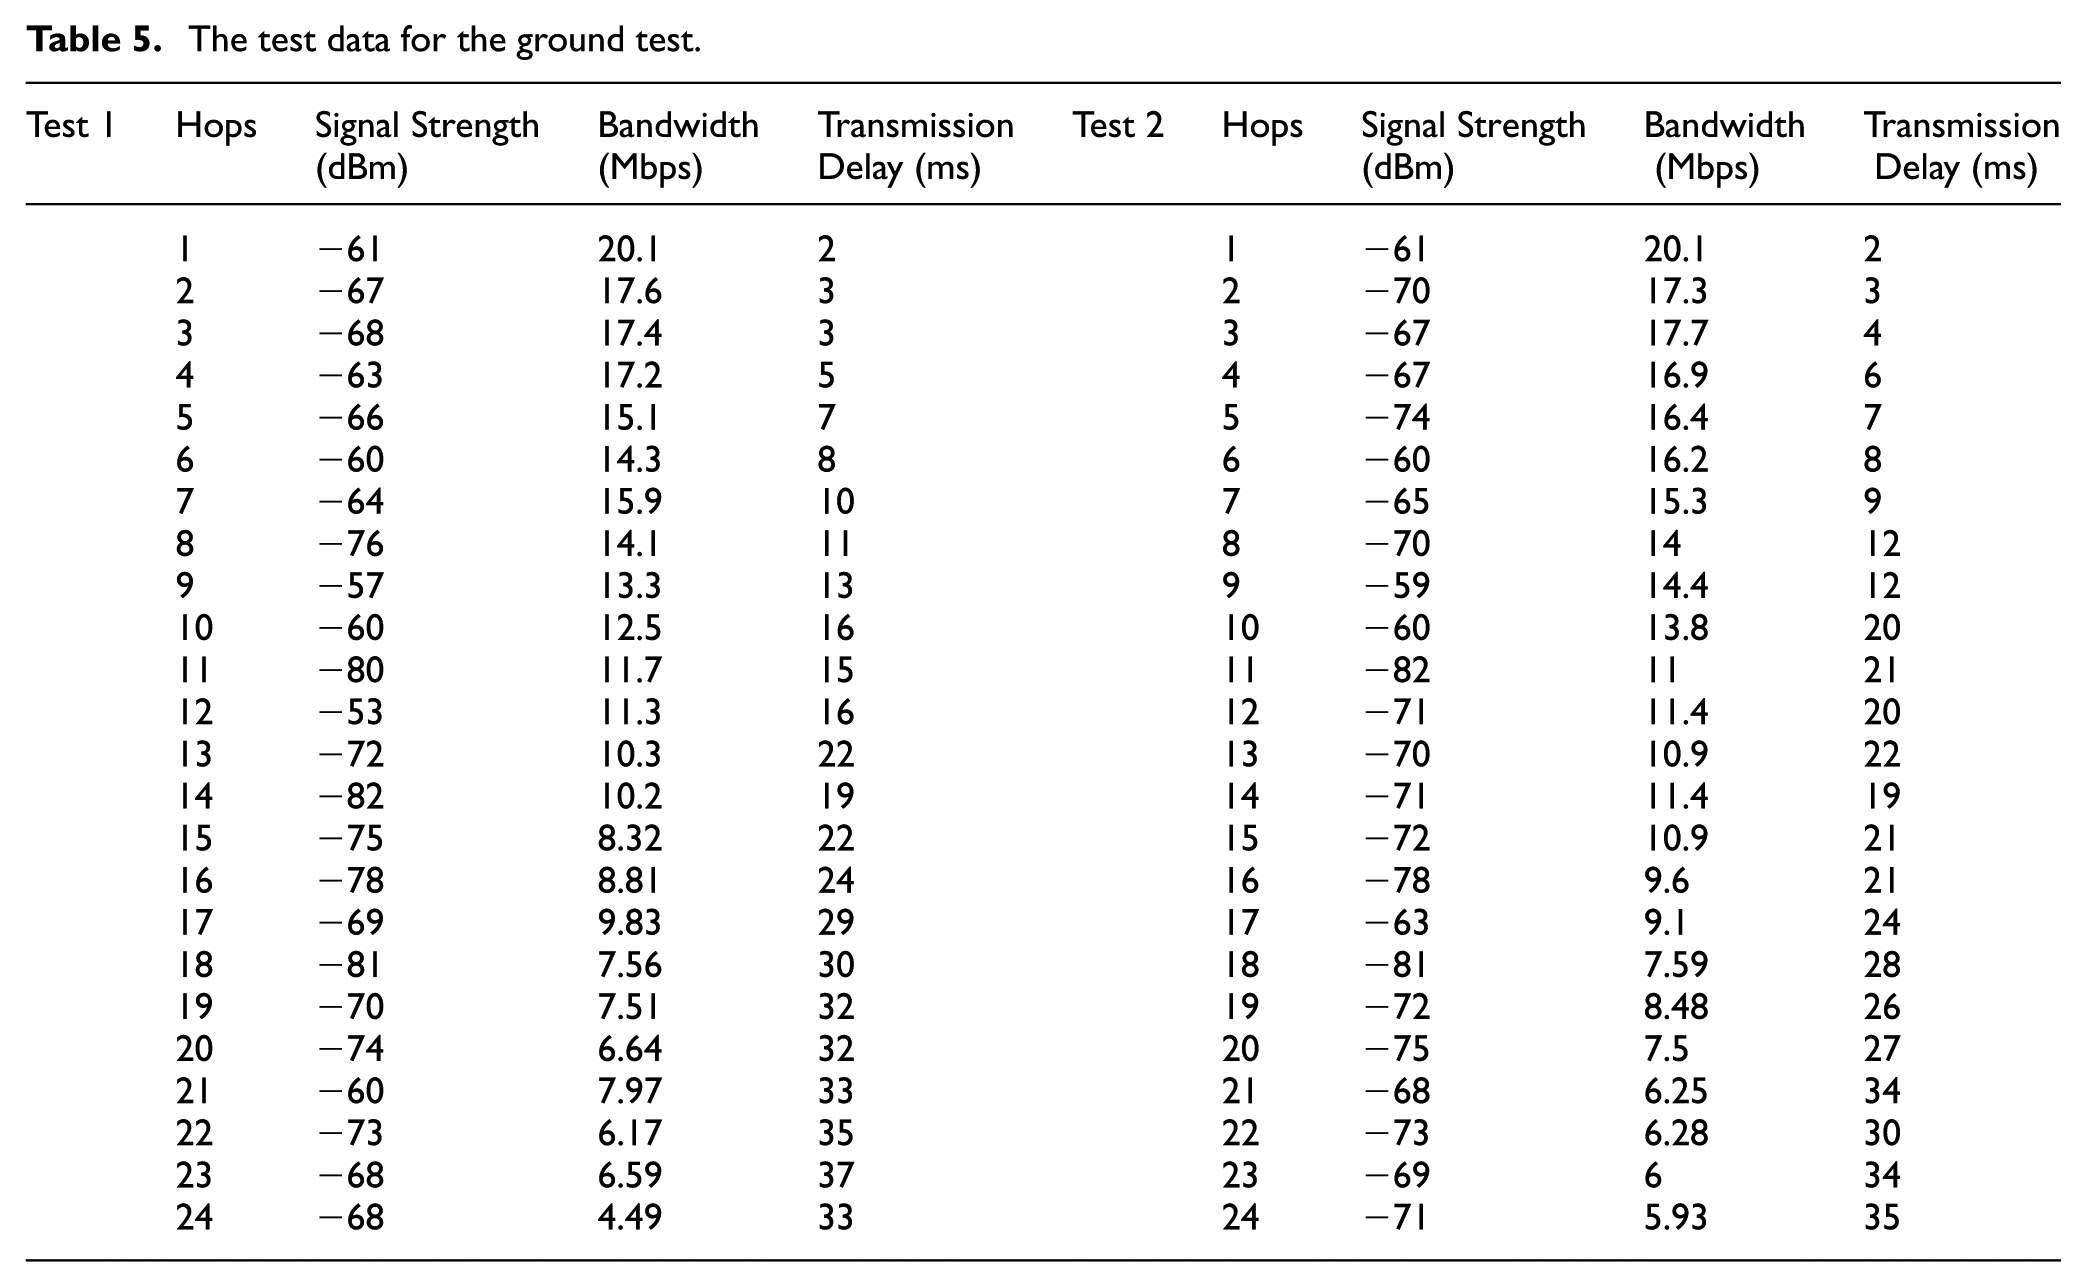
Figure 17(a) shows the signal strength of the nodes for the two tests. The range of the signal strength for the two tests was basically between -55 and -80 dBm, which conforms to the normal range of variations in the signal strength of WMNs. The reason for the fluctuations of the signal strength among nodes was that the distances between adjacent nodes were different, and the surrounding communication environment was also different at different nodes. In the two tests, the signal strength of the 11th and 18th jump were both lower than −80 dBm, which was due to the larger number of surrounding trees and the large amount of traffic flow around them. The reason that the signal strength of the 12th and 14th jump showed relatively large variations in both tests was that the wireless channel was seriously disturbed by moving obstacles (e.g. moving cars).

The performance of the ground test 1 and test 2: (a) The signal strength of the nodes for the two tests, (b) the bandwidth curve diagram of the multi-hop transmission for the two tests, and (c) the transmission delay for the two tests.
Figure 17(b) depicts the bandwidth curve diagram of the multi-hop transmission for the two tests. From the figure, we can see that as the number of hops increased, the overall bandwidth of the two tests shows a slowly decreasing trend. This is consistent with the characteristics of multi-hop bandwidth attenuation in WMNs. However, in both tests, there were cases when the transmission bandwidth increased rather than decreased with the number hops. This was due to the influence of moving obstacles and other factors in the previous hops which led to a registration of a lower bandwidth compared to the actual value. While when testing the next hop, the effect of moving obstacles was eliminated, thus ensuring that the measured bandwidth was consistent with the actual value. Due to the constant change in the environmental factors, the first and the second test data were somewhat different. In the two tests, after the 24th hop, the transmission bandwidth of the backbone network attenuated to 5.7 and 4.49 Mbps, respectively, which still meets the bandwidth requirements for high-quality transmission on multiple types of data.
Delay is one of the important indices to evaluate the performance of network links. The higher the quality of the network link, the lower the time delay is. As shown in Figure 17(c), as the number of hops is increased, the transmission time delays of the two tests show an overall basic tendency of constant increase. The time delay of the transmission after the 24th hop is maintained within 40 ms. However, due to mobile obstacles and changing transmission environment, in both tests there were cases where the variation in amplitude of the transmission time delay suddenly increased. But overall, the variation trends of the three indicators agreed with the expected results, indicating the established backbone WMN was running normally.
Underground performance test
In order to test the communication performance of the ERCS and the monitoring function of the EMS, tests were performed in a coal mine. The test site was selected as the Yushu Bay Coal Mine in Yulin City, Shaanxi Province of China. The test roadway was straight lined; it was about 7 km long, 4 m wide and about 3.9 m high. The test used 12 wireless mesh node devices to build a chained backbone WMN. Each node was separated by about 200 m and the total length of the wireless link was about 1.7 km. The rescue center computer was connected to the backbone WMN through a router, and an environment wireless monitoring terminal was connected to the third node. The network topology is shown in Figure 18. The deployment of the equipment on the test site is shown in Figure 19.

Network topology of the underground test.

Environmental diagram of the underground test.
Performance measurement of the backbone mesh network
The transmission bandwidth, signal strength, and the transmission time delay of the 11-hop backbone wireless mesh composed of 12 nodes were tested and the experimental data are shown in Table 6.
The test data for the underground test.
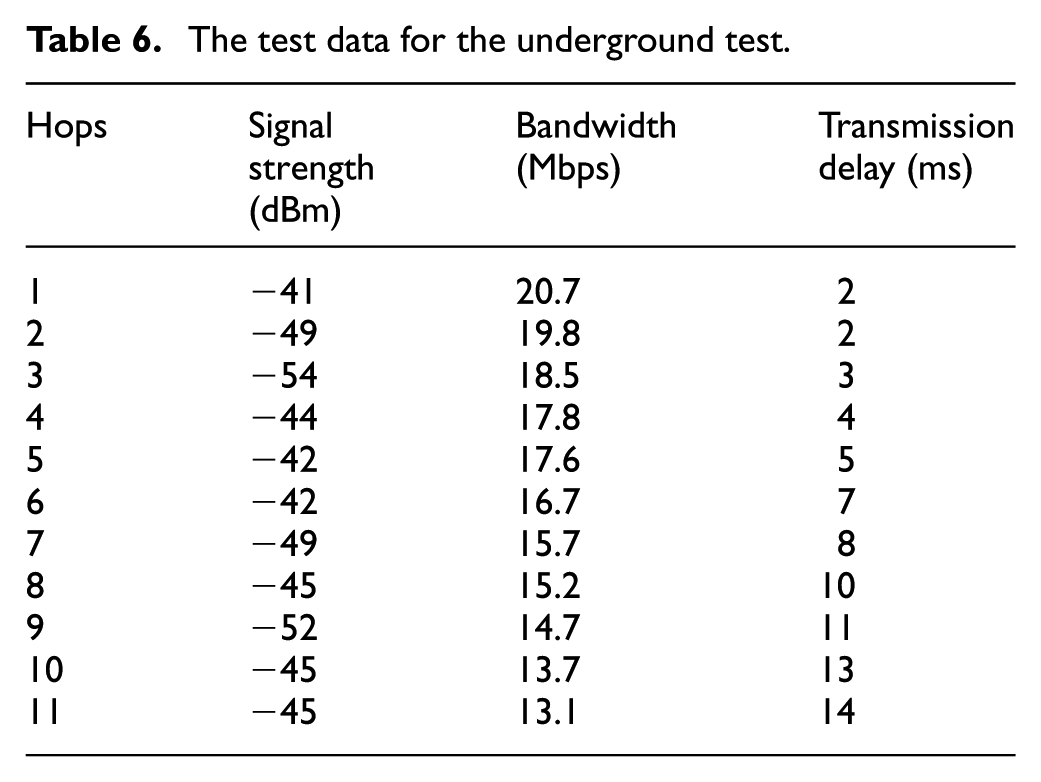
Data of the first 11 hops of the second ground test are compared with that of the underground test, as shown in Figure 20. From these data, we can make the following observations: (a) The signal strength of each node is superior to the ground signal strength. The reason is that the ground distance between the nodes varies from 450 to 950 m, while the distance between the underground nodes is almost uniform at 200 m. Also, the underground tunnel has a simple long straight structure, with less environmental interference and favors the propagation of radio waves. (b) For underground roadway tests, the decrease in the transmission bandwidth is gentler than that for the ground test. In cases when the number of hops in the ground and underground tests are identical, the transmission bandwidth is higher in the underground tests. At the 11th hop, the bandwidth of the ground transmission drops by about 45.3%, while in the underground transmission there is only a decrease of 36.7%. This is because there is extremely little interference in the underground experiments. In the underground test, the bandwidth of the backbone network after the 11th hop is 13.1 Mbps, and the bandwidth attenuation of each hop is less than 10%, which indicates that the transmission performance of the backbone wireless mesh in the underground coal mine is very reliable. (c) Due to less interference in the downhole and the smaller scale of networking, the transmission delay after the 11th hop is only 14 ms. The test results indicate that all indices meet the performance requirements of the ERCS toward the backbone mesh network.

The performance of the mine test and ground test 2: (a) The signal strength of the nodes for the two tests, (b) the bandwidth curve diagram of the multi-hop transmission for the two tests, and (c) the transmission delay for the two tests.
Performance testing of EMS
The instructions for the performance testing of the EMS are as follows: After the EMS software on the computer of rescue command center is started, select the “automatic transmission” mode and set the automatic transmission cycle to 1000 ms. Set the broadcast instruction to “FE FE 68 01 01 01 6B 16,” where “0xFE 0xFE” represents the synchronization head for waking up the receiver; 0 x 68 is the identifier for the start of the data field; the first 0 x 01 stands for the address of the wireless environment monitoring terminal; the second 0 x 01 is the length of the data packet; and the third 0 x 01 is the command to signal the upload of the concentration value from the computer. If the serial port of the computer is open, data exchange between the computer and the environment wireless monitoring terminal will start. In the receiving area, the data sent by the terminal are displayed. The data are of the format “FE FE 68 01 18 01 00 00 02 00 95 03 00 00 04 00 00 05 00 09 06 00 05 07 01 EE 08 00 00 37 16.” Normally, the length of each received data package is 93 bytes, where “0xFE 0xFE” represents invalid data; 0x68 represents the start identifier of the data field, and 0x01 represents the address of the environment wireless monitoring terminal. Starting from 0x18 is the received environmental parametric data, and the last 0x16 represents the end of the received data package. If the environmental parametric data received is valid, 0x01 represents the data for CH4, 0x02 00 95 represents the data for O2, 0x03 00 00 represents the data for CO, 0x04 00 00 represents the data for H2S, 0x05 00 09 represents the data for CO2, 0x06 00 05 represents the data for pressure, 0x07 01 EE represents the data for temperature, and 0x08 00 00 represents the data for humidity. In the main user interface of the software, we can see the real-time data values and the visualization graphs of the eight types of environmental parameters being monitored. Due to extremely low content of methane, carbon monoxide, hydrogen sulfide, and humidity in the test tunnel, the curves representing these contents in the main interface basically have almost no change, and the data for oxygen, carbon dioxide, pressure, and temperature are all within their normal ranges. Figure 21 displays these parameters on the interface of the monitoring software in the command center computer at the beginning of the test.
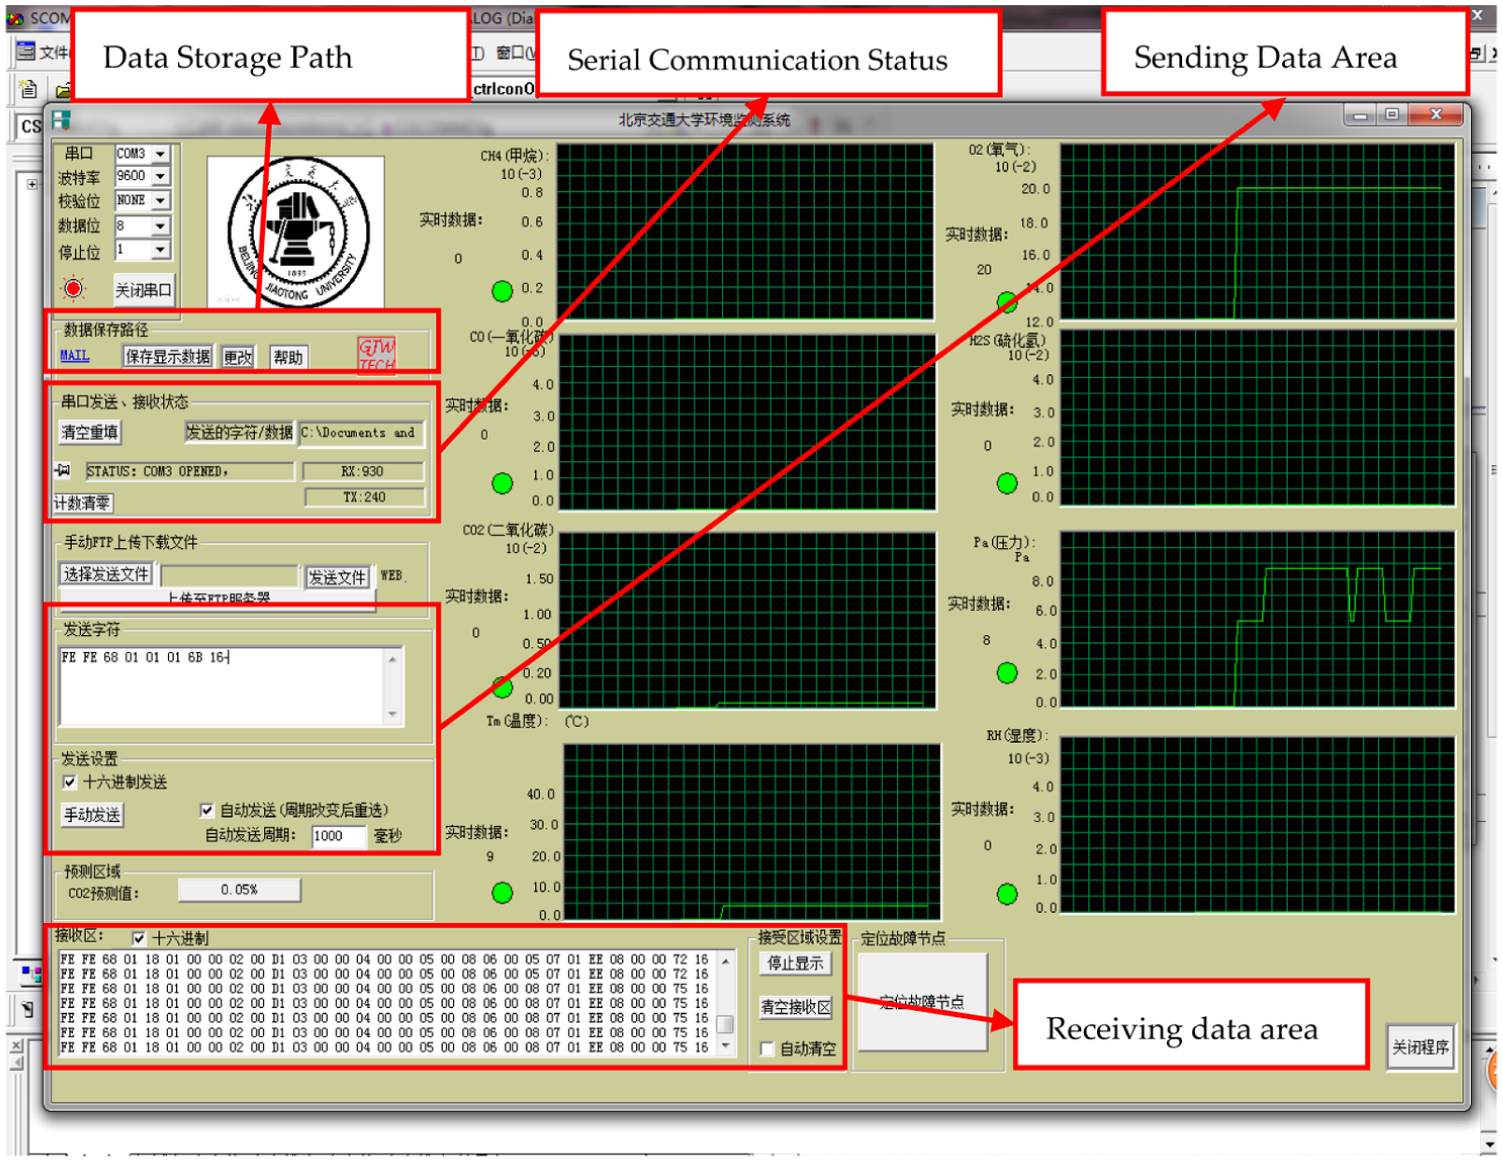
The environmental parameters monitored at the start of the test.
Since we could not recreate a disaster scene, in order to test the alarm function of the environmental monitoring system, we used the process of “blowing.” During this process, we blew carbon dioxide into the carbon dioxide sensing hole of the environmental monitoring terminal in order to change the content of carbon dioxide in the environment. Figure 22 displays the parameter changes in the underground environment wireless monitoring terminal interface when blowing in carbon dioxide into the carbon dioxide sensing hole. The content of carbon dioxide increases from the initial 0.09% to 0.92%, while the oxygen content reduces from 20.9% to 15.3%, indicating that the terminal works normally and the sensors in the environment monitoring subsystem terminal node responds appropriately. This shows that the underground multi-parameter environmental monitoring terminal can perform effective surveillance of multiple underground environmental parameters.

Test data of the wireless environmental monitoring terminal.
From Figure 23, we can see the main interface of the EMS. As the blowing time grows, the content of the CO2 blown into the detector gradually increases, and the time-varying curve of the CO2 content in the main interface shows an upward trend. When the CO2 content exceeds the set threshold, the alarm icon of the environmental parameter in the main interface changes to red. Meanwhile, at the lower right corner of the system an alarm window pops up, displaying a prompt which states that “CO2 content has exceeded the threshold.” From Figure 23, we can see that the real-time parameter value of CO2 displayed on the main interface of the EMS is consistent with that displayed on the display screen of the environmental detector terminal.

Main interface of the EMS.
During the running of the EMS, the locally stored test data are uploaded to the remote server once every 2 h. After the test is finished, the path folder of the received data on the server is verified. The data files can be viewed as displayed in Figure 24. There are nine files in the folder, which store the eight types of environmental parameter values and the values of overall data.

Uploaded data received by the server.
During the whole testing process, the system is stable and has a high performance. The performance of the whole subsystem meets the requirements of multi-parameter monitoring in underground environment.
Conclusion
With respect to the features of underground roadway structure and disaster environment, this article proposes an ERCS based on WMN and its corresponding environment monitoring subsystem (EMS). The structure of the underground ERCS is designed, and the hardware for the surveillance terminal and the software for the EMS surveillance are developed. The test results show that the signal strength between the backbone mesh nodes is -45 dBm on average, which fulfills the coverage requirement of ERCS toward the backbone mesh network. The underground multi-parameter environment surveillance terminal is capable of performing effective surveillance of multiple parameters in the underground environment. The main interface of the environment monitoring subsystem is able to perform dynamic visualization of the environmental parameters and provide an alarm prompt when the environmental parameters exceed their preset thresholds.
The backbone and EMS of ERCS are proposed in this article. We plan to design the voice dispatching subsystem and video surveillance subsystem, improving the systematic function of ERCS.
Footnotes
Handling Editor: Pengpeng Chen
Declaration of conflicting interests
The author(s) declared no potential conflicts of interest with respect to the research, authorship, and/or publication of this article.
Funding
The author(s) disclosed receipt of the following financial support for the research, authorship, and/or publication of this article: This work is supported by the Natural Science Foundation of China under Grant (51474015), the Key Projects of National Key Research and Development Program (2016YFC0801806) and the National Science & Technology Pillar Program of China (2013BAK06B03).