
Abstract
In lab or actual engineering, the traditional contact sensors are always destroyed with damage of structures or models, and this leads to the failure of entire dynamic measurement. To deal with this issue, this article proposes a three-dimensional displacement measurement approach based on the parallel stereovision model. This approach combines the efficient large-scale stereo matching algorithm and the digital image correlation approach to obtain three-dimensional displacement of structural vibration response. In this article, the digital image correlation method is employed to match sequential images of left and right cameras, and the efficient large-scale stereo algorithm is used to obtain the disparity between the left and right images at each moment. Based on the parallel stereovision model, the three-dimensional coordinates of the measured point on the structural surface are achieved accordingly. A shaking table test of a three-story frame model under El Centro earthquake is performed in lab. Experimental results indicate that the displacement curves acquired by the linear variable differential transformers and the proposed method agree well, and this testifies the reliability and effectiveness of the presented approach. Only the presented stereovision approach attains the entire displacement curves of structural collapse when the model collapses, and this demonstrates the capability of the presented stereovision approach monitoring structural collapse.
Keywords
Introduction
In the past few years, some destructive earthquakes occurred across the world, leading to the severe casualties and property losses. Therefore, studying on the seismic behavior of structures is especially important, and the common research method is imposing earthquake wave on the structural model. At present, the methods for measuring vibration response mainly consist of the contact measurement method and the non-contact measurement method.
Some contact measurement approaches such as the displacement gauge, the extensometer, and the accelerometer are usually adopted to detect the vibration response of structures. All these approaches require putting sensors on structural surface in advance, and preparing work is fairly complex. In actual application, researchers mainly concern the entire failure process of structure. Nevertheless, in most instances, the contact sensors are frequently destroyed along with structural damage. This means that the measurement of vibration response is failed and the entire deformation data of structural collapse cannot be obtained. 1
In engineering, some non-contact methods such as the laser displacement gauge, Global Positioning System (GPS), and the vision method are frequently employed to detect structural vibration response. 2 Even though a laser displacement gauge has a higher precision, this kind of sensor only measures one point in one direction at a time. GPS is generally adopted to measure structures, and it has the same characteristic as the laser displacement gauge, that is, only inspecting one point at a time. Moreover, these two approaches are quite costly. As we all know, the digital image correlation (DIC) method is a kind of non-contact optical measurement method. The traditional DIC method is initially adopted to acquire the deformation field on structural surface. Nevertheless, the DIC method with a single camera can only measure the in-plane deformation, cannot achieve the out-of-plane deformation, and needs to be perpendicular to the measured surface as much as possible. In addition, the DIC method with a single camera also requires a scale attached on the structural surface for transforming measurement unit. 3 Different from the DIC method with a single camera, the stereovision measurement method which employs two cameras can obtain the three-dimensional (3D) coordinates of the measured point based on the stereovision principle. In recent years, the stereovision measurement method has developed very quickly and attracted much attention. 4 It should be noted that the measurement error of stereovision method is inversely proportional to the square of object distance, and the object distance should be controlled within the magnitude between several hundreds of centimeters and several meters. 5 Therefore, the stereovision method which is used to measure the vibration response of the structural model in lab is feasible. Nevertheless, if the stereovision method is used to measure the entire dynamics response of the actual structure in engineering, then it may be restricted by the measurement range of the stereovision system.
In 2002, Garcia et al. 6 presented a combined temporal tracking and stereo-correlation technique to measure the 3D displacements of sheet metal during the stamping process. During the stereo matching process, the lens distortion and rectification were taken into account in the correlation function. In 2009, Vasseur et al. 7 employed two charge-coupled device (CCD) cameras to record the complete strain field in concrete versus carbon fiber–reinforced polymer (CFRP). It is noted that the measured zone of the proposed method is needed to be small enough to obtain adequate resolution for the strain field in the CFRP. In 2012, Michael et al. 8 adopted a 3D DIC system to measure the deformation field of a precast–prestressed hybrid concrete shear wall. Before test, the mesh was required to be plotted on the model surface. However, the uniqueness of any grid intersection cannot be ensured, so the mismatching of zone had occurred when the DIC method was adopted to accomplish the stereo matching and sequence matching of the left and right image sequences. In 2015, Lin et al. 9 proposed a computer vision technique for debris flow detection which was feature based that can be used to construct a debris flow event warning system. In the same year, Shan et al. 10 presented a stereovision measurement approach combined with the image processing algorithm of circular target to measure the vibration response of a stayed-cable model. The edge detection, center location, and feature matching algorithm of circular target was researched, and the structural vibration response can be attained by tracking the 3D coordinates of circular targets with Kalman filtering. In 2016, Ye et al.11,12 proposed three kinds of image processing algorithms for structural dynamic displacement measurement, that is, the grayscale pattern matching (GPM) algorithm, the color pattern matching (CPM) algorithm, and the mean shift tracking (MST) algorithm. A vision-based system programmed with the three image processing algorithms was developed for structural dynamic displacement measurement.
The abovementioned stereovision methods which were used to measure structural vibration response mainly focused on 3D DIC approaches themselves or image processing algorithm. From the above research, if the 3D DIC method is used to obtain the strain or displacement field of a structural surface, the measured zone on the structural surface must be small enough to obtain adequate image resolution. However, the geometry size of a structural model or a component is usually very large in civil engineering. Sometimes, it is not necessary to measure the full field deformation; only some deformations on the limited positions of structural surface require to be acquired. Aimed at this requirement, a parallel stereovision method is proposed to measure the 3D displacements on the limited positions of structural surface in this article. Different from the above 3D DIC methods, spraying some tiny speckles or plotting girds on the structural surface is not adopted in this article. Only some circular targets are pasted on the model surface to measure structural vibration response, and the preparing work becomes easier. On the basis of the parallel stereovision model, a parallel stereovision measurement approach which combines the efficient large-scale stereo (ELAS) matching algorithm and the DIC method is proposed in this article. In this study, sequence matching is achieved by the DIC method, and stereovision matching of the left and right images is accomplished by the ELAS algorithm. To testify the effectiveness of the proposed approach, a collapse measurement test of a three-story model subjected to El Centro earthquake is conducted in lab.
3D displacement measurement method based on the parallel stereovision model
Principle of parallel stereovision model
The parallel stereovision model is the simplest and most typical binocular stereovision model, and this model can calculate the 3D coordinates of the measured point based on the principle of disparity.
13
As shown in Figure 1, assume that the imaging planes of two cameras are located in the same plane, and two cameras simultaneously observe the same point P in space. The image coordinates of point P in the left and right camera systems are

Parallel stereovision model.
Assume that the 3D coordinates of point P in the left camera coordinate system are

where B is the baseline distance and f is the focal length. In this study, B and f can be acquired by epipolar rectification. 13
Actually, the optical axes of the left and right cameras are not parallel when the stereovision measurement system is used to take pictures. In most cases, two cameras of the stereovision system are placed in the general stereovision model. However, a parallel stereovision model is selected to compute the 3D coordinates of the measured point on the structural surface in this article. Therefore, a transformation from the general stereovision model into the parallel stereovision model needs to be first conducted. This process is exactly the epipolar rectification as shown in Figure 2. The objective of epipolar rectification is to decrease the match dimension from the two-dimensional (2D) plane into one-dimensional (1D) straight line. 15 This transformation can greatly reduce the searching scope, simplify the matching process, save running time, and improve matching precision. Based on this consideration, the parallel stereovision model is chosen to calculate the 3D coordinates of the measured point on the structural surface in this article.

Principle of epipolar rectification.
The epipolar rectification can change the perspective transformation matrices of the original left and right cameras into the new matrices of perspective transformation, which makes the re-aligning epipolar lines of the stereo image pairs horizontal and collinear. It should be noted that the intrinsic and extrinsic parameters of two cameras are initially obtained by Zhang’s
16
calibration method when two cameras are placed in the general stereovision model. Then, the effective focal lengths
Calculation of 3D displacement
As can be seen from equation (1), if B, f, and Disparity are all known, calculating the 3D coordinates of point P becomes easy. As a result, the displacement of the structural vibration response can be gained by computing a set of 3D coordinates of the measured point. As shown in Figure 3, the DIC method is used to track the measured point in the left and right image sequences, and the ELAS algorithm is applied to obtain the disparity of the measured point in the left and right images at each moment. According to equation (1), the 3D coordinates of the measured point at each moment can be obtained, and the flowchart of the proposed method is shown in Figure 4.

Schematic diagram of 3D matching.

Flowchart of the parallel stereovision measurement method.
In this study, the 3D coordinates of the measured point at initial time

Image matching
It is noted that the main problem of 3D displacement computation is how to identify the same measured point on the left and right image sequences. 13 In this study, the stereovision matching of the left and right images is accomplished by the ELAS algorithm, 18 and the sequence matching is achieved by the DIC method.
Stereovision matching
According to the above analysis, the disparity of the left and right images of the structural surface must be first obtained. In essence, the DIC method is a kind of area matching algorithm. The DIC method can calculate the maximum correlation coefficient of images through area matching and cannot obtain the disparity value. Therefore, the ELAS matching algorithm is selected to execute stereo matching for acquiring the disparity of the left and right images at each moment. 18
The ELAS algorithm can execute interpolation of the disparity and acquire the dense disparity map of high-resolution images. This algorithm builds a priori on the disparities by forming a triangulation on a set of support points which can be robustly matched, reducing the matching ambiguities of the remaining points. 19 This allows for efficient exploitation of the disparity search space, yielding accurate dense reconstruction without conducting global optimization. In addition, the ELAS algorithm determines the disparity range and can be easily parallelized. Based on this characteristic, the parallel stereovision model is chosen to calculate the 3D coordinates of the measured point in this study. The detailed process of ELAS algorithm which is used to calculate disparity is described as follows.
First, a lot of methods can be used to obtain matching support points owing to their texture.19–21 It can be found that matching support points on a regular grid using the l distance between vectors constituted by concatenating the horizontal and vertical Sobel filter responses of 9 × 9 pixel windows to be both efficient and effective. In this study, Sobel masks with the size of 3 × 3 and a grid with the fixed step size of 5 pixels are chosen to obtain the supported points. A large disparity search range of half the input image width is adopted for applying no restrictions to the disparities, and the image coordinates of the support points are used to create a 2D mesh by Delaunay triangulation.
Then, the probabilistic generative model can be given by a reference image and some support points, which can be used to take samples from the other image.
More specifically, assume that

Graphical model of ELAS algorithm.
Supposing that the observations

where
Especially, the prior of the left image is taken to be proportional to the combination of a Gaussian distribution and a uniform distribution 18
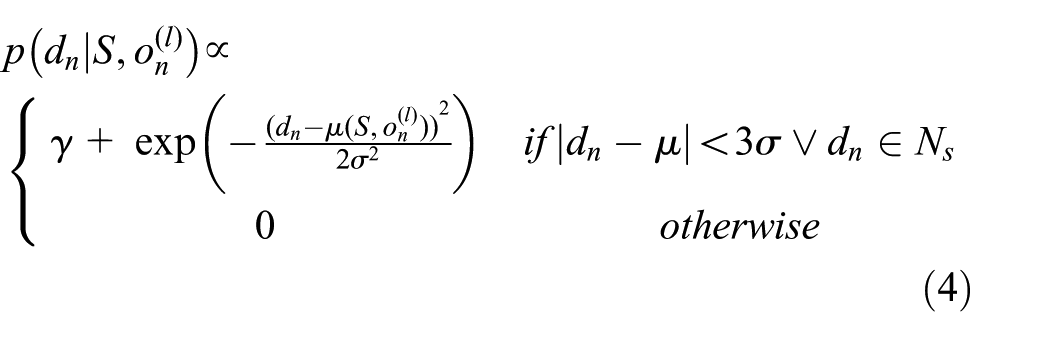
where
When the disparities which are larger than
The image likelihood of the left and right images as a constrained Laplace distribution is described by

where
Therefore, a generative probabilistic model can be used to take samples. When the support points and an observation in the left image are all known, samples from the corresponding observation in the right image are obtained as follows: (1) given S and
Finally, we need to estimate the disparity map of the given left and right images, and the maximum a posteriori (MAP) estimation is adopted to calculate the disparities

where

From equation (5), there exists only one observation with non-zero probability for each

where
It is noted that from the definition of the image likelihood, the energy function
According to the calculation process of ELAS algorithm, the operation flowchart of ELAS algorithm is shown in Figure 6. As illustrated in Figure 7(a), an urban image 22 is utilized to acquire the disparity map by ELAS algorithm. The calculation result of the disparity map is shown in Figure 7(b), and the reconstructed result shows that the picture is accurately estimated by ELAS algorithm. For a laptop, it takes about 0.6 s to reconstruct the disparity map of the 1008 × 294 pixel image. The type of laptop is ASUS X81Se, the operating system is the 32-bit version of Windows 7, and the CPU is 2.0 GHz. Therefore, we can infer that it may need about 2 s to rebuild the disparity map of the 1000 × 1000 pixel image pairs.

Flowchart of ELAS algorithm.

Reconstructed disparity map: (a) left image and (b) disparity map.
Sequence matching
In this study, the DIC method is used to execute sequence matching of the left and right images. The DIC method can measure displacement or strain of the structural surface before and after deformations.
23
As shown in Figure 8, point P is the reference subset center on the reference image and point Q is the measured point on the reference image.
where

Sketch map of subset deformation of the DIC method.
To obtain deformation of the structural surface, a suitable correlation criterion is required to be selected for image matching before and after deformations. Nowadays, there exist many correlation criteria which can be used to conduct area matching. 24 Among them, the zero-normalized cross-correlation (ZNCC) operator offers the most robust noise proof performance and is insensitive to the offset and linear scale in illumination lighting. Therefore, the ZNCC correlation criterion is chosen to conduct image matching in this study. The equation of ZNCC operator is given as follows
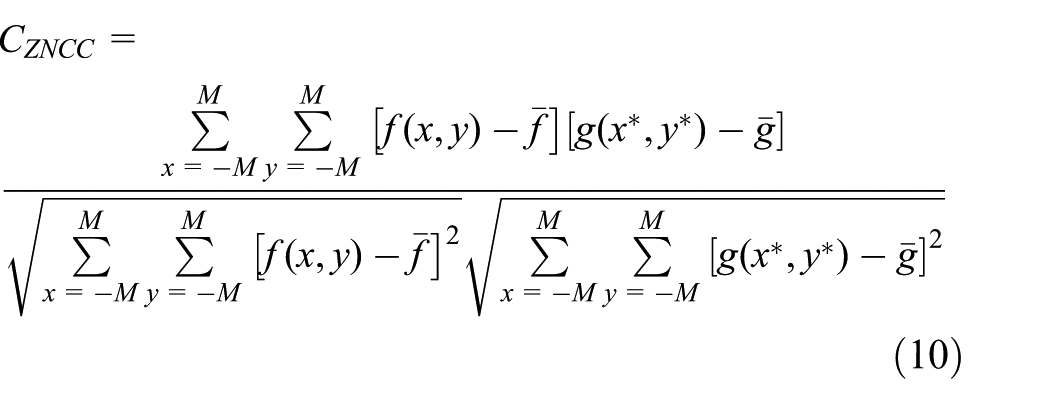
where
The ZNCC operator is utilized to perform the integer pixel search of the DIC method in this study. During the process of integer pixel search, as illustrated in Figure 8, the point
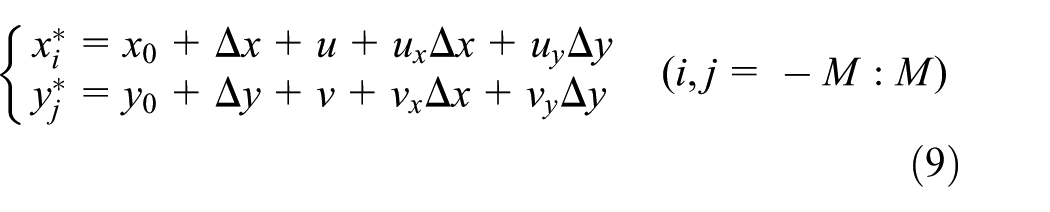
Only the displacement with pixel accuracy is achieved through the above searching, while the actual displacement is in the level of non-integral pixel. To improve the accuracy of the DIC method, Newton–Raphson (NR) algorithm is adopted to calculate the sub-pixel displacement, and the bilinear interpolation algorithm is employed to obtain the gray value of
Finally, the iterative result of the NR algorithm is plugged into equation (9) when the iteration ends, and the sub-pixel image coordinates of point
Collapse measurement test
Experimental setup
As shown in Figure 9, a shaking table test of a three-story frame model, the scaling factor of which is 1/5, is conducted in lab, which is made of C30 concrete. The detailed experimental setting was given in Shan et al. 25 and Li et al. 26 In test, linear variable differential transformers (LVDTs) and the proposed parallel stereovision method are employed to detect the vibration response of the three-story frame model. As shown in Figure 9(b), four LVDTs are fixed on the left wall of each floor. The measurement range and precision of LVDTs are 150.0 and 0.2 mm, respectively. For comparing with the measurement results of LVDTs, some circular targets with a diameter of 12 mm are close to LVDTs and placed on the longitudinal walls of the model. From Figure 9(b), it can be seen that the measurement positions of the two methods are close to each other, and the absolute displacements of the two methods on the same floor can be seen to be approximately equal under the unidirectional earthquake wave. Therefore, there exists no displacement difference caused by the different measurement position, and the measurement results of the two methods can be directly compared.

Experimental setup of a three-story frame model: (a) model size and (b) front photo
In test, the stereovision measurement system (see Figure 9(b)) is kept 1.86 m away from the model to capture image. The view fields of the two cameras are 2.45 m × 2.45 m, and the optical lenses with 5 mm focal length are adopted by the stereovision measurement system. The sampling frequency of the stereovision system is 25 Hz. As illustrated in Figure 10, the stereovision measurement system is constituted by a computer, two CCD cameras, a tripod, and stereovision deformation measurement software. The cameras come with 2/3 in CCDs and can take 1000 × 1000 pixel pictures. The stereovision deformation measurement software is compiled based on the above algorithms, and the software has the functions of collecting images, displaying, saving, analyzing, and outputting results. Before test, Zhang’s algorithm is adopted to calibrate the stereovision measurement system with a checkerboard pattern, and the intrinsic and extrinsic parameters of the stereovision measurement system can be acquired.

Stereovision measurement system.
During test, seven peak accelerations of El Centro earthquake, which are 80, 130, 220, 370, 600, and 1100 gal, are selected as input excitation. To acquire the displacement curves of the model under El Centro earthquake, the stereovision measurement system captures the vibration images of the model. In test, 1100-gal El Centro earthquake is input two times. When 1100-gal El Centro earthquake is input again, the three-story frame model collapses.
Experimental result analysis
Subjecting to 370-gal El Centro earthquake
When subjected to any El Centro earthquake at peak acceleration such as 80, 130, 220, and 370 gal, the shapes of three displacement curves of the model are basically the same, and there is only a tiny difference in amplitude. As a result, only the displacement curves of the model subjected to 370-gal El Centro earthquake are provided in this article.
During test, the displacement curves of three floors are simultaneously obtained by LVDTs and the proposed stereovision method, and the results are shown in Figure 11. It can be seen from Figure 11 that the displacement curves acquired by the two methods agree very well, and this validates the effectiveness of the presented parallel stereovision method.

Displacement curves of the model subjected to 370-gal El Centro earthquake: (a) the first floor, (b) the second floor, and (c) the third floor.
It can be seen from Figure 11 that the model subjected to 370-gal El Centro earthquake stops shaking at nearly 18 s. The peak displacement of the first floor is about 30 mm and the second and the third floor’s displacements reach about 40 mm. The peak displacement from the first floor to the third floor increases gradually. In addition, it is observed that three displacement curves reach their peaks at the same time and have the same shape.
Subjecting to 600-gal El Centro earthquake
Under this condition, 600-gal El Centro earthquake is input to the model and the LVDTs placed on the first and second floors of the model are taken away. Consequently, only LVDTs placed on the ground and third floors of the model are utilized to acquire the slab displacement curve for the third floor. Different from LVDTs, the proposed approach gains each floor’s displacement curve of the model and the experimental results are shown in Figure 12.

Displacement curves of the model subjected to 600-gal El Centro earthquake: (a) the first floor, (b) the second floor, and (c) the third floor.
From Figure 12(c), it is seen that the displacement curve for the third floor obtained by the proposed approach coincides well with that of LVDTs, and the standard deviation of error is less than 0.5 mm. This testifies the reliability and effectiveness of the proposed approach. In contrast to one LVDT which measures one point at a time, the results verify the capability of the presented approach monitoring multipoint displacements simultaneously.
Subjecting to 1100-gal El Centro earthquake
In this condition, the three-story frame model collapses. In test, the LVDTs which are placed on the first and second floors of the model are taken away and the LVDTs placed on the third floor of the model are damaged. Consequently, LVDTs cannot acquire the displacement curve of any floor. In contrast, the entire collapse curve of each floor is obtained by the proposed stereovision approach, and the experimental results are shown in Figure 13.

Displacement curves of the model subjected to 1100-gal El Centro earthquake: (a) the first floor, (b) the second floor, and (c) the third floor.
From Figure 13, the amplitude of the displacement curves increases rapidly when the time is close to 3 s, which verifies that the model is destroyed seriously and starts to collapse. From Figure 13, it is seen that the time of beam–column joints dropping to the ground from the first floor to the third floor increases gradually. This suggests that the model collapse happens from the first floor to the third floor, according to the actual situation. The experimental results testify that the proposed stereovision approach can monitor structural collapse.
Conclusion
On the basis of the parallel stereovision model, a 3D displacement measurement approach is proposed to measure the structural vibration response in this article. The proposed method combines the ELAS algorithm and the DIC method to obtain 3D displacements of the structural vibration response. A shaking table test of a three-story frame model subjected to El Centro earthquake is performed in lab. Both LVDTs and the proposed stereovision approach achieve three displacement curves of the model during the stage of small deformation, and the results suggest that the displacement curves of the presented stereovision approach agree well with those obtained with LVDTs, testifying the effectiveness of the proposed stereovision method. During the collapse stage, only the presented stereovision approach acquires three displacement curves of the model. This demonstrates the capability of the presented approach monitoring the entire collapse of the model. Compared with the traditional technique which measures one point displacement in one direction, the presented parallel stereovision approach can simultaneously measure multipoint displacements and has wide application prospects in monitoring the entire collapse of structures.
Footnotes
Handling Editor: Zhiwei Gao
Declaration of conflicting interests
The author(s) declared no potential conflicts of interest with respect to the research, authorship, and/or publication of this article.
Funding
The author(s) disclosed receipt of the following financial support for the research, authorship, and/or publication of this article: This study was supported by the National Natural Science Foundation of China under Grant No. 51478148, the Natural Science Foundation of Heilongjiang Province under Grant No. E201434, and the Technological Innovation Talent Foundation of Harbin City under Grant No. 2015RAQXJ028.