
Abstract
There are many factors affecting Wi-Fi signal in indoor environment, among which the human body has an important impact. And, its characteristic is related to the user’s orientation. To eliminate positioning errors caused by user’s human body and improve positioning accuracy, this study puts forward an adaptive weighted K-nearest neighbor fingerprint positioning method considering the user’s orientation. First, the orientation fingerprint database model is proposed, which includes the position, orientation, and the sequence of mean received signal strength indicator at each reference point. Second, the fuzzy c-means algorithm is used to cluster orientation fingerprint database taking the hybrid distance of the signal domain and position domain as the clustering feature. Finally, the proposed adaptive algorithm is developed to select K-reference points by matching operation, to remove the reference points with larger signal-domain distances, minimum and maximum coordinate values, and calculate the weighted mean coordinates of the remaining reference points for positioning results. The experimental results show that the average error decreases by 0.7 m, and the root mean square error decreases to about 1.3 m by the proposed technique. And, we conclude that the proposed adaptive weighted K-nearest neighbor fingerprint positioning method can improve positioning accuracy.
Keywords
Introduction
The indoor positioning technology is a research focused on navigation and location-based services (LBS) and has attracted extensive attentions of research institutions, universities, and enterprises. ABI Research estimates that the commercial value of indoor location-based services (ILBS) will be worth up to 10 billion dollars by the end of 2020. 1 Nowadays, there are a large number of applications for ILBS in market. And, researchers have carried out a large number of studies on indoor positioning technologies and developed the corresponding indoor positioning systems, such as the infrared, 2 ultrasonic 3 or sound, 4 radio frequency identity (RFID),5,6 ZigBee, 7 Wi-Fi,8,9 Bluetooth, 10 Micro Electro Mechanical Systems (MEMS) 11 sensors, Ultra-Wideband (UWB), 12 geomagnetic field,13,14 visible light, 15 computer vision, 16 and Pseudolites (PL). 17 However, it is rather challenging to widely spread applications for most indoor positioning systems due to their poor ubiquity, on one hand, positioning systems (e.g. UWB, PL, RFID, ultrasonic, and infrared) that need special equipment are not yet integrated on the mobile terminal, on the other hand, the system using computer vision subjects to the mobile terminal’s slightly short battery life and poor computational capacity. While the wireless local area network has been widely deployed in public places, for example, the airports, shopping malls, hotels, campuses, and all smartphones integrate Wi-Fi modules. Therefore, Wi-Fi has unique advantages in ubiquitous positioning without installing additional equipment.
Indoor environment is usually complex; Wi-Fi signal is influenced by presence of pedestrians, furniture, walls, and environmental changes. The phenomena of refraction, reflection, scattering, and diffraction occur during signal propagation from the transmitter to the receiver. As a result, signals arrived at the receiver are usually superposition effect of multiple signals, which are the line-of-sight (LOS) signals and non-line-of-sight (NLOS) signals under the influence of the multipath effect. Traditional indoor localization relies on the range-based techniques, which require LOS range measurement. Such positioning techniques do not perform well in indoor scenes with obstacles and room partitions. Without assuming LOS and knowing positions of access points (APs), Wi-Fi fingerprint positioning method, a process of signal matching operation, has become the simplest and most effective approach of indoor positioning.
Wi-Fi fingerprint positioning method usually contains two stages: offline stage and online stage. In the offline stage, a site survey is conducted to collect the sequences of received signal strength indicator (RSSI) from all detected APs at many different reference points (RPs) with known positions. Through simple data processing and clustering analysis, the mapping relationship between the spatial position and the signal fingerprint is built at each RP. In the online stage, the collected RSSI sequences are exploited to match with the fingerprint database, to select some neighbors, the set of RPs whose similarity distances are minimum, for estimating the target position.
In recent years, more attention has been paid to improve the positioning accuracy by fusion of Wi-Fi and other sensors,18–21 while the researches on Wi-Fi fingerprint positioning algorithm are relatively fewer. Cinefra 22 studies the impacts of the human body on Wi-Fi RSSI and adopts the vector of mean RSSI in multiple directions to reduce the deviations caused by the human body. Obviously, such method has not effectively explored the variations of RSSIs around the human body. The application of clustering algorithm for Wi-Fi fingerprint positioning could largely narrow search scope down, improving the computational efficiency and avoiding larger positioning errors. Altintas and Serif 23 and Zhou and Fan 24 adopted the K-means and fuzzy c-means (FCM) clustering algorithms to cluster RPs, respectively. Both of them took the signal-domain distance as the clustering feature, causing a not actual distribution of RPs. Li et al. 25 conducted clustering analysis based on the mixing distance, which is the fusion of the signal-domain and position-domain distances, but the clustering results exploited by affinity propagation clustering (APC) algorithm are not consistent with the real indoor situations. With respect to weighted calculation process, Li et al. 26 have found that when K is 5, the positioning results are better by K-nearest neighbor (KNN) or weighted K-nearest neighbor (WKNN) arithmetic. In fact, indoor scene is a complex, dynamic, and changing environment. Assuming the fixed value of K may decrease the positioning accuracy. Shin et al. 27 have proposed an enhanced weighted K-nearest neighbor (EWKNN) technique to filtrate several RPs for calculating weighted coordinates, but it ignored the real spatial distribution of RPs and may lead to localization errors.
Therefore, this study introduces the user’s orientation to build the orientation fingerprint database (OFPD) considering the variations of RSSIs around human body. In offline stage, the FCM algorithm is adopted to cluster for OFPD based on the hybrid distance, which is the fusion of signal-domain and position-domain distances; in the online stage, when the user requests localization, the OFPD is selected based on the user’s orientation and used for further matching operation. The proposed adaptive weighted K-nearest neighbor (AWKNN) technique could select K RPs, remove the RPs with larger signal-domain distances, minimum and maximum coordinate values, and calculate the weighted mean coordinates. This technique can make the remaining RPs more concentrated and improve positioning accuracy.
This article is organized as follows. Section “The impacts of user’s orientation on Wi-Fi RSSI” describes the impacts of user’s orientation on Wi-Fi RSSI. In section “The proposed technique,” we propose the AWKNN method considering the user’s orientation. This section also involves the establishment of OFPD model and FCM clustering taking into account user’s orientation based on the hybrid distance. Section “The experiment and analysis” describes the experimental testbed and evaluates the performance of proposed method. We conclude the article in section “Conclusion.”
The impacts of user’s orientation on Wi-Fi RSSI
Some buildings are irregular with complicated interior building structures. People easily get lost in the complex indoor environment, and they are more sensitive to their front and back, right and left. Their movements are usually along the building or its vertical direction, so it is necessary to study the impacts of user’s orientation on Wi-Fi RSSI. Almost all APs are installed along buildings. And, it seems that the signal is blocked more seriously when the human body faces these four directions. So, four orientations are chose to study the influence on RSSI. As shown in Figure 1(a), a test of RSSI distribution around the human body is conducted. In the test, Wi-Fi signals are collected in the clockwise direction at the location of 1.5 m away from an AP. The sampling frequency is 1 Hz and the period is 2 min. Orient 1 faces the AP and Orient 3 is the opposite direction. Figure 1(b) shows the test results. The results of Orient 1 and Orient 2 are consistent, and their differences are small. But the signal attenuation is large in Orient 3. Due to the shelter of the human body, the maximum RSSI difference between Orient 3 and Orient 1 could reach 15 dBm. While the transmitted power level of a civil AP is around 20 dBm, the difference can be seemed as big. Compared to Orient 1, Orient 4 has smaller signal attenuation, because the right arm could block signals during the signal acquisition. Above all, the human body has significant effects on Wi-Fi RSSI, and the RSSI distribution is related to the user’s orientation. Therefore, the user’s orientation should be taken into account for Wi-Fi fingerprint positioning.
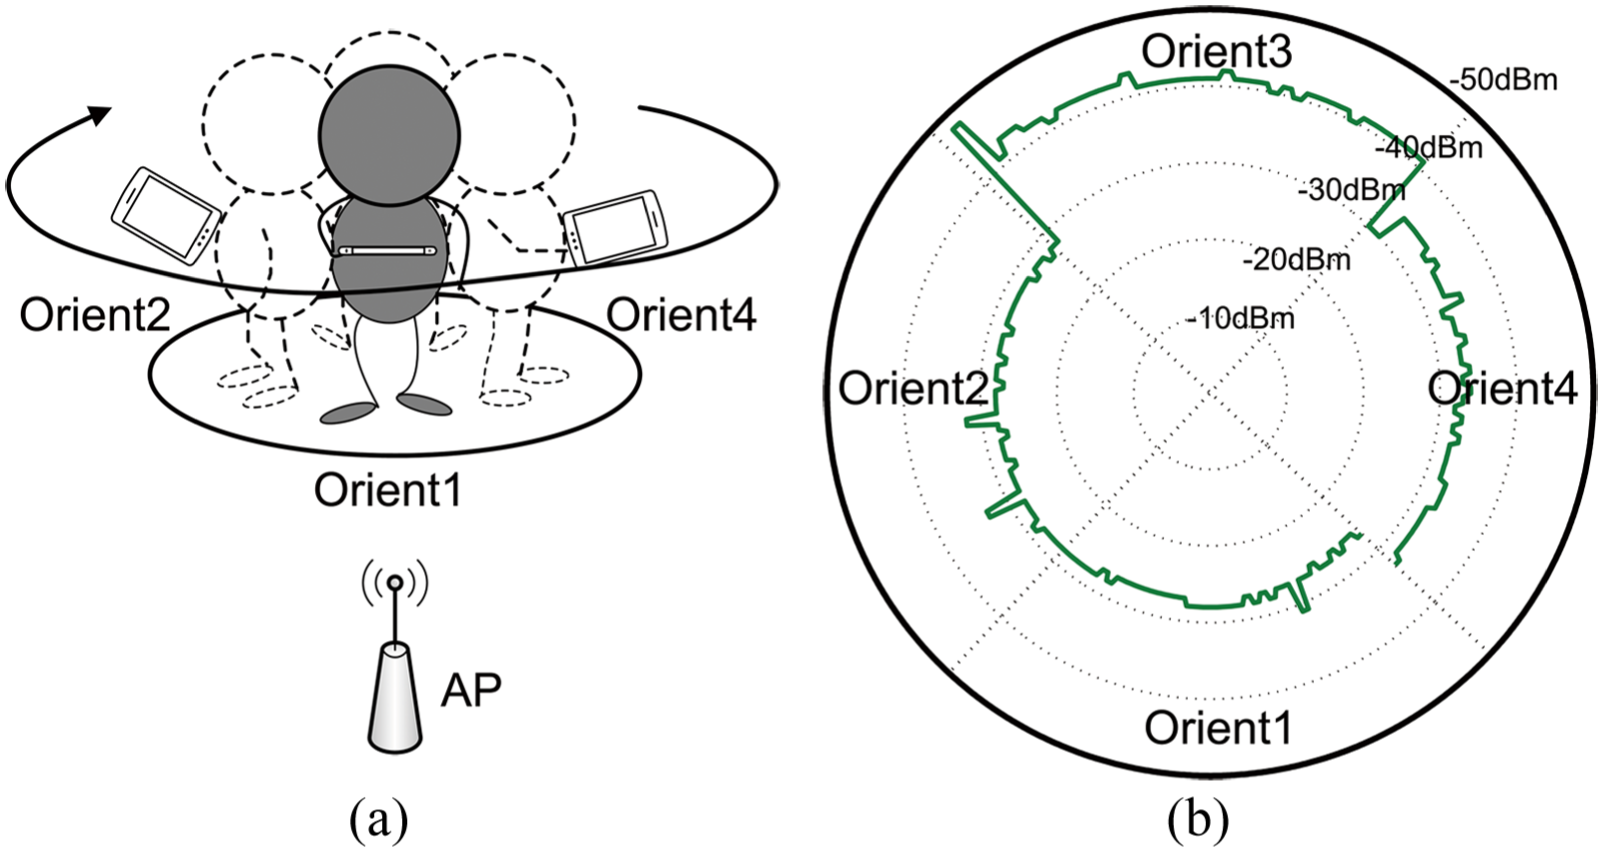
RSSI distribution under the impacts of user’s orientation: (a) RSSI collection from a certain AP in clockwise direction, orientation 1, orientation 2, orientation 3 and orientation 4 and (b) the corresponding RSSI distribution in four directions, which can reflect the impacts of user's orientation.
Orient 1, Orient 2, Orient 3, and Orient 4 refer to the angle scopes from 0° to 90°, 90° to 180°, 180° to 270°, and 270° to 360°, respectively.
The proposed technique
This section presents the proposed Wi-Fi OFPD model, the FCM algorithm based on the hybrid distance considering user’s orientation, and AWKNN algorithm.
Wi-Fi OFPD model
The traditional Wi-Fi fingerprint positioning method uses a common fingerprint database (CFPD) model, which takes the vector of mean RSSI values in multiple directions as signal features and ignores the deviations of RSSI values caused by the user’s orientation. This article puts forward a Wi-Fi OFPD model considering the user’s orientation as shown in Table 1. Where id refers to the record number, pid refers to the point number of RP, x and y refer to the coordinates of RP, AP MAC refers to the media access control address of AP, and RSSI refers to the corresponding RSSI value. In offline stage, the Wi-Fi signals are collected according to different user’s orientations using the Wi-Fi Scanner software shown in Figure 2. Subsequently, the O i FPD (i = 1, …, 4) including the spatial position, user’s orientation, and Wi-Fi fingerprint are established. Where the O1FPD refers to the fingerprint database in Orient 1. In online stage, the user’s orientation should be determined first and then the OFPD in same angle scope could be selected for further matching operation.
The orientation fingerprint database, for example, the O1FPD.
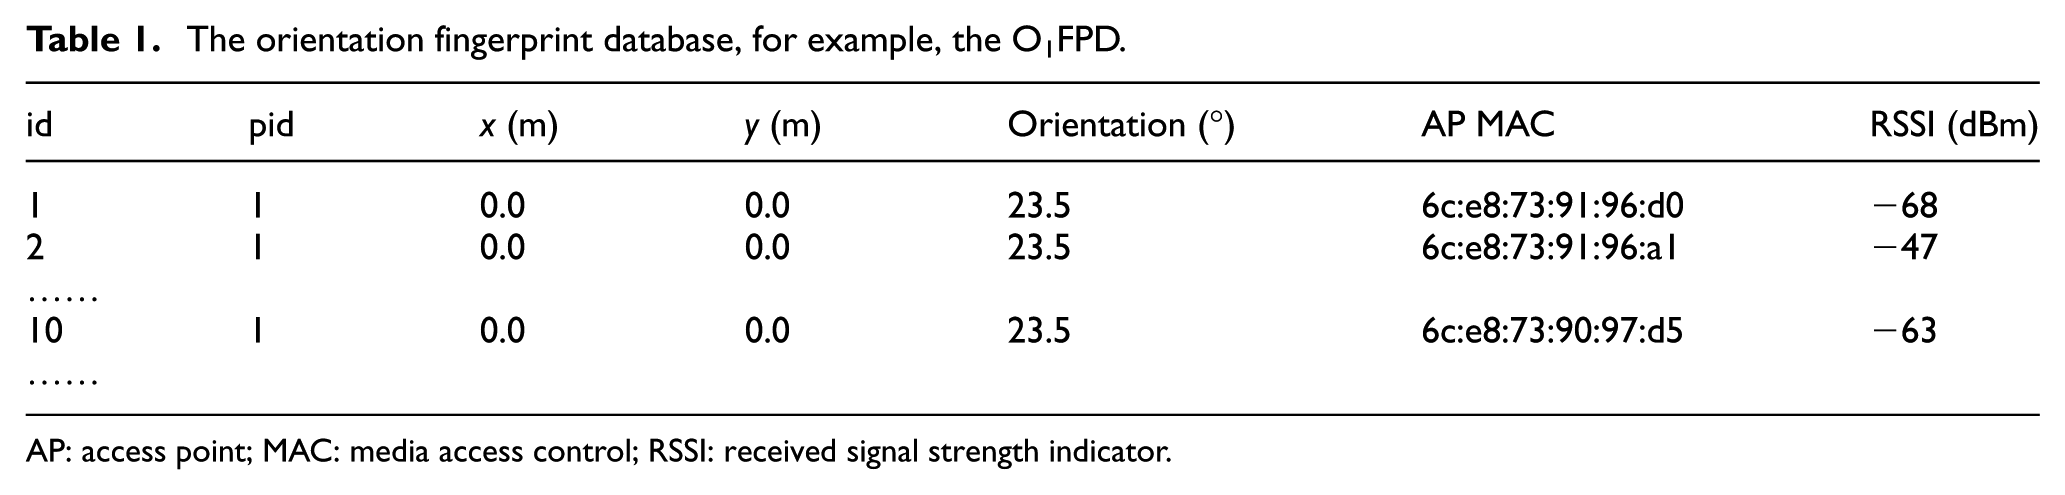
AP: access point; MAC: media access control; RSSI: received signal strength indicator.

Wi-Fi Scanner application allows researcher to collect Wi-Fi signal fingerprint at RPs and test points.
The FCM clustering based on hybrid distance considering the user’s orientation
The FCM clustering based on the hybrid distance considering the user’s orientation is applied in offline stage. The feature of the adopted FCM clustering algorithm is the hybrid distance, which is the fusion of signal-domain and position-domain distances. The clustering results could be used for clustering recognition in online stage.
In online stage, the OFPD is selected according to the user’s orientation, for example, the O1FPD. The signal-domain distances between the test point (TP) and all clustering centers of the O1FPD are calculated, and the cluster corresponding to the minimum signal-domain distance is selected for the next Wi-Fi fingerprint matching operation.
The Euclidean distance between two sets of Wi-Fi signals is taken as the signal-domain distance. In a complex indoor environment, it is hard to ensure that every location could receive Wi-Fi signals with same number of APs. So, the number of APs is introduced to improve the signal-domain distance, as shown in equation (1), where

The position-domain distance

The clustering results based on the signal-domain distance could not reflect the exact spatial relationship of RPs. Therefore, the hybrid distance, the fusion of signal-domain and position-domain distances, should be taken as the clustering feature in clustering analysis. Because of their different metrics, signal-domain and position-domain distances need to be normalized for further application. The hybrid distance

where Nor() is the normalized function, we choose the min-max normalization method, which maps the distance values to a uniform range. In practical application, we set the range to be [0.01, 1]. This process can keep the impacts of signal-domain and position-domain distances equal. Because any one of the normalized distances is set as 0, the other one is of no effect.
An AWKNN algorithm
Traditional KNN and WKNN fingerprint positioning methods employ the RPs corresponding to the top K minimum signal-domain distances to estimate coordinates. These methods ignore actual spatial distribution of RPs merely considering the impacts of signal-domain distance on positioning results. In this article, the proposed AWKNN algorithm takes both the signal-domain distance and spatial-domain distance into account. Based on certain criteria, the algorithm could select K RPs, remove the RPs with larger signal-domain distances, minimum and maximum coordinate values, and calculate the weighted mean coordinates with the remaining RPs. The specific algorithm is described as follows.

Where Num() denotes that the function shows the number of available, sqrt() denotes that the function calculates the standard deviation, sort() denotes that the function sorts variables in ascending order, returning sorted variables and corresponding index, | | refers to the absolute value, subscript avg refers to the average value, subscript σ refers to the standard deviation, and Sum means the sum of absolute coordinate values of the remaining RPs.
The minimum signal-domain distance d1 is used to remove RPs with larger signal-domain distances, instead of the mean signal-domain distance. This is because the smaller the signal-domain distance between two points in the matching operation, the more similar they are. The RP that corresponds to the minimum signal-domain distance d1 has the highest credibility. Then, twice standard deviation is used to remove the RPs with larger signal-domain distances. The standard deviations of the absolute coordinate values are used to remove RPs with minimum and maximum coordinate values. This step could ensure that the distribution of remaining RPs is more concentrated, avoiding larger estimation errors, and improving the positioning accuracy and stability.
Assuming that five RPs P1, P2, …, P5 are reserved, as shown in Figure 3. Figure 3(a) shows the distribution of RPs. x and y refer to the plane coordinate, respectively. The vertical direction refers to the signal-domain distance. The algorithm could be used to find and remove RPs with larger signal-domain distance, as shown in Figure 3(b), for example, the P5 in the circle. Then, P3 among the remaining RPs with the maximum coordinate value should be removed. Finally, the remaining three RPs are selected, as shown in Figure 3(d). The positioning results could be calculated by inverse distance weighted algorithm. If the coordinate value of P1 is very small, in other words, P1 deviates from P2 and P4, it will be removed by the proposed AWKNN algorithm.

Schematic diagram of the AWKNN algorithm: (a) the three-dimensional distribution of five obtained RPs, (b) removing RP with larger signal-domain distance, (c) filtering RP with maximum coordinate absolute value, and (d) the remaining RPs with more concentrated distribution.
The experiment and analysis
This section discusses the experimental testbed and evaluates the performance of the clustering and the proposed AWKNN positioning algorithm.
The experimental testbed
The experiment is carried out in region C, on the fourth floor of an office and teaching building, occupied by School of Environment Science and Spatial Informatics. The layout of testbed is shown in Figure 4. It includes stairs platform, corridor, and rooms. The size of corridor is 29.3 m × 2.4 m. The length of stairs platform is 7.2 m. The size of laboratory room is 9 m × 6.6 m. 10 TP-Link 2.4 GHz wireless APs are pre-installed at about 3 m above the corridor and stairs platform, as shown in the solid triangle. The solid dots refer to the RPs with a total of 83. The distance between a RP and its nearest neighbor RP is 1.2 m. The “fp collect” button of Wi-Fi Scanner software shown in Figure 2 is used to record position, user’s orientation, and collect the corresponding Wi-Fi signal fingerprint at each RP in four different orientations. The measurement is in clockwise direction. Its sampling period is 60 s in each direction, and the sampling frequency is 1 Hz. In the fingerprint database, there are 264 positions in the corridor and stairs platform, and there are 68 positions in the room. On average, each location could receive at least eight APs’ Wi-Fi signals.

The layout and indoor environment of the experimental testbed.
To test the performance of the proposed method, 20 TPs are laid evenly in the experiment area, as shown in the hollow dots in Figure 4. The measurement at each TP used by “tp collect” button is the same as the operation of “fp collect”. But the sampling period is 10 s in each direction. There are 800 sets of test data in total.
Clustering results and analysis
To analyze the performance of clustering of the fingerprint database in the offline stage, the K-means, FCM, and APC algorithms are used for clustering analysis based on the CFPD and O i FPD (i = 1, …, 4), and the results are shown in Figure 5. Clustering results by the above three algorithms are successively shown from top to bottom. From left to right of Figure 5, there are five columns figures, which show clustering results by different algorithms based on CFPD, O1FPD, O2FPD, O3FPD, and O4FPD, respectively. The triangle, square, round, and star denote different clusters. Clustering results are slightly different even with the same algorithm. For instance, as shown in Figure 5(a), two clusters overlap in the area marked by rectangular solid box. And, there are different number of clusters in Figure 5(c). We can find that the clustering results may be different based on fingerprint database with different orientations.

Clustering results by K-means, FCM, and APC clustering algorithms, where triangle, square, round, and star represent different clusters: (a) the clustering results by K-means based on CFPD, O1FPD, O2FPD, O3FPD and O4FPD, respectively, (b) the clustering results by FCM based on above-mentioned fingerprint database, and (c) the clustering results by APC based on above-mentioned fingerprint database.
In Figure 5(c), there are four clusters of O4FPD by APC algorithm. The APC algorithm can adaptively create clusters based on the constant exchanging of reading similarities between RPs without providing initial cluster centers and counts. And, according to the building structures, decoration styles, and indoor scenes, we find that four clusters more accurately reflect the actual layout of the experimental field in Figure 4. Therefore, the number of clusters for K-means and FCM algorithm is pre-set as four. In addition, the initial clustering centers of the K-means and FCM algorithm are not randomly selected. All RPs are equally pre-divided into four clusters. The mean coordinate values and the set of mean RSSI values of all RPs in every cluster are taken as the feature of each clustering center.
Figure 5(a) shows the clustering results by K-means clustering algorithm. The clustering results of CFPD are broadly consistent with those of OFPD. However, the phenomenon of cluster overlapping could be observed in the rectangular selection region in clustering results of O1FPD, which will decrease the accuracy of clustering recognition. Figure 5(b) shows the clustering results by FCM clustering algorithm. The clustering results of CFPD are also basically consistent with clustering results of OFPD. The results also exactly reflect the true indoor scenes in the experimental field. Figure 5(c) shows the clustering results by APC algorithm. The amounts of clusters are 3, 3, 3, 3, and 4 from left to right, respectively. The cluster edge changes greatly and could not truly reflect the real situations of the experiment field.
Meanwhile, the Davies–Bouldin index28,29 (1, 2)(DBI) is chosen as an effective evaluation index for clustering results. DBI is a clustering quality index, first introduced by Davies et al. in 1979. It is built to numerically express the performance of clustering tools. The smaller the DBI value, the better the clustering results. In this work, the DBI is used as a basis for assessing different clustering algorithms.
Table 2 shows the DBI values of CFPD and O i FPD (i = 1, …, 4) by K-means, FCM, and APC algorithms. In Table 2, Mean refers to the mean of DBI value and Std refers to the corresponding standard deviation.
DBI values by K-means, FCM, and APC algorithms.

DBI: Davies–Bouldin index ; FCM: fuzzy c-means; APC: affinity propagation clustering.
As shown in Table 2, the DBI values of CFPD and OFPD clustering are very close by K-means algorithm and FCM algorithms. The corresponding mean values and the standard derivations by K-means and FCM algorithm are also similar. The DBI values by APC algorithm are larger than those by K-means and FCM algorithm, apart from that of O3FPD. The DBI value of O4FPD by APC algorithm is more than twice that by K-means and FCM algorithms.
Figure 5 and Table 2 show that the clustering by FCM algorithm has the best performance among the three clustering methods.
The evaluation of operational performance
Execution time and time complexity are introduced to evaluate the performance of the proposed AWKNN algorithm compared to WKNN and EWKNN algorithms. The running platform is a computer with Intel 7 CPU, 16 GB memory and Window 10 operating system. The simulation is conducted by using of MATLAB 2016. The execution time of single localization by AWKNN algorithm is about 3.7 ms, while the execution time of single localization by WKNN and EWKNN algorithms are 2.4 and 2.8 ms, respectively. And, the time complexity of the above three algorithm is O(n), where n is the number of RPs in cluster or fingerprint database. Therefore, the proposed AWKNN algorithm has equivalent performance to WKNN and EWKNN algorithms.
The localization results and analysis
The positioning experiments based on different fingerprint databases and by different algorithms are carried out, respectively. To evaluate the performance of positioning methods, the error mean (EM), root mean square error (RMSE), maximum error (ME) and 50%th cumulative distribution function error (CDFE) are used as the error statistical indexes. In the proposed AWKNN algorithm, the number of initial selected RPs is set as 10. To be fairly compared with AWKNN algorithm, different positioning tests are conducted with K values ranging from 1 to 10 by WKNN algorithm, selecting positioning results with better performance.
Results and analysis of positioning experiment based on different fingerprint databases
In this experiment, the existing WKNN and EWKNN algorithms are used for estimating results based on CFPD and OFPD, respectively. Figure 6(a) and (b) shows the cumulative distribution function of positioning errors by WKNN and EWKNN algorithms, respectively. The circles represent the positioning errors based on CFPD and the triangles represent the positioning errors based on OFPD. In Figure 6(a), the average error is minimum based on CFPD by WKNN algorithm (CFPD-WKNN) when K is equivalent to 10, while the average error is minimum based on OFPD by WKNN algorithm (OFPD-WKNN) when K is 4. In Figure 6(b), the EWKNN algorithm–based CFPD (CFPD-EWKNN) and the EWKNN algorithm based on OFPD (OFPD-EWKNN) have different values of K in every matching operation.

The cumulative distribution function of positioning errors by WKNN and EWKNN algorithms: (a) positioning errors based on CFPD and OFPD by WKNN algorithm and (b) positioning errors based on CFPD and OFPD by EWKNN algorithm.
Table 3 describes the statistics of positioning errors based on CFPD (CFPD-WKNN and CFPD-EWKNN) and OFPD (OFPD-WKNN and OFPD-EWKNN). Compared with the positioning method based on CFPD, the values of EM, RMSE, ME, and 50%th CDFE based on OFPD decrease by 0.6, 1, 15.7, and 0.3 m. It should be noted that the value of ME is 23.3 m based on CFPD. Greater errors are introduced into localization based on CFPD. Because reflection, refraction, diffraction, and scattering may take place when Wi-Fi signals travel from transmitters to the receiver, signal enhancement or attenuation will occur in a location where the differences are small between the received Wi-Fi signal fingerprint and the signal fingerprint in the far distance in CFPD. While the OFPD includes the user’s orientation, which is useful to narrow the positioning search region and avoid larger positioning errors. As seen from Figure 6 and Table 3, the performance of the positioning method based on OFPD is superior to the CFPD-based positioning method.
Statistics of positioning errors based on CFPD and OFPD (unit: m).

EM: error mean; RMSE: root mean square error; ME: maximum error; CDFE: cumulative distribution function error; CFPD: common fingerprint database; OFPD: orientation fingerprint database.
Results and analysis of positioning experiment by different algorithms
First, the WKNN algorithm based on OFPD (OFPD-WKNN) is used for positioning test in different indoor scenes, and the statistics of errors are shown in Table 4. When K = 4, the minimum EM is 2.0 m in the corridor and stairs platform; when K is 5, the minimum EM is 2.8 m in the laboratory. There are large differences in RMSE, ME, and 50%th CDFE under these two different indoor scenes. Therefore, there are errors for WKNN algorithm applying the fixed value of K.
Statistics of positioning errors in different indoor scenes by OFPD-WKNN technique (unit: m).

OFPD: orientation fingerprint database; WKNN: weighted K-nearest neighbor; EM: error mean; RMSE: root mean square error; ME: maximum error; CDFE: cumulative distribution function error.
Then, the positioning experiments are conducted by the WKNN, EWKNN, and the proposed OFPD-AWKNN algorithms, respectively. The cumulative probability distribution of positioning errors is shown in Figure 7. When K is 4, the minimum EM in the whole experiment could be obtained by WKNN algorithm.

The cumulative distribution function of positioning errors by three OFPD-based algorithms.
Table 5 gives the statistics of positioning errors by WKNN, EWKNN, and the proposed AWKNN algorithms based on OFPD (OFPD-WKNN, OFPD-EWKNN, and OFPD-AWKNN). Compared with the WKNN algorithm, the minimum EM and RMSE obtained by the proposed AWKNN algorithm decrease by 1.8% and 1.9%, respectively. Compared with the EWKNN algorithm, the EM, RMSE, ME, and 50%th CDFE obtained by the proposed AWKNN algorithm decrease by 7.5%, 3.1%, 11.5%, and 6.1%, respectively. As shown in Figure 7 and Table 5, the performance of the proposed AWKNN algorithm in this article is superior to WKNN and EWKNN algorithm.
Statistics of positioning errors by OFPD-based three algorithms (unit: m).

OFPD: orientation fingerprint database; EM: error mean; RMSE: root mean square error; ME: maximum error; CDFE: cumulative distribution function error; WKNN: weighted K-nearest neighbor; EWKNN: enhanced weighted K-nearest neighbor; AWKNN: adaptive weighted K-nearest neighbor.
Finally, the positioning experiments are conducted by CFPD-WKNN, CFPD-EWKNN, and the proposed OPFD-AWKNN technique in this article, respectively. Figure 8 shows the cumulative distribution function of positioning errors. When K is 10, the minimum EM could be obtained by CFPD-WKNN method. Table 6 shows the errors of the existing Wi-Fi fingerprint positioning methods and the proposed OFPD-AWKNN method. Compared with CFPD-WKNN, the EM, RMSE, ME, and 50%th CDFE obtained by OFPD-AWKNN method decrease by 0.6, 0.9, 14.8, and 0.3 m, respectively. Compared with the CFPD-EWKNN method, the values of EM, RMSE, ME, and 50%th CDFE by OFPD-AWKNN method decrease by 0.9, 1.2, 16.6, and 0.4 m, respectively. Compared with the existing methods, the values of EM, RMSE, ME, and 50%th CDFE by OFPD-AWKNN method decrease by 0.7, 1.0, 15.7, and 0.3 m on average, respectively.
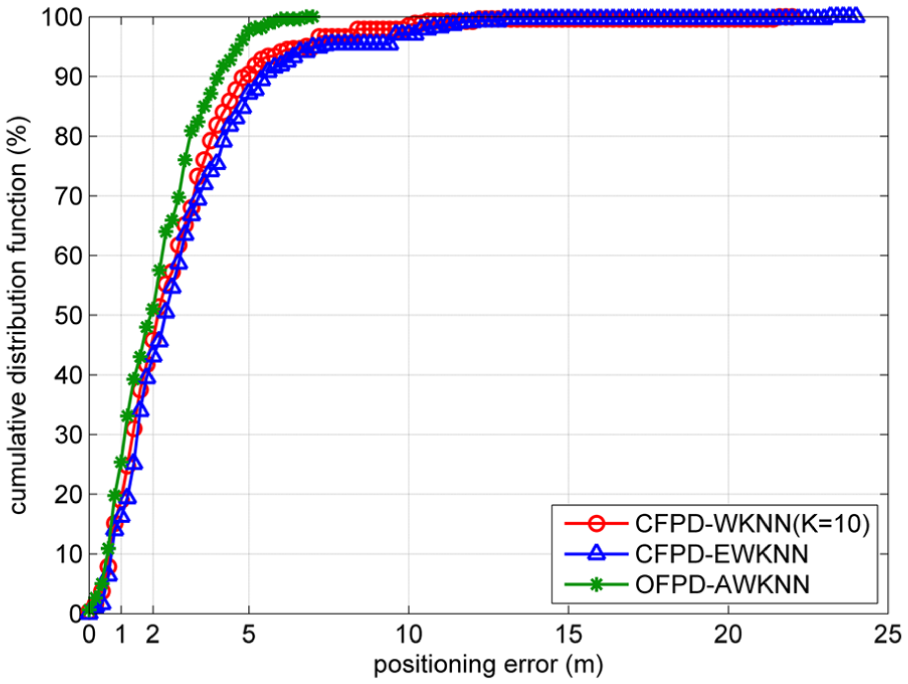
The cumulative distribution function of positioning errors of the existing algorithms and the proposed algorithm.
Statistics of positioning errors of the existing algorithms and the proposed algorithm (unit: m).
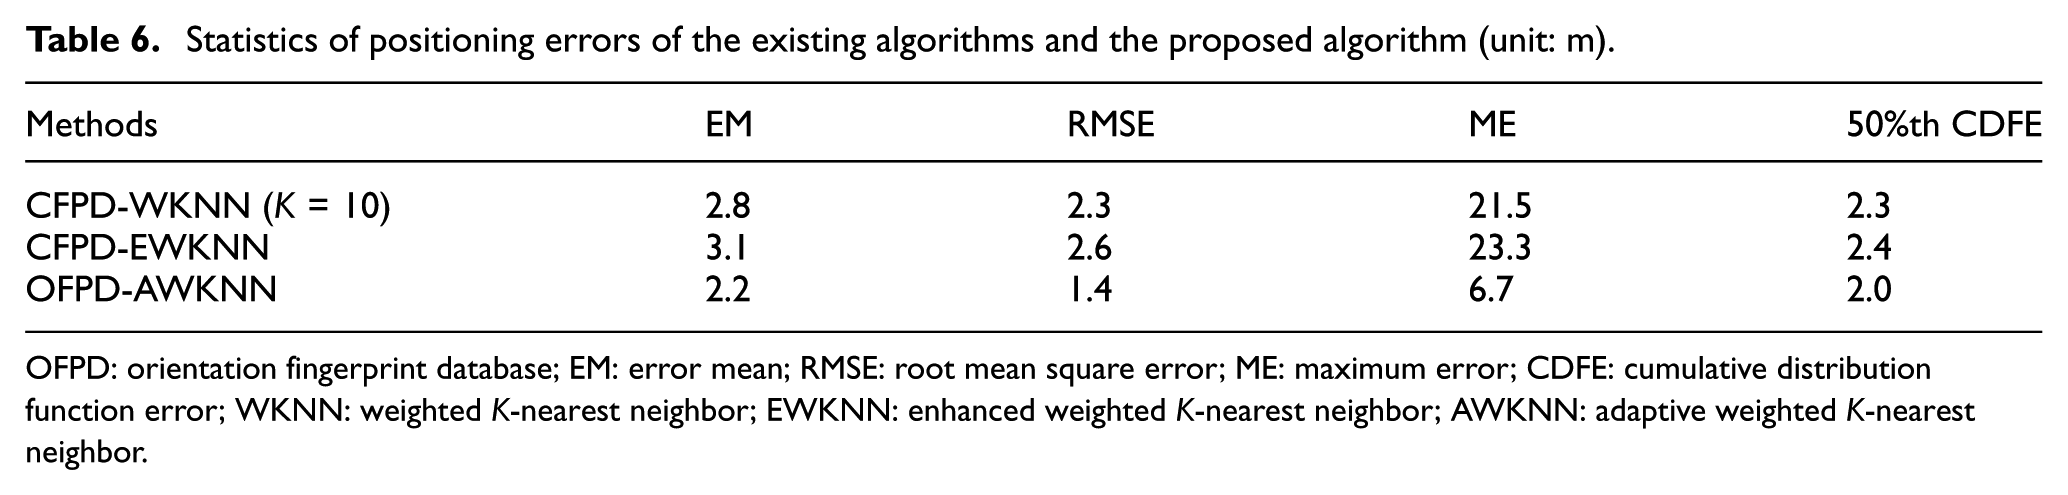
OFPD: orientation fingerprint database; EM: error mean; RMSE: root mean square error; ME: maximum error; CDFE: cumulative distribution function error; WKNN: weighted K-nearest neighbor; EWKNN: enhanced weighted K-nearest neighbor; AWKNN: adaptive weighted K-nearest neighbor.
In this article, the proposed OFPD could narrow the search scope of the matching operation and avoid larger errors. The AWKNN method considers the signal-domain distance between TP and RPs and the real position distribution of RPs simultaneously. It could remove the RPs with the larger signal-domain distance, the minimum and maximum coordinate values, and improve the fingerprint positioning accuracy. The experimental results indicate that the performance of the newly proposed OFPD-AWKNN method is superior to the CFPD-WKNN and CFPD-EWKNN methods.
Conclusion
This article studies the impacts of the human body on Wi-Fi RSSI. To eliminate or weaken positioning errors caused by user’s human body, user’s orientation is introduced to establish the OFPD. And, the FCM clustering based on the hybrid distance is exploited in offline stage. Moreover, an AWKNN method considering the signal-domain distance and exact position distribution of RPs is proposed. This method is suitable for the indoor scenes of corridor, stairs platform, and rooms and could improve the accuracy of Wi-Fi fingerprint positioning. The EM, RMSE, ME, and 50%th CDFE obtained by the OFPD-AWKNN are 2.2, 1.4, 6.7, and 2.0 m, respectively. Compared with CFPD-WKNN and CFPD-EWKNN methods, the average positioning accuracy of OFPD-AWKNN method increases by 0.7 m and the RMSE decreases by 1 m on average. However, the densely distributed RPs in the whole experiment field bring great difficulties for fingerprint data acquisition. In addition, the Wi-Fi signals vary greatly in indoor environment. Therefore, the Gaussian process, interpolation, and adaptive update fingerprint technologies should be introduced for the further researches to reduce the workload of fingerprint acquisition.
Footnotes
Handling Editor: Olivier Berder
Declaration of conflicting interests
The author(s) declared no potential conflicts of interest with respect to the research, authorship, and/or publication of this article.
Funding
The author(s) disclosed receipt of the following financial support for the research, authorship, and/or publication of this article: This work was supported by the National Key Research and Development Program of China (grant number 2016YFB0502102), the Fundamental Research Funds for the Central Universities (grant number KYLX16_0544), the National Natural Science Foundation of China (grant number 41674030), and the China Postdoctoral Science Foundation (grant number 2016M601909).