
Abstract
Aiming at the complexity of the network transmission environment and the decentralization of the monitoring sites in the middle route of the South to North Water Diversion Project, this article presents a water conservancy monitoring architecture based on the visual sensor networks. First, a network assessment method is proposed to evaluate the sensor networks condition, and the encoder is adjusted with the result of the sensor networks condition evaluation. Then, based on distributed database architecture and visualization system construction, a three-level structure of the water conservancy monitoring system is designed and built. The experiment results show that the water conservancy monitoring system proposed in this article meets the transmission requirement under the complex sensor networks condition of water conservancy project. The water conservancy monitoring system has been applied to the middle route of the South to North Water Diversion Project, which achieves the needs of engineering applications.
Keywords
Introduction
South to North Water Diversion Project is one of the largest, longest, most beneficiaries of inter-basin water conservancy projects in the world. The middle route of the South to North Water Diversion Project starts from the Danjiangkou Reservoir, ends in Beijing and Tianjin, which has great contribution to rational distribution of water resources and social development. 1 The total length of the South to North Water Diversion Project is 1432 km, including complex tunnels and culverts along the Yellow River and other places. For the trunk canal environmental protection, the water quality requirements of the South to North Water Diversion Project is very high, the quality of water directly into the Danjiangkou Reservoir should not less than class III (total nitrogen remained stable, surface water source secondary protected areas), and Hanjiang River Boundary section water quality should reach class II.2,3 As one of the important methods of water quality protection, the sensor network monitoring system has been set along the pipe line in order to monitor the river and river bank. For the river, the system can detect the quality of the water using the concentration sensors and temperature sensor in the sensor network and monitor the transport on the river using the visual sensors in the sensor network. For the river band, there are many critical areas that are prohibited from entry or come close; using the visual sensors in the sensor network with the motion detection, the suspicious persons can be recorded and several lawless behaviors, such as dumping, can be detected. Therefore, the sensor networks of the water division project can ensure the security of the river and the river band environment in the water diversion project.
Compared with the traditional environmental monitoring system application based on the sensor networks, the South to North Water Diversion Middle Line project monitoring sites are scattered, the monitoring network in which the network environment is quite different. The critical area video data set collected by the visual sensor has large numbers of data transmission channels, and the data transmission link has the characteristics of long path, high heterogeneity, and large data volume.
Therefore, in order to meet the requirements of monitoring data processing in the complex environment of South to North Water Diversion Project, this article studies the monitoring program of the middle route of the South to North Water Diversion Project, which can meet the requirements of massive data and complex network environment, combined with sensor network architecture construction and visual sensor networks transmission.
Normally, the visual sensor networks applications rely on the local-area network (LAN), private network, or urban trunk network with high bandwidth stability, and the visual sensor network is more concentrated. In our research situation, it is a great challenge to the transmission of the visual sensor data and other environment sensor data because of the complex geographical environment and the conditions of monitoring sites. In particular, due to the heterogeneous network layout of the water source and the influence of the solid/dashed line transmission, there are challenges such as unstable bandwidth, large transmission speed fluctuation, and data congestion, which are related to data transmission instability and delay. 4
This article studies the method of water conservancy monitoring and data transmission through visual sensor network. A bandwidth detection method with variable cycle for visual sensor video transmission and a low bit rate video coding method which is suitable for the visual sensor network are proposed. A water conservancy monitoring system is designed and built for the water conservancy monitoring through the visual sensor and other sensor networks based on Browser/Server (B/S) architecture.
Further content organization is presented below. In section “Monitoring model” of this article, the sensor network water monitoring system of the middle route of South to North Water Diversion is modeled. Section “Critical area monitoring based on visual sensor networks” describes the adaptive sensor coding method based on the network evaluation results. Section “Construction of water conservancy monitoring system” describes the design and construction of the water conservancy monitoring system based on the sensor data. Section “Results and analysis” gives the experiment results and display the main function interface of the water monitoring system. Finally, conclusion is given in “Conclusion.”
Related work
In the field of sensor network research, stable performance of the environmental data collection sensor sets has developed for the environmental monitoring. In view of the monitoring data transmission between sensor networks, the existing research mainly includes the following: Shahrokhzadeh and Dehghan 5 proposed a transmission method of environmental sensor data between two WiFi network groups, which improves the transmission reliability across the same kind of network; Liu and Liu 6 proposed a visual sensor architecture with distributed adaptive control, in order to improve the effectiveness of data transmission within the architecture; Muduli et al. 7 proposed a visual sensor deployment strategy to improve the low-quality channel data transmission capacity in a closed environment. Using the sensors network including temperature, concentration, speed, video, and other sensors, the environmental monitoring system is built.
Specific application cases include the following: Skynet Project is designed for China’s network video surveillance, which is widely used for the public security monitoring. The project mainly uses the visual sensor networks linked by the private network, which collect the personnel identification information, appearance information, and finally, achieve a traceable integrated social monitoring system. 8 In the field of agricultural cultivation, the low-power visual sensor networks have been built in the experimental greenhouse, which can monitor the growth of crops combined with soil sensor data and give irrigation reasonable guidance. 9 US Defense Advanced Research Projects Agency (DARPA) joins US domestic colleges and universities to study military and civilian use of large-scale video surveillance system, including character detection, identification, and identity authentication. 10 In Portsmouth, the United Kingdom, a “Perceptrak” intelligent monitoring network system is designed to monitor the vehicle speed, suspicious personnel wandering, and other testing records and promptly notify the security personnel to take appropriate measures, which using the speed senor and visual sensor networks. 11
Monitoring model
The visual sensor network of water conservancy monitoring usually deployed among rivers and mountains, normally including three levels of the sensor group, which is the site level, the station level, and the center level. The sensor data connection between each group is far and varied. In the middle route of the South to North Water Diversion Project, the monitoring area starts from the Danjiangkou Reservoir, through Nanyang Province and the Yellow River in Henan, along the north side of the Beijing–Guangzhou railway, ending in the Beijing Summer Palace Mission Lake, overall shows a large span involving a wide area features. The middle route contains large numbers of monitoring stations, each monitoring station contains numbers of monitoring sites, and the terminal of the project is a water environment monitoring center. 12 The three-level monitoring sites are mainly located in the trunk canal along the river, the geographical environment is complex, and the monitoring video and water quality data transmission is mainly based on wireless networks. In addition, the monitoring station and the center of the exchange of information is more diverse, including private network and wideband code-division multiple access (WCDMA) network. Therefore, the network types in the water conservancy monitoring system are complex. 13 The model is focused on the transmission and the coding processing of the visual sensor network; the unit and the equipment are placed in each level of the model. The water conservancy monitoring architecture model is shown in Figure 1.

Water conservancy monitoring system architecture based on sensor network.
The model is divided into three levels. The third level represents the monitoring sites, including the visual sensor and the encoder. The data collected at each site will be transmitted to the corresponding monitoring station through the sensor network. The second level represents the monitoring stations, including the monitoring station client and video server. The important data in each monitoring station is transmitted to control center through heterogeneous networks. The first level represents the control center, including the video display device, video server and other servers. The important data is analyzed and shown in the control center.
Critical area monitoring based on visual sensor networks
Visual sensor networks evaluation method
The visual sensor monitoring data transmission method proposed in this article is mainly based on the real-time transport protocol/real-time transport control protocol (RTP/RTCP). RTP is mainly used in the network environment for the transmission of multimedia data protocol. 14 The purpose of RTCP is to provide data transmission and reception, which refer to the quality of service (QoS) evaluation of feedback data.15,16 The RTCP package structure used in this article is shown in Figure 2. The sending and receiving equipment sends the RTCP protocol packets periodically and analyzes the received RTCP protocol packets to obtain data such as the sending and receiving time of the packets and the total number of packets. Through further data analysis, the network quality parameters including network delay and packet loss rate are obtained, which can provide reference for the next step in video coding parameter adjustment.

RTCP packet structure.
The network delay and packet loss rate are calculated as follows. Network delay refers to the time that a frame of data is sent from the sender and received at the receiving end. It usually uses milliseconds as the time precision unit. In normal network conditions, network latency is usually no more than 200 ms. When the network is busy, the network delay can be up to 1000 ms. 17
The RTCP protocol calculates the network latency based on data bits, which primarily utilizes the timestamp in the RTCP protocol packet. At the time of receipt of the data packet, the transmitting end and the receiving end each tag the packets

The packet loss rate is the proportion of the total number of packets lost in the unit time. The packet loss rate of data transmission per unit time can be calculated by the total amount of data

The evaluation of the network condition in this article is calculated based on the analysis of the network transmission delay and packet loss rate. The evaluation result is the sum of the network transmission delay status and the packet loss rate condition. The network condition evaluation result value S is calculated as shown in equation (3)

The sum of the network transmission delay condition weight

The packet loss rate evaluation value

In addition, in the actual network, there are short-term fluctuations in the network situation. 19 This is mainly due to the instability of the actual network itself, the phenomenon of network instability can be a fast and sharp decline, and then quickly returned to the original level. So, it is necessary to consider a response strategy for this possible fluctuation in the evaluation method, which using the network condition monitoring record at the latest time points to determine whether the fluctuation detected at the current time is isolated and avoid the short-term fluctuation frequently adjusted parameters.
From the network condition evaluation method above, it can be proved that when the network evaluation result is greater than zero, it shows that the network delay and the packet loss rate are high, which means the bandwidth is insufficient, the network transmission is overloaded, and the code rate of the video coding needs to be reduced. When the network evaluation result is less than zero, it shows that the network delay and the packet loss rate are low, it is inferred that the bandwidth is excessive, the network transmission is light load condition, and the code rate of video coding needs to be improved.
In summary, based on RTP/RTCP protocol, network assessment method of the process is shown in Figure 3.

Network status evaluation method.
Encoding adjustment in visual sensor networks based on evaluation
Video coding technology can reduce the data transmission process bandwidth occupancy rate, so as to achieve the purpose of smooth transmission of video data. 20 In this article, a low bit rate coding scheme based on frame difference image is proposed for surface and coastal video surveillance to compress the video data. Compared with the traditional video surveillance scene, the surface and the coastal video have the characteristics of low rate of motion of the screen, the high correlation of the video adjacent frames, and the difference between the adjacent frames of the video is very flat. 21 It means the frame difference image of the water conservancy monitoring scenes requires only a small number of bit resources to represent the coding result than the original image. 22 Therefore, the frame rate image based on the low bit rate coding scheme specific process is proposed and is shown in Figure 4.

Parameter adjustment process of video coding based on network evaluation.
Figure 4 shows the video coding parameter adjustment process based on the network condition evaluation result value S, where the code rate in the video coding parameter is debugged based on the evaluation result value S. The specific adjustment method is described as follows.
The network condition evaluation value of the time period is obtained based on the accumulated value
In conclusion, the adaptive code rate coding scheme based on frame difference image achieves the function of dynamically adjusting the bit rate of video coding based on the sensor network condition, so that the bandwidth occupancy rate has been rationally adjusted to ensure the efficiency of visual sensor video data transmission.
Construction of water conservancy monitoring system
Design of sensor network distributed database
The span of the middle route of the South to North Water Diversion Project is very large, and there are many monitoring stations along the route. The amount of data involved in the sensor network under each monitoring station is very large; 23 this design divides these sensor data into two classes: the key sensor data contains macro data and abnormal data; the normal sensor data contains daily data and conventional data. In order to improve the transmission efficiency of sensing data under limited bandwidth, the system adopts the design scheme of distributed database. 24 The central database and the database of the various stations through the heterogeneous network to connect constitute the completion of the water monitoring distributed database. In the database, the database is divided into two levels, the second level is designed as the station-side database—the station-side database stores all the sensor data log, and the station side of the configuration information log and user log; the first level is designed as the central database, the database stores the decision data and the corresponding key sensing data, as well as each geographic information centers’ user information. The distributed database structure is shown in Figure 5.

Distributed database structure.
The database is designed to upload the decision data based on the daily sensing data to the general control center directly, which reduces the total amount of data transmitted to the main control center at the monitoring station. It can effectively improve the data transmission efficiency between each stations and the center.
Water conservancy monitoring system based on B/S architecture
In order to visualize the water conservancy monitoring in the central control center, architecture of water monitoring system is designed in this article. The architecture of this system includes three parts: data persistence layer, logical layer, and presentation layer. Among them, the data persistence layer using MySQL database technology, which is connected with the distributed database, the main completion of data flow access. The logic layer uses Java technology, which mainly completes the global decision-making analysis based on the station-side decision data. The presentation layer uses the B/S architecture,25,26 combined with HTML + CSS front-end performance technology, and can display the sensor data including visual sensors and decision data at the water environment monitoring center.
Results and analysis
The results of the system are tested in the system operating environment. Based on the visual sensor network, the result of the moving target detection process is shown in Figure 6. It shows two different states in the moving target detection environment. Figure 6(a) belongs to no target environment visual sensor data, and using frame difference processing on two continuous key frames from the visual sensor data, the frame difference image is acquired and shown in Figure 6(b). Figure 6(c) belongs to key target environment visual sensor data, and using frame difference processing on two continuous key frames from the visual sensor data, the frame difference image is acquired and shown in Figure 6(d). Finally, the key moving target has been selected with blue square in Figure 6(c).

Frame differential image and object detection results: (a) original image of no target environment; (b) Frame difference image of no target environment; (c) original image of key target; and (d) Frame difference image of key target.
The bit rate feedback adjustment process based on the evaluation result of the network condition is tested. The interval of I frame in video encoding is set as 24 frames, the initial code rate is 80 kbps, and code rate adjustment step gradient is 20 kbps. Video bit rate with the network status of the adaptive adjustment process is shown in Figure 7. The histogram is divided into red, gray, and green, which indicate that the network evaluation value accumulated at the current time point is higher than the average level of the network condition evaluation value, the network evaluation value accumulated at the current time point is near the average of the network condition evaluation value, and the current network at the current point in time is lower than the average level of the network status evaluation. Based on this information, the bit rate, which is one of the key parameters of the video encoding, is adjusted and represented by a blue polyline.

Network condition evaluation and rate adjustment result.
In 0–175 frames, the bandwidth is kept at about 40 kbps, and the network bandwidth is lower than the video bit rate. The network evaluation result shows that the network bandwidth is overloaded. So the video codec rate increases progressively, the initial value is 80 kbps, and the step is 20 kbps, and the final video bit rate stability at 40 kbps.
In 200–400 frames, the bandwidth suddenly increased and maintained at about 100 kbps. At this time, the network bandwidth is higher than the video bit rate; the network evaluation results for the network in a light load state and guide the video codec rate to 20 kbps step size gradient; and the final video bit rate stability at 100 kbps.
In the 425–600 frames, the bandwidth is kept at about 60 kbps, and the network bandwidth is lower than the video bit rate. The network evaluation result is that the network bandwidth is in the overload state and thus the video coding rate decreases with the step length gradient of 20 kbps; rate is stable at 60 kbps.
Compared with the constant bit rate and the standard variable bit rate solution for the visual sensor data transmission, the solution proposed in this article achieves the code rate adaptive adjustment based on the water conservancy network bandwidth, which achieves more efficient bandwidth utilization in the water conservancy monitoring.
For the water conservancy monitoring system, the function of the monitoring module interface mainly includes the visual sensor monitoring information display, senor data recording, image interception, visual sensor number selection, and parameters setting of the secondary detection sites, as shown in Figure 8. The system also includes visual sensor monitoring data history playback, the use of staff management, and other functional pages. The whole system meets the multi-functional requirements of water conservancy monitoring under heterogeneous sensor network of the middle route of the South to North Water Diversion Project.
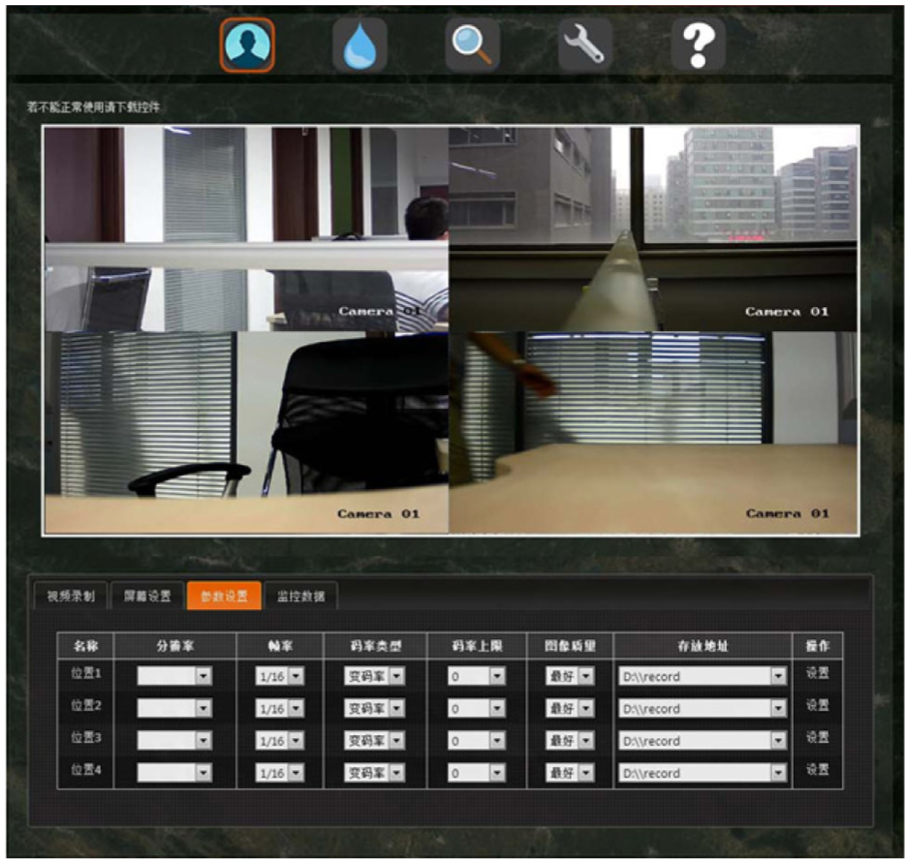
Water conservancy monitoring system interface.
Conclusion
Aiming at the characteristics of the regional distribution of the visual sensor networks in the middle route of the South to North Water Diversion Project and the instability of the network transmission environment, this article proposed a water conservancy monitoring scheme based on heterogeneous visual sensor networks. The visual sensor coding process is adaptive adjusted by the evaluation of the network environment and thus achieves the data transmission of the visual sensor networks under the variable bandwidth channel conditions. A water conservancy monitoring system is built for the middle route of the South to North Water Diversion Project. The system is now used in the middle of the South to North Water Diversion Project, which proved to meet needs of the water conservancy monitoring under heterogeneous visual sensor networks. As the visual sensor networks in water conservancy monitoring system contain large and heterogeneous sensor data, authors plan to do further research on these sensor data with machine learning and other artificial intelligence methods in the future.
Footnotes
Handling Editor: Jeng-Shyang Pan
Declaration of conflicting interests
The author(s) declared no potential conflicts of interest with respect to the research, authorship, and/or publication of this article.
Funding
The author(s) disclosed receipt of the following financial support for the research, authorship, and/or publication of this article: This paper was supported by the Project for the National Natural Science Foundation of China under grant no. 61672064 and the Beijing Natural Science Foundation under grant no. 4172001.