
Abstract
Abnormal monitoring of stage performance plays a vital role in the stage performance. For the real-time stage performance, detection efficiency and accuracy are particularly important. As the traditional monitoring method based on sparse description model to realize abnormal behavior of stage performance did not realize the manifold structure during the performance, the behavior characteristics are sparse, and the decomposition has higher volatility, the recognition accuracy of abnormal behavior is low. Therefore, an abnormal monitoring method of stage performance based on visual sensor network is proposed, the overall structure of the abnormal monitoring system of stage performance based on the vision sensor network is analyzed, the hardware structure and software composition of the system are designed, and the method of monitoring the abnormal behavior of the system is analyzed emphatically. Through the background subtraction, the weighted threshold-based segmentation of the target image from the background image, the chaotic search particle swarm optimization algorithm based on image target detection and tracking algorithm for target tracking by mean shift, the abnormal behavior of local linear embedding and detection method based on sparse representation, a comprehensive analysis of the local manifold structure of sample is set. Enhance the stage performance of abnormal behavior detection efficiency and accuracy. The experimental results show that the proposed method has higher detection efficiency and accuracy and has higher robustness.
Introduction
Abnormal monitoring of stage performance plays a vital role in the stage performance. Through monitoring and recognizing abnormal stage performance, the stage performers and the stage directors can be able to prevent the performers from leading up to the errors and ensure that the process of performance is working correctly. This article provides a clear and feasible solution different from the traditional monitoring method based on the visual sensor network.
This solution put into use the visual sensor technology in stage performance, which is based on computer vision image manipulation and pattern recognition and consists of checking the target and behavior in the stage performance and achieving intelligent monitoring of the target state, is of great significance to improve the performance of the actors. The traditional monitoring method based on sparse description model to realize abnormal behavior of stage performance did not realize the manifold structure during the performance, the behavior characteristics are sparse, the decomposition has higher volatility, and the recognition accuracy of abnormal behavior is low.1–7
In order to solve the problem, this article proposes an effective method for the abnormal monitoring of stage performance based on visual sensor network. In this article, we proposed abnormal behavior recognition in the visual sensor network platform based on local linear embedding (LLE) and sparse description to realize the high efficiency and high accuracy of abnormal monitoring of stage performance. Figure 1 shows stage abnormal performance monitoring based on the visual sensor network technology.

Stage abnormal performance monitoring based on the visual sensor network technology.
System architecture
As shown in Figure 2, this system is intended to construct the system architecture from three aspects: hardware architecture design, software module design, and algorithm application modeling.

System implementation methods.
System design strategies
When image that does not match the predefined system appears in the process of the video monitoring of the stage performances, the system will automatically alarm and call the attention of the monitoring personnel. Then, monitoring personnel can immediately collect sample of the predefined exception behavior and take action correspondingly. Based on visual sensor network, design strategy of the abnormal monitoring system of stage performance is shown in Figure 3.

Design strategy of the research on abnormal monitoring of stage performance based on visual sensor network.
It can be seen from Figure 3 that the system consists of image acquisition module, image manipulation module, and result operation module. The image acquisition module consists of charge coupled device (CCD) camera and video editor and is used for collecting stage performance images. The image manipulation module consists of network transmission and abnormal monitoring algorithm of stage performances, in which network transmission transmits the collected stage performance image data to the video central processor for processing and analyzing. 8 The result operation module consists of result show and alarm system and outputs abnormal behavior of stage performance.
This article adopts H.264 as the video editor to transmit the stage performance image data by sensor network.
Composition of the system hardware
The composition of the system hardware is shown in Figure 4.

Composition of the system hardware.
The system hardware mainly consists of PC, CCD camera, motor, and other control modules. After receiving order from the PC server, CCD camera begins to collect stage performance images 9 and feed the collected image information to computer memory through the transmission equipment. Then, image data are presented by the image manipulation software and are used for judging whether there is an abnormal stage performance. Finally, the alarm system takes measures on the stage performance according to the test results.
Design of the system software
The key of the proposed system is the video analysis algorithm, which consists of image preprocessing, motion detection, target tracking, and abnormal behavior recognition. 10 Operable control interface should be provided via system software to realize the analysis, acquisition, and manipulation of the stage performance.
Functional modules of the system software
This article uses the Windows Visual Studio 2008 to design the system software. The structure of the functional modules of the system software is shown in Figure 5. The modules are designed according to the system function to realize the image acquisition, image manipulation, and the result operation. Each module interacts with others through the image information flow. The video data receiving/transmitting module collects the information of the stage performance behavior and transmits the information through multicast mode. The image manipulation module is the key component of the system which provides pre-operation and abnormal behavior recognition of images on the basis that the exception behavior samples are given. The result operation module is used for storing the output results.

Structure of the functional modules of the system software.
Process of the abnormal monitoring of stage performance
To monitor the abnormal stage performance with high efficiency and accuracy, detection and identification of the stage performance are of great significance. The flow process diagram of the abnormal monitoring of stage performance is shown in Figure 6.
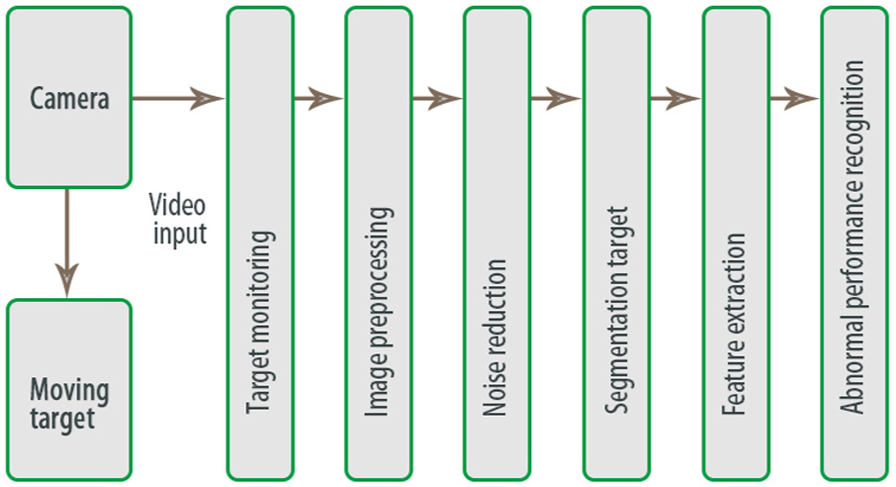
Flow process diagram of the abnormal monitoring of stage performance.
Target monitoring of stage performance is to identify the moving target from the background image given by fixed angle monitoring and denotes the original stage performance image series. After target monitoring, image preprocessing and noise reduction will be done to the moving target image to add clarity of the moving target and reduce the noise of the image. Then, the image will be segmented and the feature of stage performance will be extracted from the segmented target, which complete the process of the abnormal monitoring.
The abnormal behavior monitoring method mentioned is applied to the center of the city’s national song and dance in the stage performance, using PC, CCD camera, motors, and other control module acquisition stage image and H.264 digital video encoder shown in Figure 4, through the sensor network transfer stage image data, sending them to the computer memory. After the video image input, the function module of the system software is used to preprocess the image and reduce noise processing, segmentation image target, and extracting image features. According to the image movement target characteristics, the abnormal behavior monitoring and recognition of stage performance is realized.
Concrete proposal
The monitoring stage scene has variability. If the background is not changed in time, it will have an impact on the target monitoring of the stage performance. So it is necessary to update the background in real time. This article adopts the method combined background subtraction with the weighted threshold value factor, 11 which is able to filter the particle swarm of chaos searching to find the parameters of the weighting factor.
Segmenting target based on the weighted threshold value background subtraction method
Set the pixel of the stage perform digital image to be M × N. The background image sequence is set to be
The average

The background image of the next frame is

If
The value of
Denote by

Compare the pixel of the current background image with the pixel of the initial background image and multiply by the weighted harmonic to get the threshold value. Then, the problem that the pixels change with the noise is solved and the clarity of the background image of the sample is retained to an extreme.
Moving target monitoring using particle swarm optimization algorithm based on chaos searching
When target detection of stage performance behavior is in progress, the chaos searching algorithm is integrated into the particle swarm optimization algorithm, that is, if the locally optimal solution problem appears in the particle swarm optimization algorithm, 14 the chaos searching algorithm would be adopted to obtain the global optimal location. The locally optimal solution will be filtered out and the locally optimal solution problem is assured to not appear, which enhances the convergence efficiency of the algorithm. The process is shown in Figure 7:
The initialization of all the parameters: denote by
Evaluate the adaptation of all the particles to the targets. Lock the optimal location Pj that the jth particle has found and the optimal location Pg of the entire particle swarm up to now.
Combine equations (1) and (2) to imply iteration for particles in the particle swarm. If the current optimal individual is in the scope of the convergence condition or the maximum number of iterations has been reached, run process (5).
If the optimal location Pg of the entire particle swarm has not changed or only slightly changed after T times iteration, denote
The evolutionary process is finished and the global optimal solution is returned. The fitness function of the uniformity measure optimization
15
is introduced to get the optimal threshold value for image segmentation. Assume that the image is divided into two parts with threshold value t, where the two parts are represented by

where

Denote by
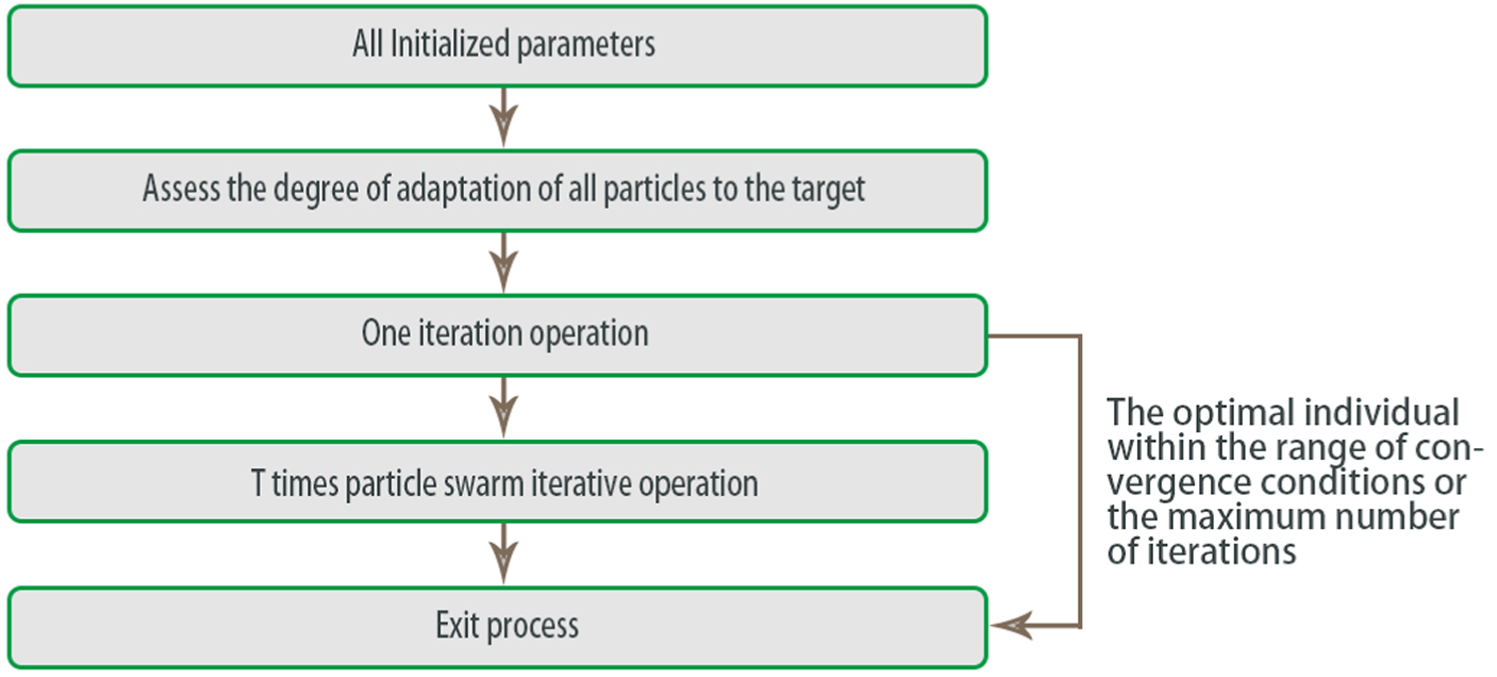
Particle swarm optimization algorithm for moving target monitoring flowchart.
Target tracking of the stage performance based on the mean shift algorithm
This article uses the mean shift algorithm to realize the target tracking of the stage performance, which is able to deal with the occlusion problem of moving targets and the problem of information missing. The edge feature of the moving target is collected with LOG operator detection method and is tracked using the mean shift algorithm. Then, the subsequent position prediction is done basing on Kalman filtering. The mean shift algorithm provides non-parametric prediction using density gradient. It provides efficient iteration via optimization of the probability density function of the pixel feature point when tracks the moving target frame and can obtain the local maximum of the density function, 16 complete high-efficiency orientation of the moving target, and adapt to the complex motions of the stage performance target such as deformation and rotation.
Set
where

Described by
The mean shift algorithm draws the colored histograms of the target model and the alternative model in the first place and then realizes the target tracking after analyzing the similarity of the two models. The flow is shown in Figure 8.

The stage performance target tracking based on mean shift algorithm.
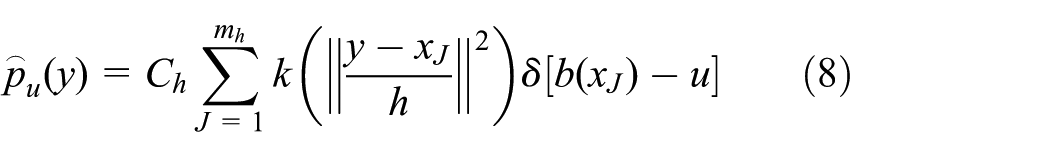
The modeling of the target
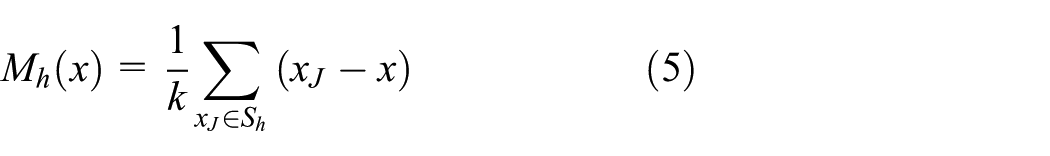
Use stage performance detection to divide the moving targets into several regions. The regions are selected according to the gray or colored histograms of the moving targets. If the center of the object is
The chosen of the candidate target
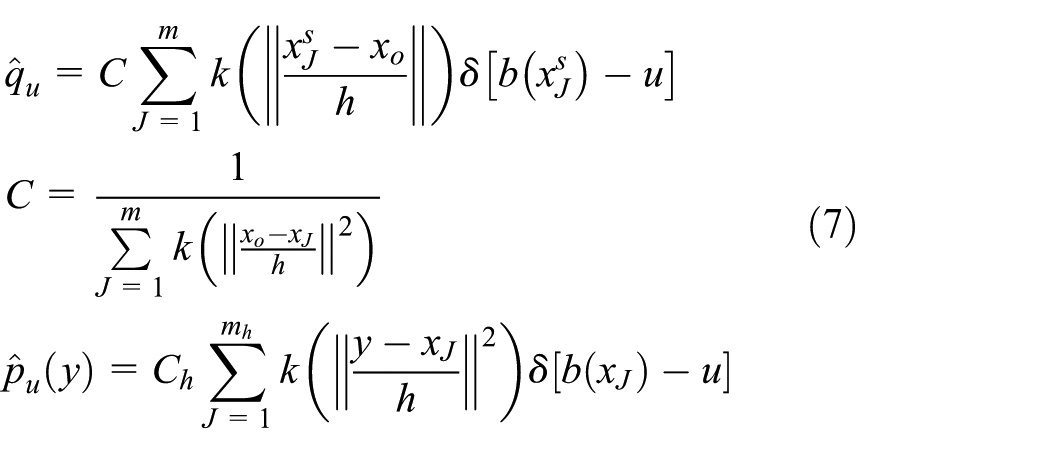
After the moving object detection, the target region that moves more intensely will be regarded as the candidate target. The center coordinates of the target range kernel function is y and the sum of the pixel points in the target region is
in which

is a normalization constant. Then, the target can be regarded as the process to get a optimal y and guarantee the maximum similarity of
The likelihood function
Compute

The value range of
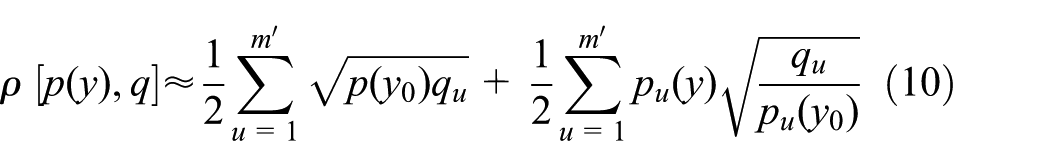
Putting equation (9) into equation (10) implies


The computation of the offset vector
The optimal mean shift vector is computed using the Bhattacharyya coefficient. The vector is the change of position of the moving target in stage performance. The optimal position

The abnormal behavior detection method based on LLE and sparse description
Method and procedure
The detection of the abnormal behavior in stage performance can be seen as the classification process of the time-varying data, which compares the input sequence with the set of reference behavior sequence. The abnormal behavior in stage performance is a complex abnormal behavior, which needs the auxiliary model to describe the behavior of stage performance as comparison to complete the accurate recognition of abnormal behavior in stage performance. Since the behavior characteristic of stage performance has three properties: high-dimensional, large amount of data and dynamic change of the local manifold structure, the characteristic recognition of the abnormal behavior is completed with the abnormal behavior detection method based on LLE and sparse description. This kind of method gathers the characteristics of the movement via optimized spectroscopic flow algorithm, which divides each frame image into several blocks, collects the low-dimensional behavior characteristics, classifies the behavior characteristics via LLE and sparse description, 17 and deals with the dynamic change of the local manifold structure through adding the LLE regular term to the sparse classification model. The identification function of the samples is greatly enhanced since the regular term of the LLE retains the local manifold decoupling of the test samples to the maximum. The procedure of the algorithm is shown in Figure 9.

Procedure of the abnormal behavior detection method based on local linear embedding and sparse description.
Sparse description of the stage performance behavior
Sparse description algorithm based on
Set M classes with marked difference. Assume that there is

in which

in which
Sparse description based on LLE
LLE is a kind of manifold learning algorithm. The algorithm assumes that the samples are obtained from smooth manifold. A sample in low-dimensional area can be described with the linear combination of several neighboring points, and the algorithm ensures that the local linearity of the high-dimensional samples is steady. If the data set of the stage performance is
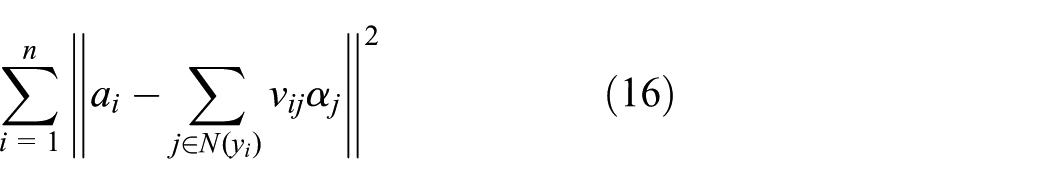
in which

Then, formula (17) can be rewritten as

in which I is the unit matrix and

Plug equation (18) into the sparse description implies the sparse description based on LLE

in which
The sparse description coefficient
The

If there exists stable vector

In which

Then,
The detection of the abnormal behavior in stage performance
The category of the test samples can be gotten basing on the computed sparse description coefficient

in which the non-zero coefficient in

Due to the high-dimension disturbance of the performance characteristics of the stage performance, the marking of the performance training samples in the real detection process is complicated. In this situation, equation (23) is over-determined. Raising the dimension of D and using the

in which

and
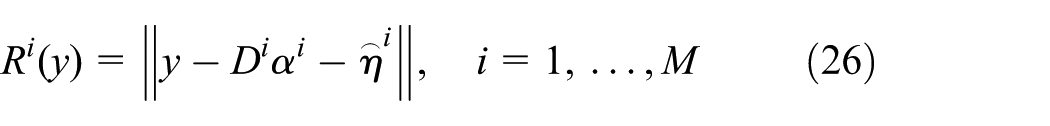
The minimum residual error algorithm to get the category of y is

The above sparse description classification algorithm cannot give accurate description of the local manifold structure of the sample of the stage performance behavior. 18 In order to enhance the classification accuracy of the algorithm, this article adopts the sparse description method which is based on LLE to increase the accuracy of the detection of the stage abnormal behavior. The specific procedure is as follows.
Input: the training sample matrix

with M categories in total. The test sample

For
Step 1. Take normalization of the training samples and the test samples.
Step 2. Solve the sparse description problem basing on LLE and get the sparse description coefficient
Step 3. Compute the error
end for
Output:
Experimental analysis
Analysis of feature recognition rate of abnormal behavior of stage performance
Experiment 1
As shown in Figure 10, the data are the stage performance video in a city’s national art center taken by Sony HVR-V1C camera. The size of each frame of the video is 360 × 240. There are a large number of abnormal stage performance behaviors such as falling done, pauses, stomping, wrong directions, and not enough height of jumping. To test the effectiveness of the proposed method, the method is employed after giving the video sequences of all the abnormal stage performance behaviors in the same background scene. Collect the 6 performance behaviors in Table 1 from 10 videos as samples. Take 65% of the feature set as training set and 35% as test set and obtain the training dictionary from the training of sparse model. After obtaining the sparse description dictionary and detecting the characteristics of the stage performance behavior from the video, classify the behavior characteristics through LLE and sparse description. The experiment uses 300 frames of the video as training sample and 150 frames of each kind of behavior as test sample.

The extracting result of the stage performance characteristics.
Training and test samples of the video sequence.

The experiment uses the Windows 7 laptop, with the configuration is Intel® Core™ Duo CPU T6500 3.2 GHz, 4 GB memory. The experimental software platform is MATLAB 7.2.1.
The experiment gives the comparison analysis of the monitoring method in this article, and the traditional method based on sparse description algorithm. The recognition rates of six behavior characteristics are shown in Table 2. It can be seen from Table 2 that the recognition rates of the proposed method in this article are higher than the traditional method.
Recognition rates of the traditional method and the method in this article.

The data in Table 1 include solo performance and multiplayer interactive performance. Solo performances of 25 persons are taken together with one or two multiplayer interactive performances for each two persons. The training results of the stage performance behavior with traditional method are shown in Figure 11. Desired error is achieved if the training times is 140. For comparison, Figure 12 gives the training results of the proposed method in this article, which achieves the desired error when the training times is 60. It is clear that the proposed method in this article is more efficiency.

Training results of the traditional method (horizontal line: the desired error).
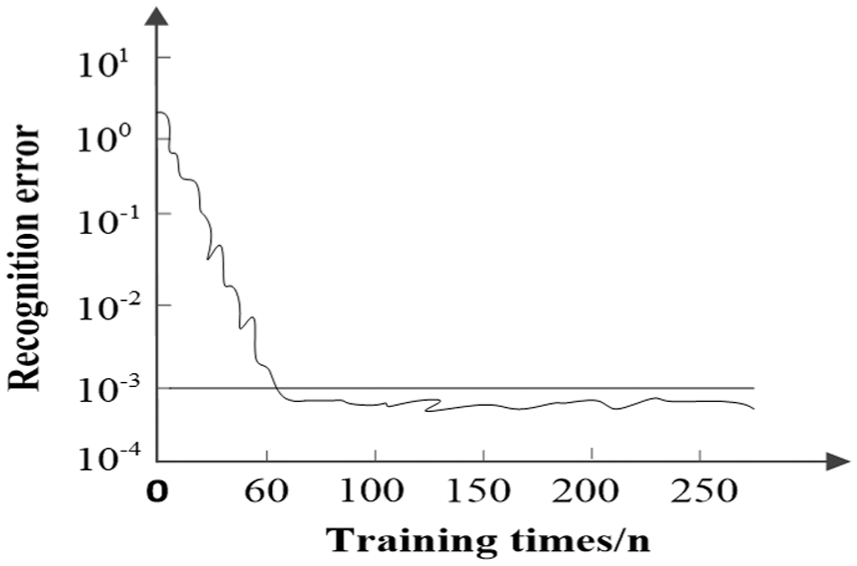
Training results of the method in this article (horizontal line: the desired error).
Experiment 2
Take the D-Harris interest points as the characteristics of the stage performance. Apply the proposed method in this article to some YouTube data bank of stage performance behavior to monitor abnormal behavior. The recognition rates of different abnormal characteristics using the proposed method in this article is given in Table 3, in which HNF abnormal stage performance characteristics is the combination of histogram of oriented gradient (HOG) and histogram of optical flow (HOF) characteristics. It can be seen from Table 3 that the HNF characteristics are with the highest recognition rate of 83.36%. The recognition rate of HOG characteristics is 77.91% and the recognition rates of motion boundary histogram (MBH), HOF, and IMHCD characteristics are lower than 75%.
Recognition rates of different abnormal characteristics with the proposed method in this article.

MBH: motion boundary histogram; HOG: histogram of oriented gradient; HOF: histogram of optical flow.
To test the influence of the quantity of samples to the recognition rates, Table 4 gives the recognition rates of the HNF abnormal characteristics using the proposed method in this article with different quantities of samples.
Recognition rates (%) of the HNF abnormal characteristics with different quantities of samples.
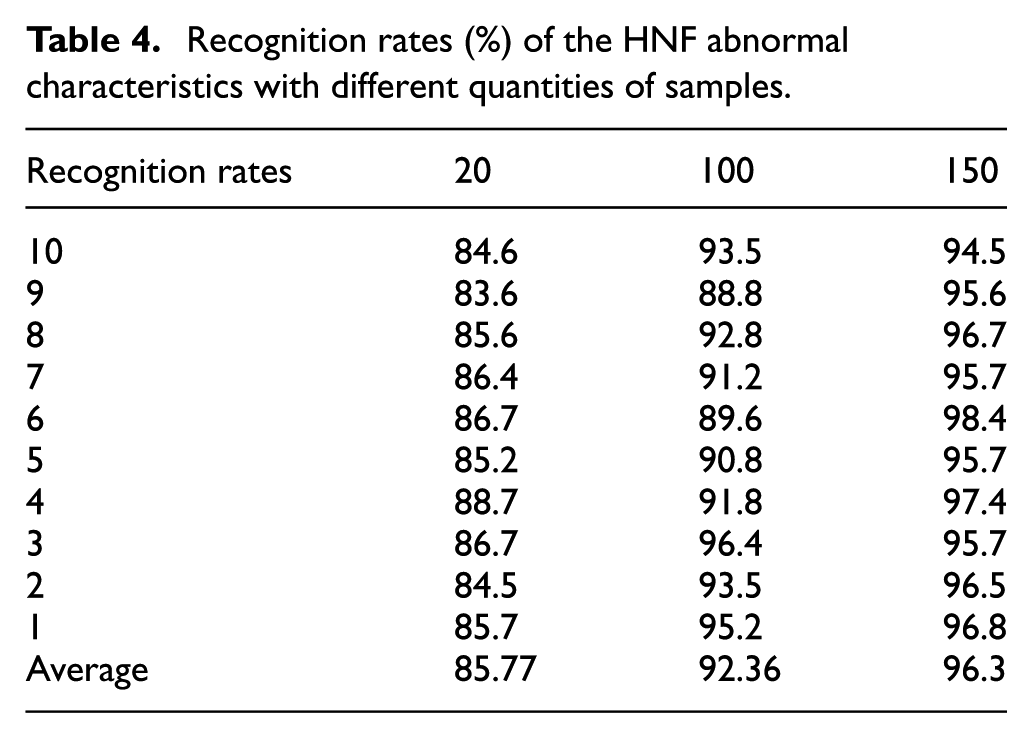
It can be seen from Table 4 that the quantity of samples has influence on the recognition rate. The recognition rate increases with the increase in the quantity of samples. The average recognition rate is 96.3% when the quantity of samples is 150 and the average recognition rate is 92.36% when the quantity of samples is 100, which shows the efficiency and robustness of the proposed method.
Conclusion
This article proposes the abnormal monitoring method of stage performance based on visual sensor network. The analysis is based on the structure of the proposed method and gives the design of the hardware structure and software system.16–20 The local manifold structure of the sample is analyzed using the abnormal behavior detection method, which is based on LLE and sparse description. That improves the efficiency and accuracy. From the comparison of the results of design experiments (Table 2–4, Figures 11 and 12), it can be seen that this method can improve the detection efficiency and accuracy of stage performance abnormality to a greater extent than the traditional method. In the future, it is proposed to introduce a deep learning algorithm to further improve the detection efficiency and accuracy of abnormal stage behavior.
Footnotes
Handling Editor: Jeng-Shyang Pan
Declaration of conflicting interests
The author(s) declared no potential conflicts of interest with respect to the research, authorship, and/or publication of this article.
Funding
The author(s) disclosed receipt of the following financial support for the research, authorship, and/or publication of this article: This work was supported by the Research Program Foundation of Minjiang University under grant no. MYK17021, the Major Project of Sichuan Province Key Laboratory of Digital Media Art under grant no. 17DMAKL01, and also the Fujian Province Guiding Project under grant no. 2018H0028. This work was supported by the National Natural Science Foundation of China (61772254), Key Project of College Youth Natural Science Foundation of Fujian Province (JZ160467), Fujian Provincial Leading Project (2017H0030), Fuzhou Science and Technology Planning Project (2016S-1116), Program for New Century Excellent Talents in Fujian Province University (NCETFJ), and Program for Young Scholars in Minjiang University (Mjqn201601).