
Abstract
In order to solve the problem of spectrum scarcity in wireless sensor networks, cognitive radio technology can be introduced into wireless sensor networks, giving rising to cognitive radio sensor networks. Delay-sensitive data applications in cognitive radio sensor networks require efficient real-time communication. Opportunistic pipeline routing is a potential technology to reduce the delay, which can use nodes outside the main forwarding path forward data opportunistically when the transmission fails. However, the energy efficiency of cognitive radio sensor networks with opportunistic pipeline routing is low, and the data transmission delay can be further optimized. In view of this situation, we propose the delay optimal opportunistic pipeline routing scheme named Variable Duty Cycle for Opportunistic Pipeline Routing (VDCOPR). In the Variable Duty Cycle for Opportunistic Pipeline Routing scheme, the nodes employ high duty cycle in the area far from the sink, and low duty cycle in the area near to the sink, which can achieve the balance of energy consumption and reduce the data transmission delay while not affecting network lifetime. The theoretical analysis and experimental results show that, compared with previous opportunistic pipeline routing, energy consumption of network is relatively balanced and the data transmission delay can be reduced by 36.6% in the Variable Duty Cycle for Opportunistic Pipeline Routing scheme.
Keywords
Introduction
Wireless sensor networks (WSNs)1–5 can obtain objective physical information and have a wide range of applications, such as urban management, 6 environmental monitoring, industrial control, 7 and e-Healthcare. 8 Traditional WSNs operate in the license-free spectrum. However, with the development of various emerging wireless communication technologies such as WLAN (wireless local area network), Bluetooth, and so on, the traditional WSNs are facing the problem of limited spectrum resources. In order to solve this problem, WSNs introduce cognitive radio technology which has the ability to sense the spectrum and determine the vacant bands. Cognitive radio sensor networks (CRSNs)9,10 emerge as the times require.
CRSNs enable the sensor nodes to sense the spectrum information in the surrounding environment in real-time, obtain the available spectrum resources, and dynamically select the unoccupied spectrum resources in the process of communication to complete the communication. 11 In CRSNs, the sensor nodes can dynamically select the idle channel, which can reduce the waiting and conflict due to the competition channel of nodes and shorten the network communication delay. However, a brief communication interruption is unavoidable in the spectrum switching because of the sensing and determination of the new available channels. Furthermore, the spectrum distribution is wide, the radio frequency (RF) front-end of the nodes may need to be reconfigured, which results in switching delay. All these have aggravated the delay of the sensor networks. In addition, the energy of the sensor nodes is limited,12–14 and spectrum sensing and spectrum switching consume extra energy. So, CRSNs still exist and aggravate the energy constraints of WSNs.
WSNs have limited energy,15–18 and most energy in the WSNs is used for idle listening.13,19 Thus, the duty cycle 20 is often used to save energy. The current common method to save energy is the low duty cycle mode with periodic listening/sleeping. In this mode, the node is in dormant state in most of the time to reduce the energy consumption of nodes. But this method results in sleep delay. However, many applications of CRSNs have very strict requirements for delay, such as coal mine monitoring, 21 and the communication links are unreliable in reality.22–25 In order to meet the low latency and high reliability of these CRSNs, an opportunistic pipeline scheduling (OPS) strategy is presented in Guo et al. 26 In this strategy, the sensor nodes are locally synchronized. The sending node first sends the data to the receiving node in the main forwarding path. If the transmission fails, the sending node will send the data through the opportunistic forwarding node outside the main forwarding path. And it can reduce the number of retransmission data. Data transmission is one of the key technologies in WSNs. And in this way of data transmission, the duty cycle plays an important role in transmission delay. When the duty cycle is large, the data transmission delay is small, but the energy consumption of the node is high, which affects the network lifetime. However, small duty cycle leads to large data transmission delay.
In this article, in order to make full use of the energy of the sensor nodes and reduce the data transmission delay in CRSNs, we propose a Variable Duty Cycle for Opportunistic Pipeline Routing (VDCOPR) scheme, which can minimize delay and improve energy efficiency of network. Contributions of the article are as follows:
Compared to the scheme where the duty cycle remains unchanged in the network, the idea of variable duty cycle is used to further reduce the network end-to-end transmission delay.
We make full use of the remaining energy in the network to improve energy efficiency, finding a balance between transmission delay and energy consumption to avoid energy waste.
The rest of this article is organized as follows: The “Related work” section shows the related works. The “System model and problem statements” section describes the system model and problem statement. “The design of VDCOPR” section elaborates on the main design of the VDCOPR scheme for CRSNs. The performance analysis in theory for VDCOPR is provided in the section “Performance analysis in theory.” The Section “Performance of VDCOPR scheme” describes the performance of VDCOPR. Finally, we conclude in the “Conclusion” section.
Related work
With the introduction of cognitive radio technology, CRSNs have a wide prospect in many applications, such as tele-medicine, multimedia applications, multi-class heterogeneous sensing applications, and real-time monitoring applications. 27 In order to meet the increasing demand, there are many studies on how to improve the network performance of CRSNs, such as delay and throughput. Because the performance of sensor networks can be significantly influenced by routing schemes, more and more researches have been devoted to routing mechanism of CRSNs.
In Spachos and Hantzinakos, 28 a scalable dynamic routing protocol for CRSNs is proposed. This protocol can dynamically change the paths and channels that are used for transmission in order to quickly adapt to any changes in network scalability. The simulation results show that in the complex indoor environment, compared with other common routing protocols, the proposed protocol achieves better performance in terms of packet delay, throughput, and energy consumption. A throughput-aware routing algorithm based on ISA100.11a for industrial sensor networks is proposed to enhance throughput and decrease end-to-end delay in Quang and Kim. 29 In the proposed routing algorithm, the data can be forwarded to the sink through the optimal path. The optimal path can be selected by estimating the maximum throughput of each path.
SPEED routing protocol 30 and multi-pipeline scheduling 31 are also proposed to reduce the delay. To some extent, SPEED routing protocol can achieve the end-to-end data transmission rate, network congestion control, and network load balancing mechanism. In the protocol, the link delay can be exchanged between nodes in order to determine the degree of congestion of the network. The link delay is the time between nodes sending data to the neighbors and nodes receiving reply from the neighbors. The next hop node for delay calculation of nodes is selected to ensure the delay of the route. A robust multi-pipeline scheduling with low-duty-cycle is presented in Cao et al. 31 When the wireless communication link is unreliable, the data transmission is easy to fail.31,32 At this time, the multi-pipeline scheduling scheme can switch the communication link between different pipelines to ensure normal data communication.
In recent years, more programs have been proposed, such as the adaptive energy-efficient staggered wake-up schedule in Lu et al., 33 the streamlined wake-up scheme in Cao et al., 34 the ladder wake-up scheme in Keshavarzian et al., 35 the fast path algorithm, 36 the OPS, 26 and so on.
We mainly study how to minimize the end-to-end transmission delay and improve the energy efficiency of the CRSNs, and propose a VDCOPR scheme. It can be seen from previous schemes that the nodes in the near-sink region have to bear the amount of data of all nodes in the peripheral area, so the energy consumed is high, and the nodes in the far-sink area consume low energy. Based on this situation, we take full advantage of the huge surplus energy of nodes far from the sink in the network. The nodes in the near-sink region employ low duty cycle for saving energy. At the same time, the nodes in the far-sink region employ high duty cycle for reducing the transmission delay. Therefore, VDCOPR scheme does not affect the network lifetime and the effective use of energy, while reducing end-to-end transmission delay.
System model and problem statements
Network model
WSNs can be used to support a wide range of applications in CRSNs, helping to reduce deployment costs and providing real-time data collection. 37 In some applications, WSNs need to detect narrow but fairly long ribbon areas,38,39 such as coal mine gas detection, river detection, 40 and pipeline testing. 41 This type of WSNs is called as strip WSNs (SWSNs). 26 SWSNs are deployed along a long detection area, which is usually a dozen hops, as shown in Figure 1. The nodes in the near-sink area can directly transmit data to the sink.

Network topology.
We make the following assumptions in our design:
The links between sensor nodes are unreliable. In other words, the data transmission on the links may fail because of noise and channel fading effect.
Sensor nodes are locally synchronized in the network. Therefore, sensor node can know when to send packets to their neighbor nodes based on their own wake-up timetable.
Each node in the network knows the link quality between itself and its neighbor nodes. Although the link quality between nodes is dynamically changing, we can approximate statistics for the nodes for which the link quality changes slowly.
Duty cycle model
For sensor nodes, replacing or recharging the batteries is extremely difficult. In order to save energy and as the events are less in number, it is a better way that nodes are set to sleep–wake cycle to execute their tasks periodically, that is, the nodes can periodically switch on and off according to a normalized duty cycle. The duty cycle (denoted as

where

Duty cycle model.
Energy consumption model and relevant definition
The power consumption of node is mainly composed of the following:
The power that is used to send or receive packets;
The power required to perform the Low-Power Listening (LPL) operations;
The power consumed in sleep state.
The main parameters of system model adopted in this article are similar to those in Hu et al. 42 The values of these parameters are listed in Table 1. Acknowledgement (ACK) is a transmission control character sent by the sender to the receiver in data communication transmission. It indicates that the data has been received correctly.
Network parameters.
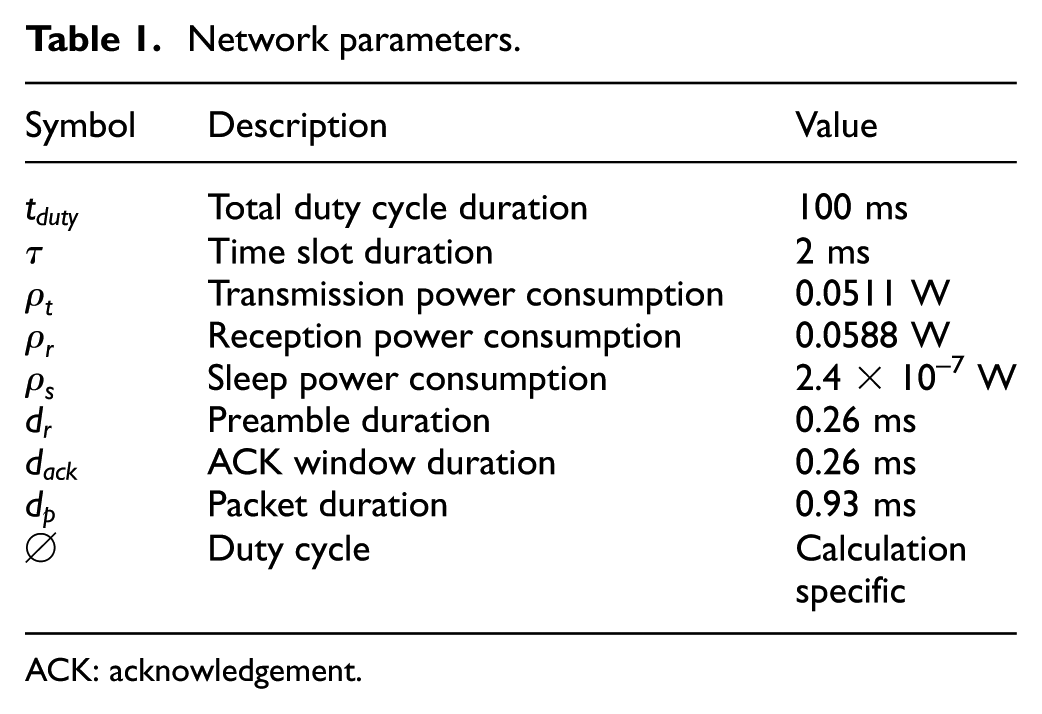
ACK: acknowledgement.
Problem statement
Effective utilization rate of energy is expressed as

Average Transmission Delay is the time from packets generated to the packets sent to the sink, expressed as D. Node

We increase the duty cycle of nodes in the near-sink region, thereby increasing the efficient utilization rate of energy and minimizing the average transmission delay. The objectives of this article can be expressed as follows

The design of VDCOPR
Research motivation
The main goal of VDCOPR is to improve the effective utilization rate of energy without compromising the lifetime of the network and to reduce the average transmission delay.
In the present study, nodes in the near-sink region need to carry data from nodes in other remote areas, and therefore the energy consumption is high, while nodes in the far-sink area consume less energy. When the network dies, the nodes in the far-sink area retain more than 90% of the energy. Network death refers to the death of the first node in the network. Once the node has died, the network performance will be greatly reduced; as a result of the network failure, it is difficult to achieve the desired detection results.
In the data transmission mode of the opportunistic pipeline routing, the duty cycle has an important effect on the delay. When the duty cycle is large, the data transmission delay is small, but the energy consumption of nodes is high, which affects its network lifetime. But a small duty cycle results in a large data transmission delay. The node duty cycle of the three schemes is given in Figure 3. As shown in Figure 3, in general, all nodes in the network use the same duty cycle, such as the OPS model, which retains more energy when the network is dead. The research of the Dual-QCon scheme has been proposed by increasing duty cycle of nodes to reducing the average transmission delay.

The simulated duty cycle of the nodes.
However, due to the upper limit of network lifetime, such a scheme is unreasonable. Because nodes near to the sink consume more energy, this further determines the network lifetime. Based on the above two cases, we adjust the duty cycle of the nodes using the remaining energy of the nodes in the network, which can improve the energy consumption rate and data transmission delay of the network.
Analysis of data size
We assume that there are three retransmission opportunities of packets during the data forwarding process.
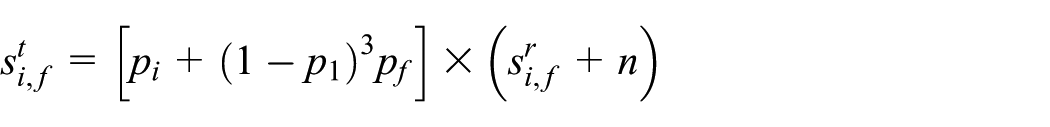
In the following forwarding path,
The symbol


where


Proof
Node

Data size received by z– 1-hop


Data size sent by z– 1-hop: data received by nz– 1 and produced by itself
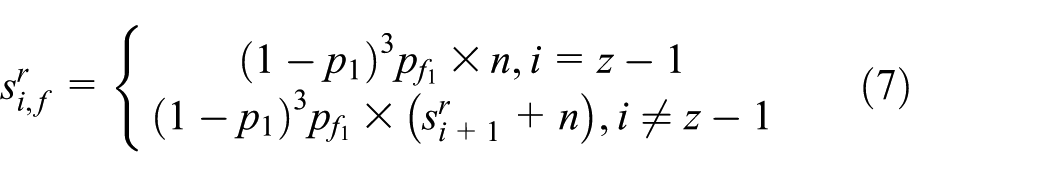
By analogy, data size received by node

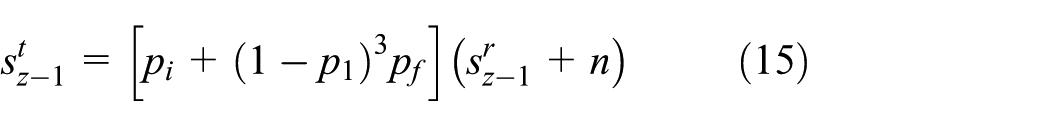
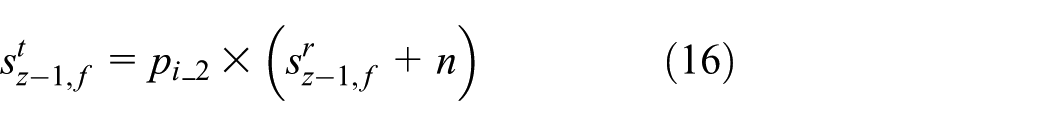
Data size sent by node

Data size received by

Data size sent by
From formulas (5) and (6), we obtain data size sent and data size received by the node
Analysis of energy consumption
The notations and descriptions adopted are listed in Table 2.
Notations.

LPL: Low-Power Listening.
Theorem 1
The total energy consumption (denoted as

Proof
The average energy of

where

where
The energy of the LPL operation can be calculated by the following formula

According to Vasuhi and Vaidehi,
43
we need to remove


According to the “Analysis of data size” section, we calculate the energy consumption of node
The energy consumption of the nodes.
Analysis of duty cycle
After calculating the energy consumption of the node, when all nodes in the network employ the same duty cycle, we can calculate the maximum duty cycle (denoted as
Assuming that

The larger the
Theorem 2
Assume in WSNs, for a certain flow

where


where
Proof
According to theorem 2, we can see that the maximum energy consumption of the flow

where
Similarly, the energy consumption of nodes

where
Then, we calculate the residual energy of node

When


By introducing equations (31)–(33) into equation (30), we obtain the exact values of

where

From equation (24), we get the maximum duty cycle for each node, and the result is shown in Figure 5. From Figure 5, we can see that the farther away from the sink, the greater the duty cycle can be increased, because of the more energy remaining in these areas. However, in some cases, not all of the remaining energy can be used to increase the duty cycle. For example, the remaining energy of the node at the 10th hop is the largest. In this case, we set the duty cycle to 1.

Duty cycle of the nodes.
Performance analysis in theory
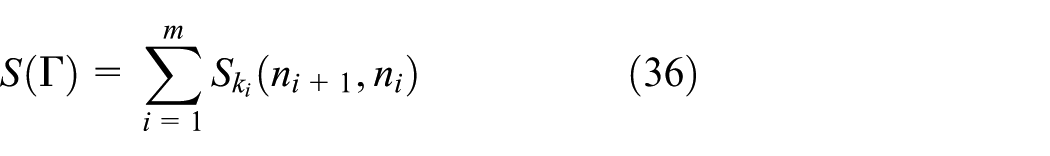
In order to clearly analyze the performance improvement of the VDCOPR scheme, we give a single pipeline scheduling, multi-pipeline scheduling, and OPS. Figure 6 shows an example of their single-hop transmission.

Single-hop packets transmission: (a) single pipeline, (b) multi-pipeline, and (c) OPS.
As shown in Figure 6(a), in single pipeline scheduling, each node has only one parent node and has only one retransmission opportunity in a working cycle. As shown in Figure 6(b), in multi-pipeline scheduling, each node has multiple parent nodes and multiple retransmissions in a working cycle. For OPS, an additional parent of a node can result in 2k retransmission opportunities in a working cycle, as shown in Figure 6(c).
Data transmission delay
We compare the expected transmission delay of OPS, multi-pipeline scheduling, and single pipeline scheduling.
Theorem 3
We assume that

Proof

Let
So, we can obtain

The end-to-end transmission delay is
With reference to formula (34), we obtain the expected delay of single pipeline scheduling, multi-pipeline scheduling, and OPS.
The expected delay of single pipeline scheduling is

The expected delay of multi-pipeline scheduling is

The expected delay of OPS is
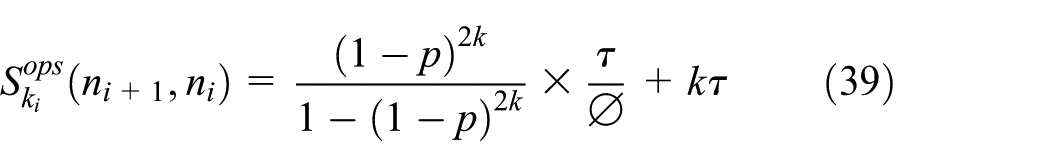
where

We assume that the link quality (denoted as p) of all links are the same, and p = 0.6, τ = 5 ms, and
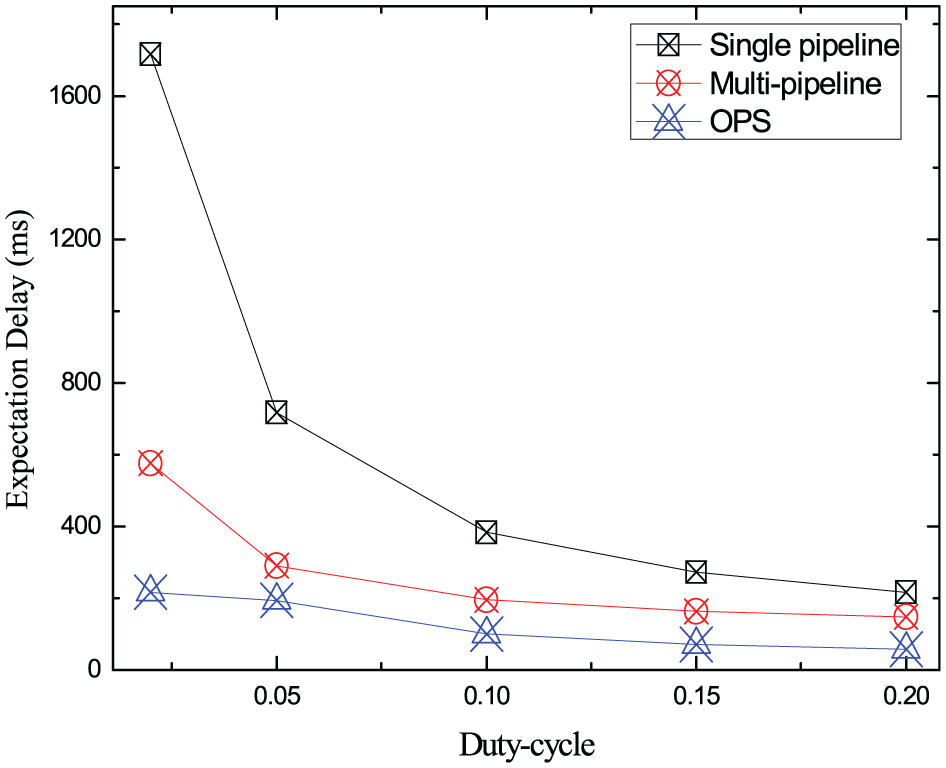
Expected delay with different scheduling schemes.
Energy consumption
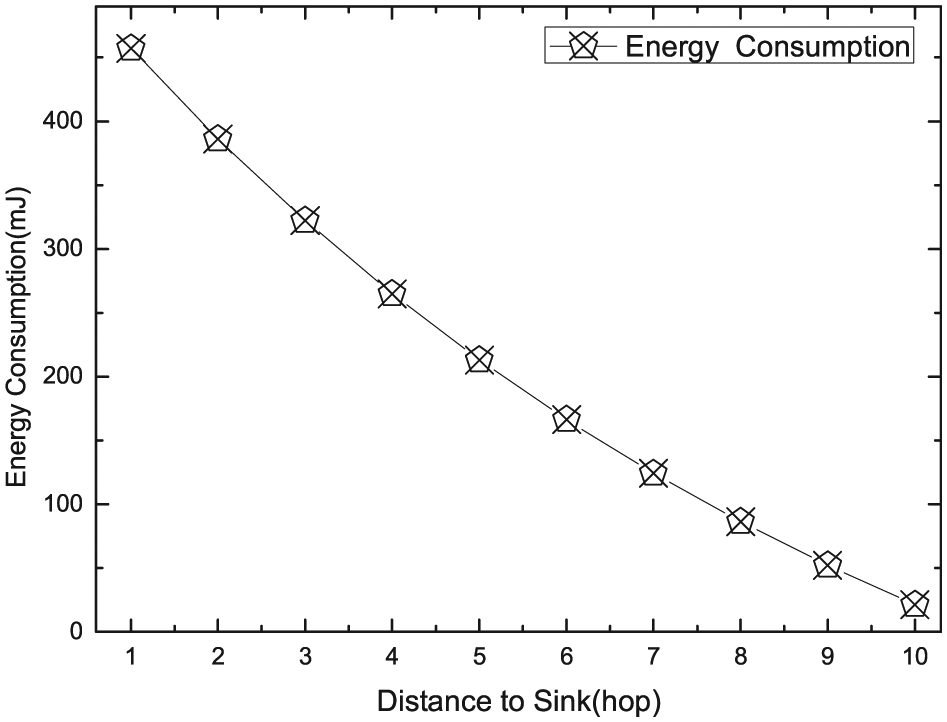
Figure 8 shows the energy consumption of nodes in different regions of the network used in data transmission. From Figure 8, we can see that the energy consumption of nodes in the near-sink region are relatively high for data transmission, while the nodes in the far-sink region are relatively low for data transmission. Likewise, Figure 9 shows the energy consumption of the nodes in different areas of the network for receiving data, which is similar to the energy consumption for data transmission.
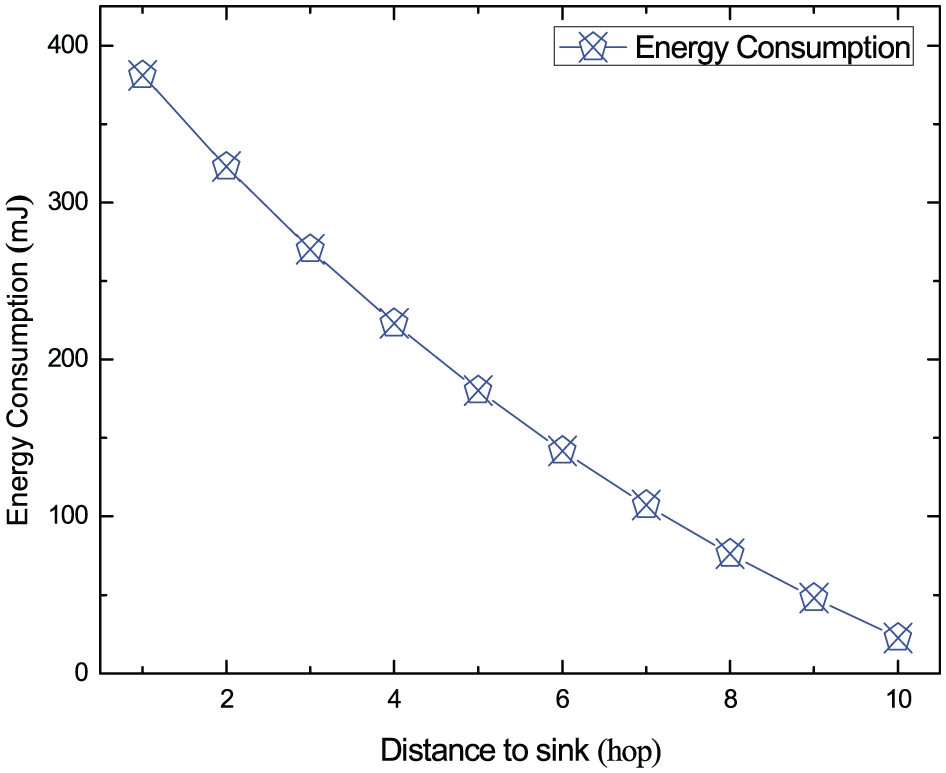
Energy consumption for data transmission.
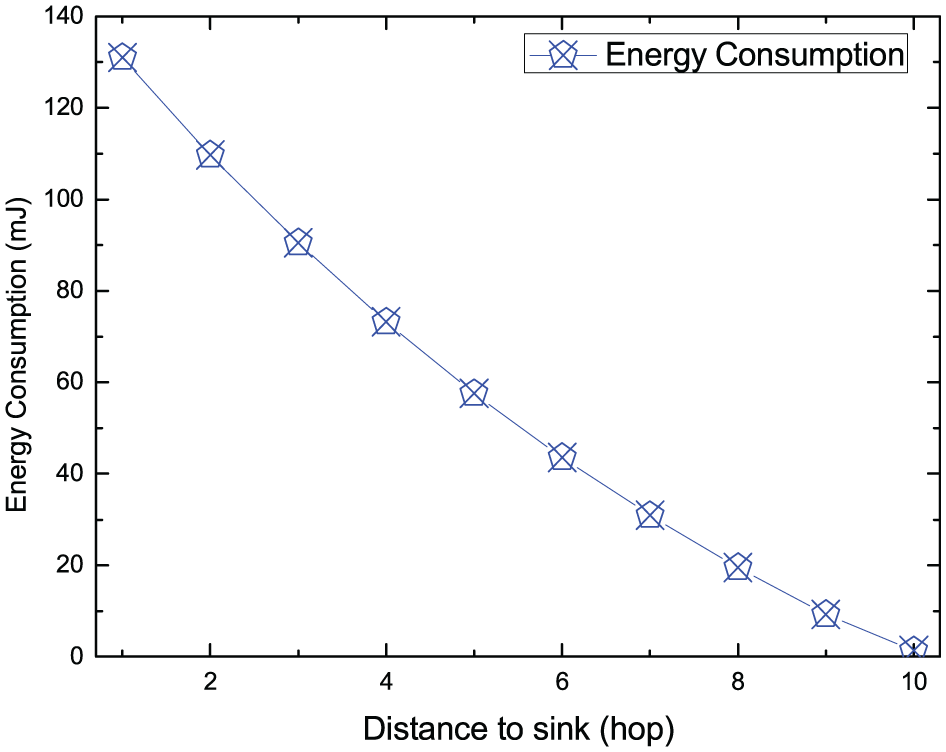
Energy consumption for data receiving.
From the above analysis, we conclude that when the nodes employ the same duty cycle in WSNs, the energy consumption of the near-sink region is much higher than that of the far-sink region. So the energy consumption in the network is not uniform. When the network is dead, the network still has a lot of unused energy.
Performance of VDCOPR scheme
In this section, we evaluate the performance of VDCOPR scheme in terms of energy consumption and data transmission delay, and we compare VDCOPR with OPS, in which all nodes in network adopt the same duty cycle.
Energy consumption of VDCOPR
Figure 10 shows the remaining energy in different areas of the network when the network is dead. We can see that the farther away from the sink, the more energy is left in the network, which means that the less energy is used, the lower energy utilization.
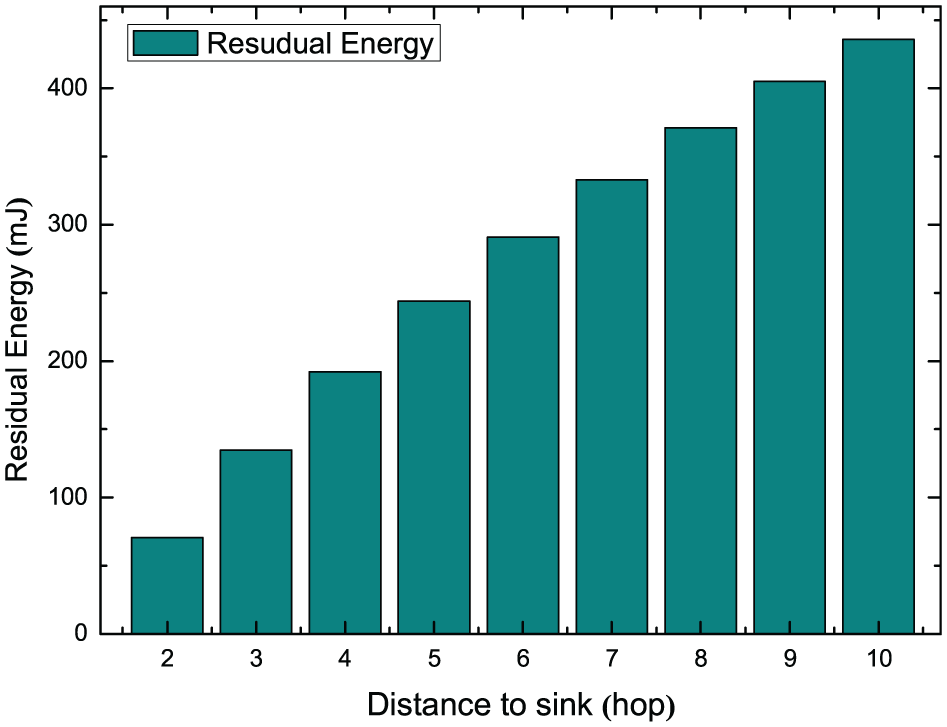
The residual energy of the nodes.
In order to clearly analyze the remaining energy in different regions of the network, we calculate the proportion of remaining energy and get Figure 11. From Figure 11, we can see that when the network is dead, the remaining energy in the far-sink region is more than 50%, and the remaining energy of the outermost node can reach 95%. We analyze that when the duty cycle is 0.1, the energy utilization in the network is only about 45.8%. So the energy utilization of the network is very low.
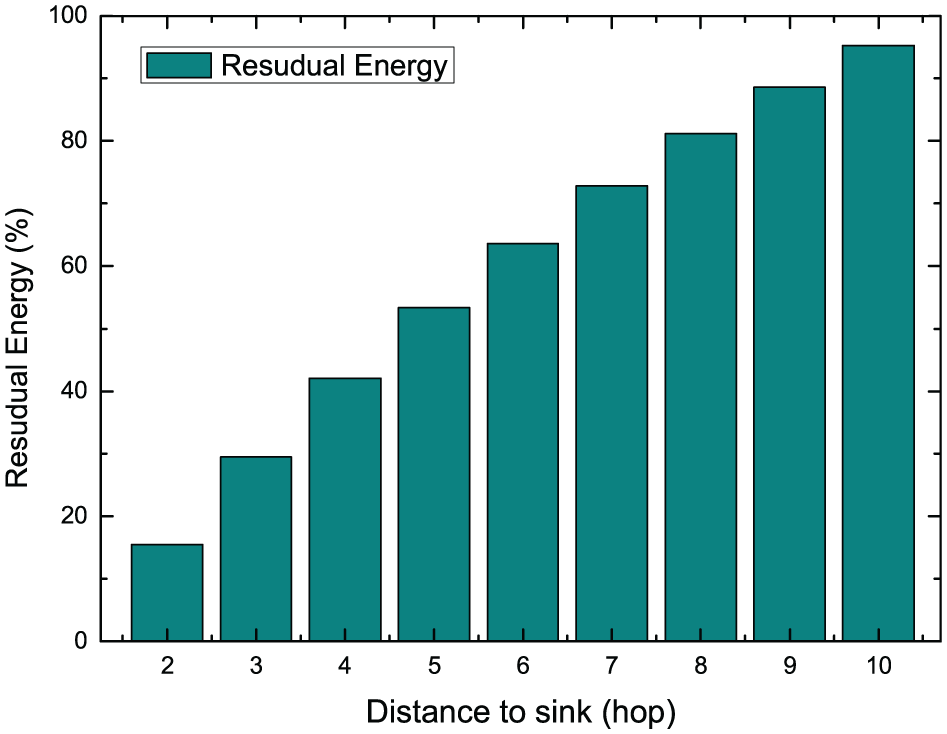
The proportion of the remaining energy of the nodes.
We give the energy consumption with different duty cycles, as shown in Figure 12. We can see that the greater the duty cycle is, the higher the energy consumption is, thus affecting the network lifetime.

Energy consumption with different duty cycles.
In VDCOPR, we use the remaining energy in the network to improve the duty cycle of the node in far-sink area. After increasing the duty cycle of nodes in the far-sink area, we recalculate the total energy consumption, as shown in Figure 13. We can see that the VDCOPR scheme can make full use of energy without affecting the network lifetime. However, as shown in Figure 13, there is a sudden drop in the energy between the 9th and 10th hop, because the energy consumption for data transmission of nodes in the outermost area is low and the remaining energy is the most. But not all these residual energy can be used to increase the duty cycle, we have to increase the duty cycle of nodes in the outermost area to 1. So there is a sudden drop of energy in the outermost area.
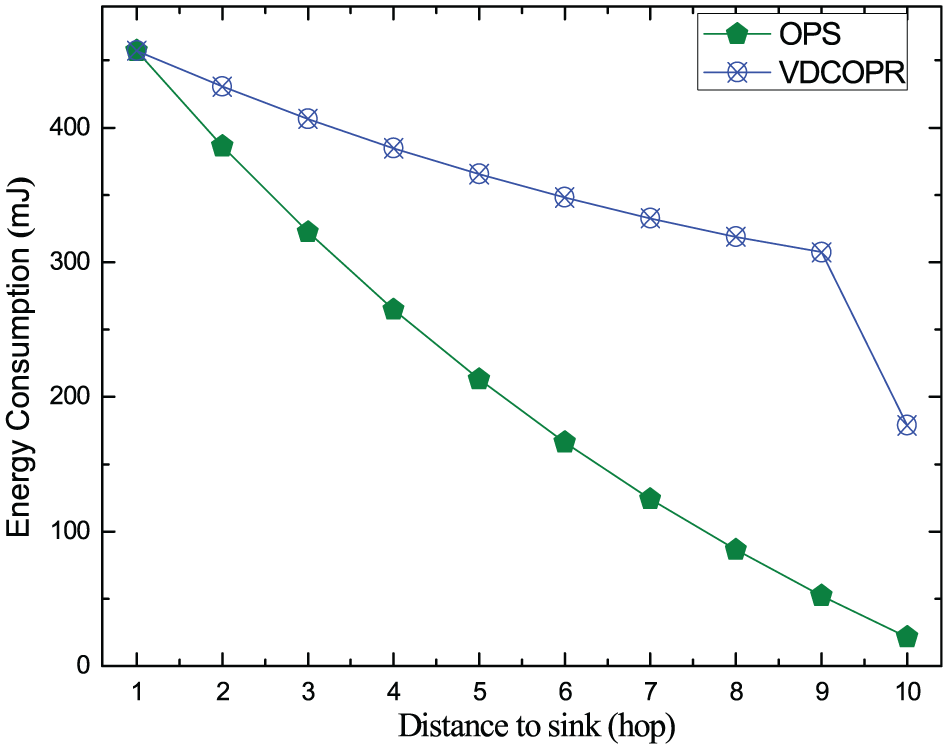
Energy consumption of the nodes.
Data transmission delay
In the following, we adjust the duty cycle of OPS according to analysis of duty cycle in “The design of VDCOPR” section. We calculate the one-hop expected delay of the nodes after adjusting the duty cycle completely, as Figure 14 shows. We can see that in the OPS scheme, the expected delay for one-hop expected transmission delay is constant. In the VDCOPR scheme, the one-hop transmission delay of nodes in the far-sink region is significantly reduced due to the large duty cycle of nodes in the remote sink region.
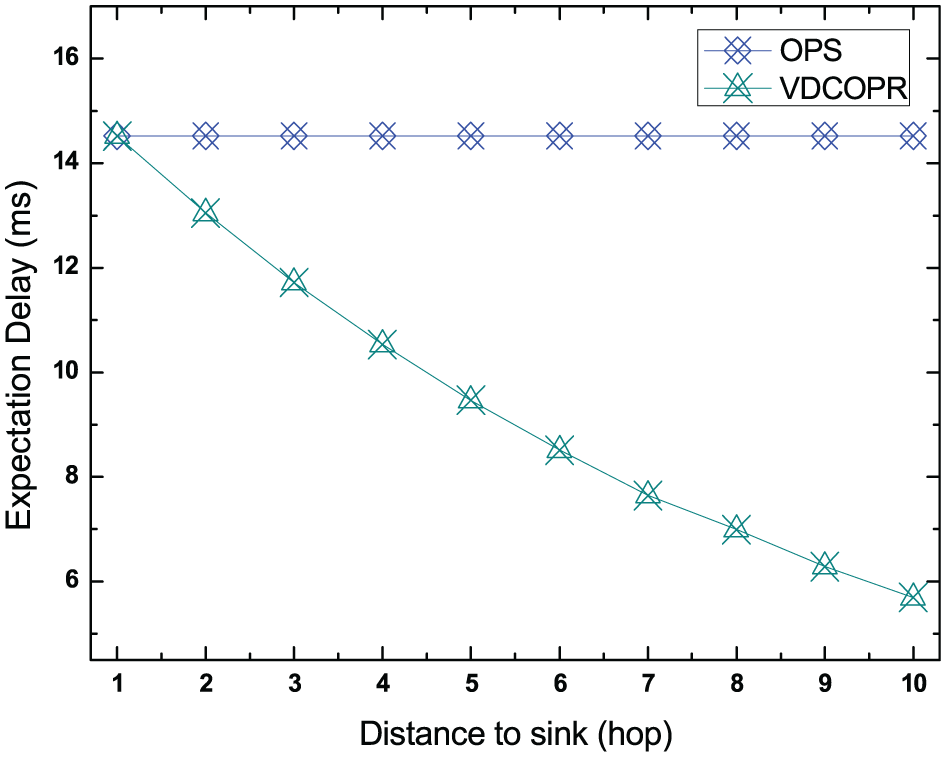
One-hop expected delay of the nodes.
By further calculation, we get the end-to-end transmission delay of OPS scheme and the VDCOPR scheme, as shown in Figure 15. The end-to-end transmission delay of the OPS scheme is proportional to the distance, the farther distance away from the sink, the greater the end-to-end transmission delay is. For the VDCOPR scheme, we can see that as the distance increases, the end-to-end transmission delay increases slowly. Moreover, the end-to-end transmission delay of the VDCOPR scheme is always lower than the delay of the OPS scheme, which further proves that the VDCOPR scheme can effectively reduce the data transmission delay.
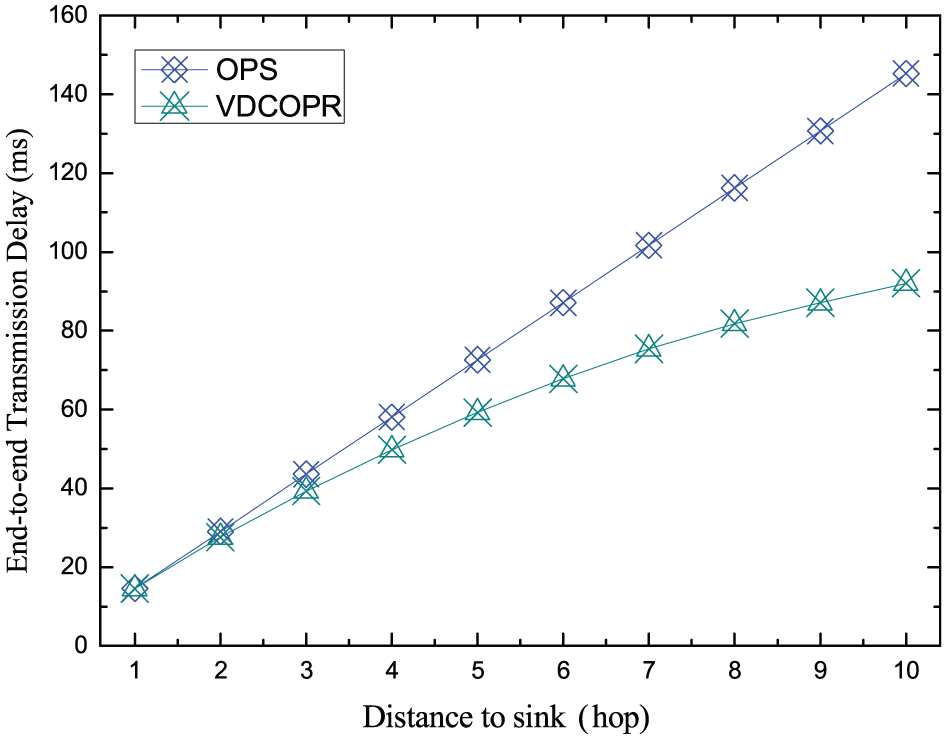
End-to-end transmission delay.
Conclusion
In this article, we validate the fragility of traditional single pipeline scheduling, and propose the variable duty cycle scheme for opportunity pipeline routing (VDCOPR) in the light of the characteristics of Cognitive Internet of Things. In this scheme, we make full use of the large amount of residual energy in the network; the nodes in the far-sink region adopt higher duty cycle to achieve the purpose of reducing the transmission delay and the nodes in the near-sink area adopt smaller duty cycle to save energy. Thus, the reliability of data transmission can be greatly improved, the energy can be effectively utilized, and the data transmission delay can be reduced without affecting the network lifetime. In the case of using VDCOPR scheme, the energy consumption of the network is more balanced and the data transmission delay can be reduced by about 36.6%.
Footnotes
Handling Editor: Tao Han
Declaration of conflicting interests
The author(s) declared no potential conflicts of interest with respect to the research, authorship, and/or publication of this article.
Funding
The author(s) disclosed receipt of the following financial support for the research, authorship, and/or publication of this article: This work was supported in part by the National Natural Science Foundation of China (61772554, 61572526, 61572528) and the National Basic Research Program of China (973 Program) (2014CB046305).