
Abstract
In this article, we propose a new indoor positioning algorithm using smartphones, where wireless signals and images are deeply combined together to improve the positioning performance. Our approach is based on the use of local binary patterns’ feature, which has the advantages of rotation invariance and scale invariance. Moreover, the term “uniform” are fundamental properties of local image textures and their occurrence histogram is proven to be a very powerful texture feature. Besides, the received signal strength acts as a reliable cue on a person’s identity. We first obtain a coarse-grained estimation based on the visualization of wireless signals, which are presented by a vector, making use of fingerprinting methods. Then, we perform a matching process to determine correspondences between two-dimensional pixels and three-dimensional points based on images collected by the smartphone. After being evaluated by experiments, our proposed method demonstrates that the combination of the visual and the wireless data significantly improves the positioning accuracy and robustness. It can be widely applied to smartphones to better analyze human behavior and offer high-accuracy indoor location–based services.
Introduction
With the growth of people’s indoor time, the demand for location-based service has also been increasing. Moreover, with widespread promotion of smartphones embedded with powerful RGB camera, the smartphone is becoming a highly effective platform for indoor positioning and navigation.1,2 However, because of the complex indoor environment, a single positioning method is difficult to obtain high-accuracy and robust positioning results for satisfying human’s demand. 3 To achieve this challenge, we propose a new indoor positioning method for fusing the wireless signals and the RGB images, which can be implemented on a smartphone.
To obtain a high-precision positioning result in congested situations, our major process is to fuse image and wireless localization information. For one thing, the RGB-based methods accurately locate individuals in the absence of occlusion, but positioning performance will decay in crowded environments. 4 For another, the occlusion problem can be solved with wireless signal data by calculating its received signal strength for reinforcing the image-based positioning method. 5
However, the fusion of the image and wireless information still includes two key problems to be solved: (1) the received signal strength indication (RSSI) is vulnerable to environmental factors and signal interference, causing severe precision loss or loss of availability and (2) RGB images lack depth information and suffer from strong occlusion issues.
Therefore, we use both the image and the wireless information to address the above challenges. This article proposed a positioning method combining a vision-based approach with a wireless-assisted approach. For clarity, we refer to wireless signals such as WiFi, Bluetooth, or beacon signals, as wireless signal data throughout the article. We can receive a stream of packets from each smartphone with WiFi module, including RSSI of the packets and MAC ID—a unique identifier. Then, continuous wavelet transform (CWT) is introduced as a wireless signal visualizing tool. CWT is completely different from discrete wavelet transform (DWT), and it is popular among physicists, whereas DWT is more common in numerical analysis, signal processing, and image processing. CWT is often used to characterize singularities in functions, and from this, it can distinguish between noise and signal. 6 We leverage the fusion information from RGB image feature matching results and wireless data to realize the localization in complex indoors.
The article is structured as follows: section “Related work” describes the research related to location positioning in an indoor environment that uses RGB images and imaging wireless signals. Section “Proposed algorithm” shows a graphic representation of the wireless signals, followed by human localization using fusion information of images and wireless signals. Section “Experiment and evaluation” contains a discussion of our results. Section “Conclusion” indicates the conclusion.
Related work
Mobile indoor positioning systems provide the information of indoor environment using a variety of sensors. Our work is related to the prior arts in the following fields including imaging wireless signals, RGB image-based localization, and fusing the RGB and the wireless signal information.
Wireless signal imaging–based localization
Huang et al. 7 explored the feasibility of obtaining computational imaging using wireless signal data. They leveraged multipath propagation resulting in wireless signal bouncing before getting to the receiver. They used the reflections lighting up the objects to image them and extract depth information where objects with different distances from the receiver can be identified. However, the system is limited by the size and material of the object, the imaging resolution is affected by the signal wavelength and the antenna array length, and the key constraint is the object orientation that WiFi transmissions in the surrounding reach an object only if that object lies within the radiation pattern of the transmitter. Viani et al. 8 focused on wireless localization of non-cooperative targets in security applications. The proposed approach has been designed for extracting the necessary information from RSS data.
The hologram is also a popular technique for recording and reconstructing three-dimensional (3D) objects. Holl and Reinhard 9 completed 3D imaging by phase-coherent recording of a two-dimensional (2D) wavefront. In their simulation, they could find both localization of emitters and 3D tomography of absorptive objects for hologram of a 10-m-sized building. However, the workload of tests and calculations is very large and the image quality should be improved.
RGB-based localization
There have been previous attempts at image-based indoor positioning whereby information is captured using smartphone cameras. Ruotsalainen et al. 10 presented a 2D pedestrian indoor navigation system using image-based processing method for providing head change measurements of a moving object. They used an extended Kalman filter to integrate information obtained from images and global navigation satellite system (GNSS), self-contained sensors, and so on. As a result, the positioning accuracy increased due to this visual-aided solution. But the accuracy was still to be improved. Liang et al. 11 used a 3D locally referenced image database for 3D indoor environment modeling. However, the calculation is large using scale-invariant feature transform (SIFT) descriptor, which results in high precision but lower speed. Möller et al. 12 presented an integrated interface of virtual reality (VR) and augmented reality (AR) elements with indicators, which is used for showing positioning results. The change in angle is very demanding in their system. Kim and Jun 13 proposed a vision-based positioning system using only AR technique for indoor navigation. But single visual-based positioning method is computationally intensive.
Indoor localization based on fusion information of one-dimensional wireless signal and 2D RGB I image
Researchers have shown that there are many shortcomings in indoor positioning using just a sort of sensor, which would result in low positioning accuracy, sensitive to complex indoor condition, and so on. Contrarily, the positioning methods based on multi-sensor combination can compensate for the deficiency of different types of sensors to achieve higher accuracy positioning results. Gallagher 14 combined relative motion information based on step detection with the wireless signal strength measurements by introducing a particle filter. However, the indoor positioning accuracy is bigger than 5 m, which cannot achieve the requirements of high-accuracy indoor positioning service.
Gallagher et al. 14 presented a system that uses a Kalman filter to fuse the information from various sensors that include magnetic field sensor and accelerometers on a mid-range smartphone. Vintervold 15 presented a vision-inertia integrated algorithm to estimate the accurate location, linear velocity, orientation, and sensor bias. However, this method was just tested in the laboratory and the estimation results were not optimized. Alahi et al. 16 used wireless signal emitted by personal cell phones to enrich RGB data. They proposed a new image-driven representation of wireless data, which means that they use a single image to represent all received wireless signal information. Then, the wireless signal visualizing data and the RGB images are fused to locate and track individuals by a sparsity-driven framework. However, the computation of this method is not efficient, which is different with our proposed method.
Therefore, we propose a fusion algorithm to combine the wireless signal imaging feature and RGB feature together to localize individuals with high accuracy. Figure 1 shows the flowchart of our algorithm.

The flowchart of our method.
Proposed algorithm
One-dimensional wireless signals’ fingerprint database build
In our method, it is known that we refer to WiFi and Bluetooth as one-dimensional (1D) wireless signals throughout this article. In particular, wireless fingerprinting has been attracting much attention recently because it does not require line-of-sight measurement of access points (APs) and achieves high applicability in complex indoor environment. In our experiment, a mobile device is conducted to collect the vectors of RSSI of all the detected WiFi signals from different APs at many reference points (RPs) of known locations. It is noted that an electronic distance measuring (EDM) device measures the location of wireless APs with high accuracy. The target position is estimated based on the most similar “neighbors,” the set of RPs whose fingerprints closely match the target’s RSSI.
1D wireless information visualization
In our positioning method, we formulate a relevant representation of wireless signals to efficiently fuse it with RGB data to locate individuals with enhancement information. Consequently, we use wavelet to transform the RSS to frequency domain as a wireless image (W-image).
The tag data are automatically captured when a person holding a smartphone walks around the indoor scene. We can alternately receive wireless signals from several different APs. That means, when we stand at a certain position, we can receive wireless signals from different signal transmitters. The received signal at time frame t is shown as follows
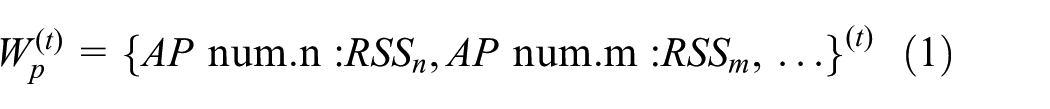
where
For further calculation, we should extract the signal strength sequence for the first step. Therefore, for each individual

where
Then our goal is to visualize the wireless information into 2D representations. As we know, there are some outliers due to noisy and anisotropic received signal strength.18,19 Therefore, we can make a curve of the RSSI streams in a period of time as shown in Figure 7. We chose to carry out the wavelet transform on
The CWT of a received signal

where
The mother wavelet is Haar wavelet and a single rectangular wave within the range of [0, 1], which is given as follows

The principal purpose of the mother wavelet is to supply a source function to create

A specific selection for scaling and shift parameters (dyadic pyramidal scheme), an orthonormal basis is composed by Haar wavelet 22

Our raw data are a time series

where
Using CWT, we can decompose the received time series into Haar components which can determine a unique representation of a position. Haar representation is directly suitable for comparison purposes as the absolute values of the time series are relevant. It is noted that seven level scales are selected in our article. Different scales of wavelet transform can produce an image pyramid, so we can get a W-image which shows the reduced database of time series and the characteristics of the database. After being decomposed, W-image can be further fused with the RGB features.
Modified local binary pattern image feature extraction
After obtaining W-images, the next step is to fuse RGB information and wireless signal data together to reduce large errors and push the limit of wireless data–based approaches. Sometimes, in different locations, we can receive the same RSSI value, but the surrounding scenery is different. So we use the integration of two features to achieve staff positioning. We believe that RGB data can accurately estimate relative positions and angular coordinates with respect to the smartphone, whereas wireless signal can provide the position of an individual and better address ambiguities in the presence of occlusion. Here, we use uniform local binary pattern (LBP) as a texture descriptor for RGB information. 23 The invariance of gray scale and rotation makes LBP an outstanding texture descriptor. It has been widely used in object detection.
The uniform LBP we used is defined as
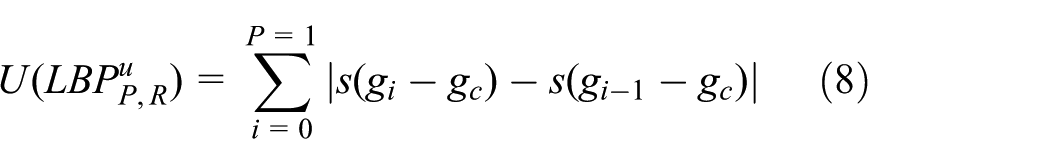

where
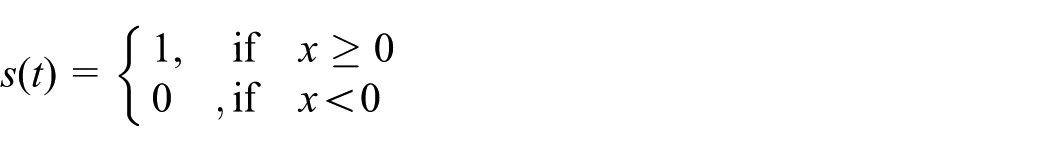
where the notation
Then we project the pixels in the block with a different block and all the uneven patterns into a box. Moreover, a 59-dimensional (59D) vector can be obtained including 58 uniforms and one class that is made up of other models. For a 64 × 128 detection window, all vectors of blocks in the window are connected to a uniform LBP feature vector. The procedure of extracting the LBP features is shown in Figure 2.
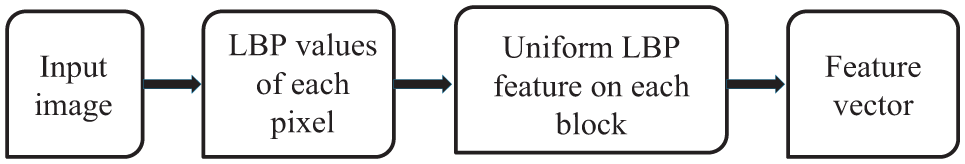
Extraction of uniform LBP feature vectors.
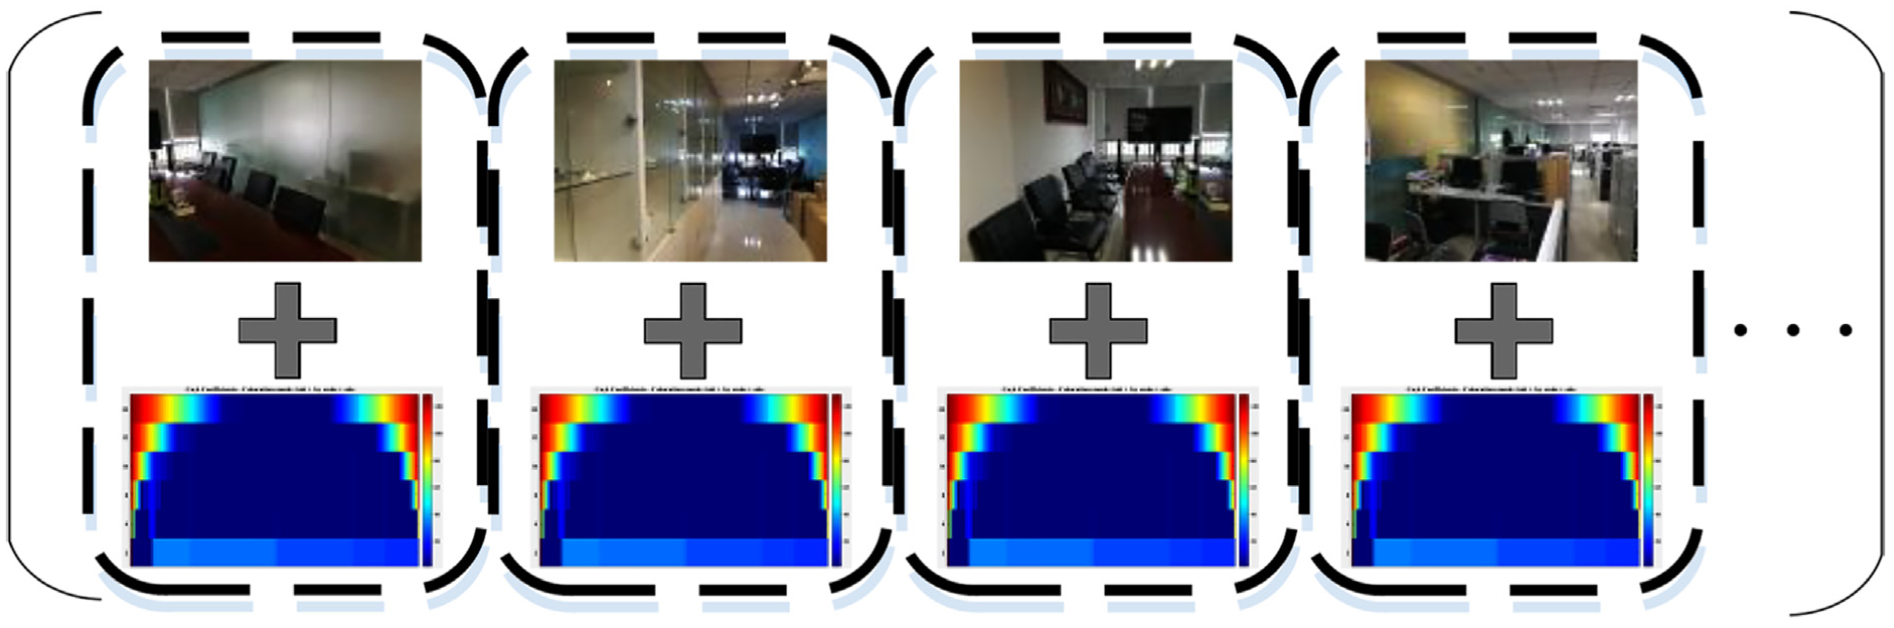
Fusion of W-image and RGB image
In the previous section, we have analyzed the characteristics of the two types of signals. Here, we will show the pedestrian localization framework—how to deeply combine the W- and RGB image to estimate pedestrian’s position. It is noted that we regard it as an inverse problem using a dictionary and a cascade of convex solvers. Moreover, LBP feature is extracted from 1D visualizing image and RGB image. Therefore, the two signals in different structures are fused in LBP feature dimension. The reason of regarding the fusion problem as an inverse problem is to solve equation (10). As we know, the calculation of indoor position is an NP-problem. 24 Moreover, to leverage wireless signals and RGB images, a dictionary is used to match W-image to RGB image, which is prepared for information fusion. Therefore, we should calculate equation (10) based on inverse transform.
Furthermore, the best subset selection problem is shown as follows

where
First of all, we build a dictionary
The demonstration of dictionary A.
After that in our experiment, the images are sparse because the person could only take one picture at a time. Thus, we capture several pictures from different orientations at one position, which leads to acquiring several genes in the dictionary for each location from four different directions.
Finally, observation vector

where
However, equation (10) is an NP-hard problem. Therefore, we have to leverage the multi-modal nature of our data to relax it, and the process is shown by Algorithm 1. In this section, the W information can offer extra prior on the desired solution such as the smaller area to locate, namely, the coarse location. We take advantage of that with a cascade of solvers. Moreover, we convert the NP-hard problem into a basis pursuit de-noise (BPDN) problem that is shown by equation (12)

where
Cascade of convex

The greedy approach is used to efficiently approach the solution. The Lasso formulation is used to search genes which are in line with the observed fusion vector, which can decrease the searching space of candidate points.
Experiment and evaluation
System description
In the interest of verifying the fusion of image data and wireless information to achieve higher precision positioning in indoor surroundings, we carried out experiments at the New Research Building in Beijing University of Posts and Telecommunications (BUPT). First of all, we should build a dataset of RGB-W vector from test areas. All the experiments were done on the ninth floor which has a 2-m-wide and 60-m-long corridor. Besides, Room 908 is

Signal emitter: (a) a ceiling antenna and (b) a Bluetooth emitter.

Distribution of ceiling antennas in the ninth floor.
Each individual with a location request carries a smartphone to broadcast the RSS values to the server. In our experiment, the configuration information of our smartphone where our proposed algorithm runs is shown in Table 1.
The key parameters.

CPU: central processing unit; GPU: graphics processing unit.
RSSI distribution of maximum field intensity. According to the experimental data and simulation, we can make a heat map containing wireless signal strength (Bluetooth, WiFi, and so on). The distribution of the wireless signal intensity is closely related to the distance and the RSSI decreases as the distance increases. Figure 6 shows that there is some region of “brightness” around the ceiling antenna, fading away into the distance. As a result, the different signal strengths at different locations make it possible to locate a person. However, there are some points in Figure 6 where their RSSI is the same. It is noted that the coordinate axis of Figure 6 is the walking distance of our corridor. Therefore, we can find that it is not able to distinguish the different locations using only the W feature. So how could we distinguish the different locations on the ground? According to our research, we found that the images obtained from different locations are different, which means that the image features can be used to further improve positioning accuracy.

RSSI distribution of maximum field intensity.
When sampling at an RP, the receiving device alternately samples and stores signals from different APs. In our article, we fused 1D wireless signals and 2D RGB images to calculate high-accuracy positioning. To transform the wireless signals that are consequent in time into 2D image that is consequent in space, the wireless signals are collected every 100 ms. Moreover, we collected RGB images every few meters that are depended on the indoor environment. It is noted that we collect the image and wireless signals in the same regions. Figure 7 shows the RSSI stream of the receiving device (the smartphone equipped with a wireless receiving module). The W-image is then transformed using wavelet transform. The results are shown in Figure 8. Figure 8 shows the W-image captured by WT of an RSSI stream. The top color panel contains Haar decomposition with six levels including 2, 4, 8, 16, 32, and 64.

An example of the RSSI stream.

W-image.
Furthermore, we extract LBP features from RGB images captured from a smartphone camera. Finally, we use the pedestrian localization framework proposed in this article to calculate indoor locations.
Localization results
With many people walking randomly around, our trajectory is straight along the corridor, then into 908, and then a walk along the corridor to the end. We took pictures of the surroundings and we measured RSS values every few meters. The positioning results are shown in Figure 9. Obviously, Figure 9 shows that our positioning method produces the smallest amount of deviation and obtains a relatively satisfactory positioning result.

Positioning results under different positioning methods.
The performance of our proposed indoor location algorithm is evaluated by root mean square error (RMSE) between the real ground positions and their estimated positions. We compare the indoor positioning results of different location methods as shown in Table 2. It is noted that four state-of-the-art methods are introduced in our experiment. The first one is to achieve indoor positioning using a single RGB camera. 25 The second one is to obtain indoor positioning results using WiFi signals. 26 The third one is to calculate indoor positioning results based on Bluetooth signals. 27 The last one is to calculate indoor positioning results based on image and WiFi signals. 28 Moreover, to assess the three indoor positioning methods, we also set a path before testing those methods. We measured the locations of the selected points in the path at every 0.3 m in the X-direction and 0.5 in the Y-direction, respectively. Those locations are used as ground truth for evaluating the three indoor positioning methods.
Performance comparison of accuracy and efficiency.

RMSE: root mean square error.
Figure 10 indicates the comparison of positioning results in the X- and Y-directions, respectively. In Figure 10, all the indoor positioning values in X- and Y-axes are a coordinate that is positive. In addition, the positioning results obtained by the four state-of-the-art methods are worse than the ground truth, which means the location results are bigger than the ground truth. On the contrary, the positioning results based on our proposed method are appreciated to the ground truth. Therefore, the curves of the four state-of-the-art methods are always on the top of the ground truth, while the curve of our method is near to the ground truth.
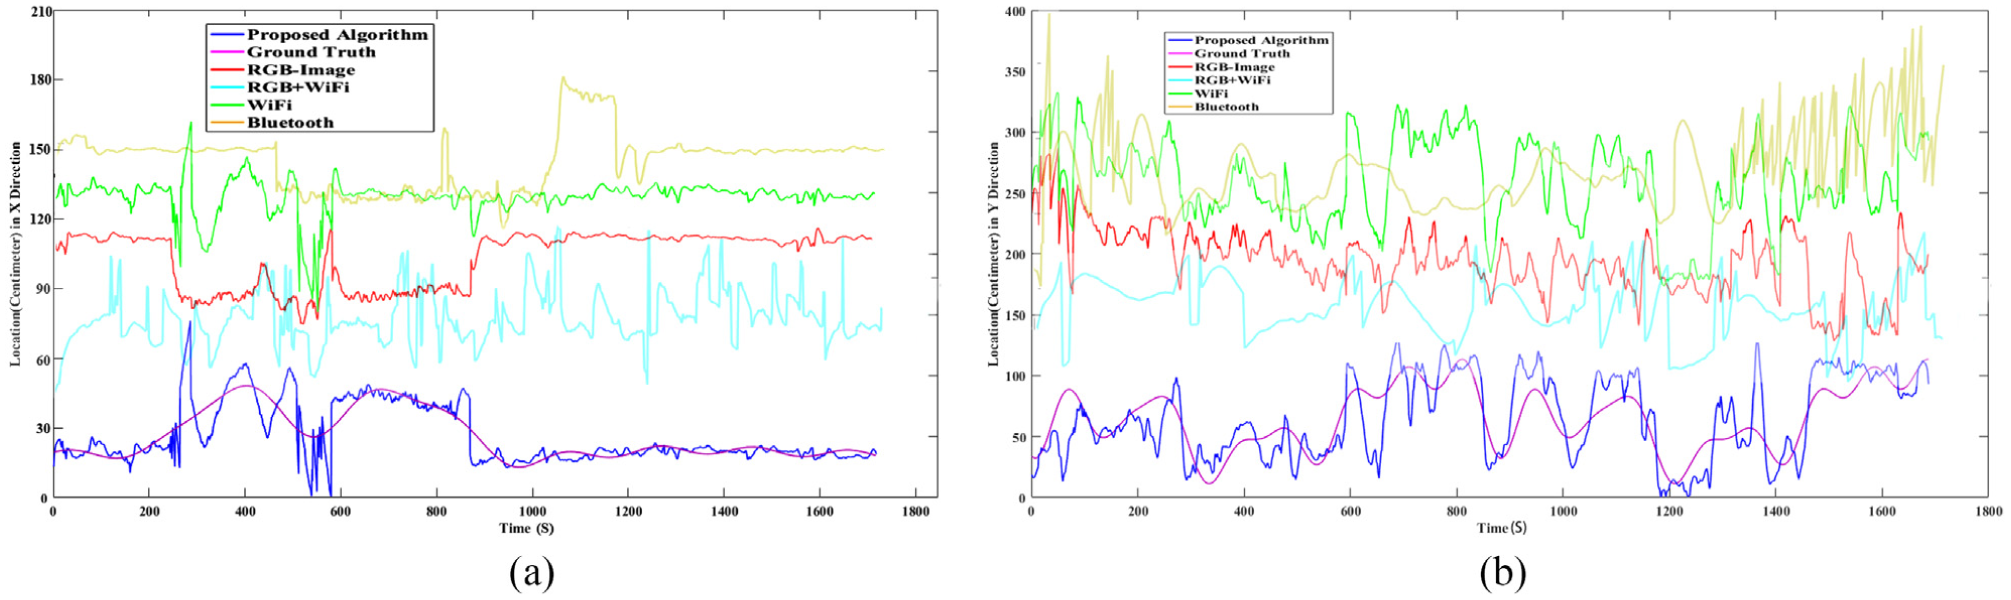
The comparison of positioning results in X- and Y-directions: (a) the positioning results in X–direction and (b) the positioning results in Y-direction.
According to Figure 10(a), we find that our method can obtain better positioning results than other two state-of-the-art approaches. Besides, in the X-direction, the positioning errors between our algorithm and ground truth are no more than 0.61 m. While this sort of errors between RGB image–based method and the ground truth is no more than 1.1 m. Moreover, the positioning error between the wireless signals and the ground truth is no more than 1.7 m. Therefore, we can find that the wireless-based indoor positioning is affected easily in the indoor experiment, which results in achieving a worse result than the other two methods.
Figure 10(b) displays the positioning error distribution in the Y-direction for the three methods. Similar to the performance in the X-direction, we find that our method can obtain better positioning results than the other two state-of-the-art approaches in the Y-direction. Furthermore, in the Y-direction, the positioning errors between our algorithm and the ground truth are no more than 2.83 m. On the other side, the errors between the RGB image–based method and the ground truth are no more than 2.63 m. Moreover, the positioning errors between the wireless signals and the ground truth are no more than 3.52 m. Therefore, we can find that the wireless-based indoor positioning is affected easily in the indoor experiment, which results in achieving a worse result than the other two methods.
Through comparing Figure 10(a) and (b), we can find that the positioning error distribution in the X-direction is smaller than that in the Y-direction. This is because of introducing the geographic information to refine the positioning error. The X-direction is the width of a building and the Y-direction is the length of the building. Most of our tests were implemented in indoor scenarios including corridor, so the biggest positioning error in the X-direction is less than 2 m.
The table shows that we evaluated the performance of wireless-based method by fingerprinting to further understand the localization error of wireless data. Besides, RGB-based method is implemented by the sparsity-driven formulation in the absence of wireless data. In addition, the indoor positioning method based on RGB–WiFi has a good performance in running time, but the positioning performance in accuracy is worse than our proposed method. It is because of the multipath. From the experimental results, we can discover that the proposed algorithm outperforms only based on one single positioning information. Our localization algorithm has a strong robustness and can bring about a precise estimation with RMSE = 0.83 m. In summary, the comparison outcome states clearly that the fusion method achieves higher precision than single positioning method.
Conclusion
A smartphone-based indoor positioning method is presented in this article. In this algorithm, the vision information and wireless imaging information are fused together to solve indoor human localization problem. The experimental results showed that images transformed from the wireless signals include more information, which improved indoor positioning accuracy with a smartphone integrated kind of sensors. In future, more work needs to be done on how to improve the performance in crowded surroundings like meeting rooms.
Footnotes
Handling Editor: Hassen Fourati
Declaration of conflicting interests
The author(s) declared no potential conflicts of interest with respect to the research, authorship, and/or publication of this article.
Funding
The author(s) disclosed receipt of the following financial support for the research, authorship, and/or publication of this article: The project was sponsored by the National Key Research and Development Program (no. 2016YFB0502002).