
Abstract
Wireless sensors produce large amounts of data in long-term online monitoring following the Shannon–Nyquist theorem, leading to a heavy burden on wireless communications and data storage. To address this problem, compressive sensing which allows wireless sensors to sample at a much lower rate than the Nyquist frequency has been considered. However, the lower rate sacrifices the integrity of the signal. Therefore, reconstruction from low-dimension measurement samples is necessary. Generally, the reconstruction needs the information of signal sparsity in advance, whereas it is usually unknown in practical applications. To address this issue, a sparsity adaptive subspace pursuit compressive sensing algorithm is deployed in this article. In order to balance the computational speed and estimation accuracy, a half-fold sparsity estimation method is proposed. To verify the effectiveness of this algorithm, several simulation tests were performed. First, the feasibility of subspace pursuit algorithm is verified using random sparse signals with five different sparsities. Second, the synthesized vibration signals for four different compression rates are reconstructed. The corresponding reconstruction correlation coefficient and root mean square error are demonstrated. The high correlation and low error result mean that the proposed algorithm can be applied in the vibration signal process. Third, implementation of the proposed approach for a practical vibration signal from an offshore structure is carried out. To reduce the effect of signal noise, the wavelet de-noising technique is used. Considering the randomness of the sampling, many reconstruction tests were carried out. Finally, to validate the reliability of the reconstructed signal, the structure modal parameters are calculated by the Eigensystem realization algorithm, and the result is only slightly different between original and reconstructed signal, which means that the proposed method can successfully save the modal information of vibration signals.
Introduction
The limitations imposed by wireless communications and data storage are currently the two main problems for a wireless sensor monitoring system. 1 During the sampling process, the wireless sensor followed the conventional Shannon–Nyquist theorem, which states that the sample rate must be at least twice the maximum frequency present in signal. 2 Therefore, a large number of sampling data would increase the burden of communication, storage and battery. Due to these limitations, wireless sensors cannot operate in a long-term online monitoring application. Generally, there are many proposals to solve the above problems including decentralized data processing, power saving strategies, and data compression techniques. 3
In recent years, many researches have explored using the compressive sensing (CS) scheme to address the data transmission and storage problem. Bao et al. 1 for the first time investigated the potential of CS for compressing real vibration data collected from Shandong Binzhou Yellow River Highway Bridge in 2010. The research compared the sparse ability of Fourier basis and wavelet basis. Although the compression rate is not high enough as we expected, it really a good engineering application of CS. Later, in 2012, Bao et al. 4 demonstrated a CS approach to recover lost data during transmission process of fast-moving wireless sensing for structural health monitoring on Jinzhou West Bridge and National Aquatics Center in Beijing. After that, in 2014, Bao et al. 5 continued to solve the potential data loss problem, which projected the raw recorded signal onto a random matrix via Imote2 wireless sensors on the Songpu Bridge in Harbin, China. In 2013, O’Connor et al. 6 carried out the first CS-based long-term random sampling scheme on the Telegraph Road Bridge in Monroe, Michigan. This work embedded a linear congruential generator (LCG) into a computational core of the Narada to produce the pseudo-random number and realized the accurate reconstruction. In 2017, R Klis et al. 7 presented a study of CS-based vibration monitoring via spectro-temporal for wireless sensor networks, which provided a step-by-step time-series recovery process and a cost analysis in comparison of wireless and tethered sensing solutions.
This article presents a CS-based low-frequency sampling data compression method to address the above-described problems. Compressive sensing theory was first proposed by DL Donoho 8 in “compressed sensing,” who states that sparse signals can be acquired by much less-than-Nyquist samples and reconstructed by an appropriate optimization algorithm. That is, a much smaller number of projections are used to express most of the information of sparse signals. However, in fact, most natural signals are not sparse in the time domain. They need to be transformed to an appropriate sparse basis such as Fourier basis and wavelet basis. The use of the transform to an appropriate basis can effectively sparse-express the different signals and a more sparse-expressed signal can enable the use of a higher compressive rate.
In the compression and reconstruction process, signal sparsity is one of the important input parameters that determines the compression rate and reconstruction accuracy. However, it is always unknown in the practical application, and therefore, a sparsity adaptive subspace pursuit (SASP) algorithm is used in this article. 9 Based on the CS theorem, the proposed approach would use a sparse criterion to estimate a sparsity value that is very close to the real signal sparsity and then input this value into the subspace pursuit (SP) algorithm to reconstruct the original signal. Because the estimated value may not accurate, it is adjusted in each iteration if it cannot satisfy the reconstruction error. After many iterations, the reconstructed signal satisfies the setting error threshold, which means that the reconstruction process is successful. Several simulation tests have proved that the SP algorithm with adaptive sparsity approximation can effectively compress and reconstruct the original vibration signal.
Wireless sensor–based structure health monitoring technology10,11 is effective in the identification of the health conditions of the structures. In healthy condition analyses, the structure mode identification and frequency response estimation are two main methods12,13 and both of them are based on the structure vibration signals. In this article, the vibration signals are collected from an offshore structure by tri-axial accelerometers. To verify the effectiveness of the proposed method, the reconstructed signal is compared with original signal both in time and frequency domain, and the structure modal parameters are also calculated by Eigensystem realization algorithm (ERA) method.
Compressive sensing
For an n-dimension signal

then the signal

Here
Mathematically, CS is actually performed using a measurement matrix

where

where

This equation holds for all
According to equation (4), the process of solving sparse vectors can be summarized in the form of an optimization problem

where
SASP algorithm
The SP algorithm is an improvement of the matching pursuit (MP) and orthogonal matching pursuit (OMP) algorithms. Many experiments have verified that the SP algorithm, proposed by Dai and Milenkovic,
15
can achieve a fast and accurate reconstruction from sparse signals by any sensing matrix which satisfies the RIP condition. The most important step of the SP algorithm is to determine the correct subspace. The SP algorithm selects
When the sparsity is unknown, the sparseness criterion is used to give a large initial value and then approximate the sparsity with a small step rate. Then, the strategy of updating the support set according to the residual is adjusted, so the real sparsity can be estimated accurately. The steps of this algorithm can be divided into two parts.
Part I: assuming that the sensing matrix
where
Part II: in each iteration of the SP algorithm, if the change between the old and the new residuals is not too large, it means that the index support set does not contain all the non-zero elements. That is, the estimated sparsity is smaller than the actual sparsity. Therefore, in the next iteration, the number of elements in the index support should be increased to accurately estimate the actual sparsity.
In the SASP algorithm, the input parameters include sensing matrix
Part I: sparsity estimation:
Set the initial value to

then, calculate the inner product set

and take the index of top

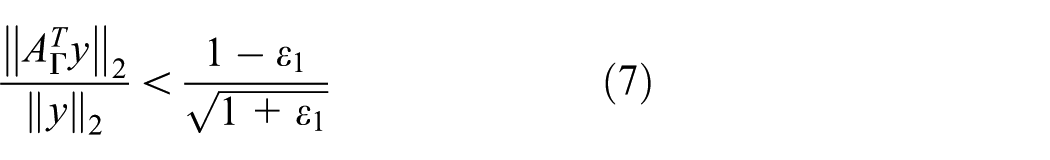
otherwise

then the
Repeat the steps from equations (9)–(11) until
Part II: signal reconstruction:
Since the sparsity of the signal has been estimated as

and

where

The corresponding indexes of its new top k maximum values are stored in set P. Then, update the index set

Take

In each iteration, the residual

if equation (17) is satisfied, then

The proposed algorithm can adaptively estimate the sparsity of signal, making this method more applicable. Actually, in many practical applications, historical data are an important resource for signal analysis. The characteristics of one kind of signal usually do not show large changes in sparsity, so that previous data can provide a more accurate initial value which helps the estimation result to converge to the real sparsity value faster.
Vibration signal simulation and reconstruction
Two numerical examples are given in this part. The first example presents the reconstruction rate for different measurement dimensions
Reconstruction rate in different measurement dimension
Since the reconstruction result is related to the sparsity of signal and dimension of the measurement matrix, four random signals with sparsity values of 4, 10, 18, 28, and 40, respectively, are used to test the above SASP for different measurement sequence dimensions. In each test, the computation was repeated 1000 times, and if the residual is less than
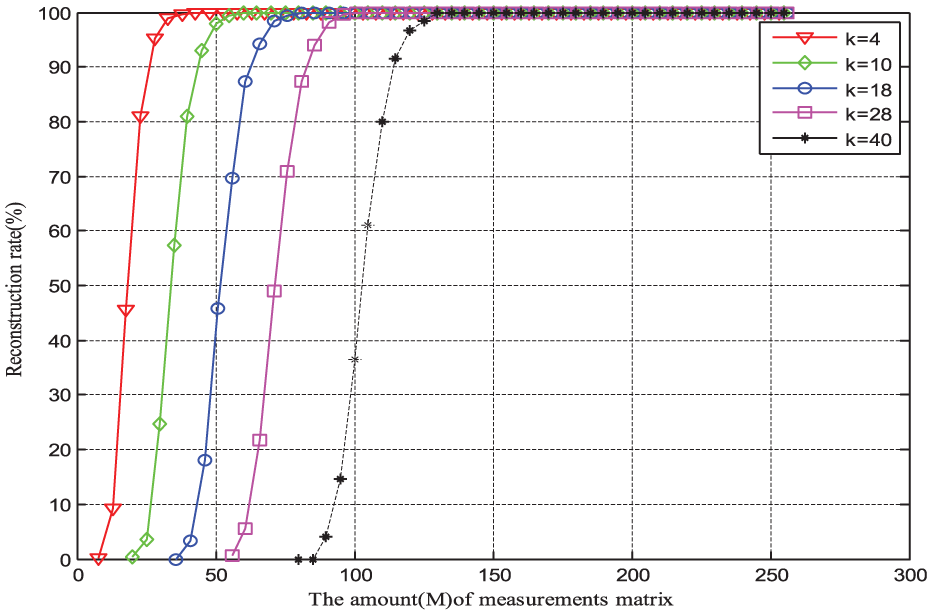
Reconstruction rate for different sparsity values.
Reconstruction of synthesized signal
Based on the number of degrees of freedom, vibrational systems can be classified into two kinds: single-degree-of-freedom systems and multi-degree-of-freedom systems. The single-degree-of-freedom system is the basic model which has most common characteristics with general linear vibration system. The damage assessment for offshore structures generally uses passive monitoring, so that the structure can be considered as a single-degree-of-freedom vibration system. The weak-mode characteristics in vibration signals are easily buried in high-intensity noises and make it difficult to identify the signal, 16 so the excitation mainly comes from tugboat collision. Actually, due to the external effects (friction, waves, etc.) and inherent characteristics, the vibration amplitude of the structure would attenuate, and therefore, the vibration signal from the offshore structures is usually treated as an aperiodic damped signal. The vibration equation can be expressed as

where

where

Since there is a non-zero solution,

where

where A is the initial amplitude, and

Therefore, based on equation (24), a set of one-dimension structural vibration simulation signals is synthesized using MATLAB (all of the simulations and computations in this article are under the MATLAB 2013b on a desktop computer with 64-bit operating system, 3.20 GHz CPU and 6 GB memory), with the values for
Values of the parameters in equation (24).

Considering the strong rigidity of the structure, the vibration signal would attenuate relatively fast, and its frequency is small. Therefore, in this work, we set
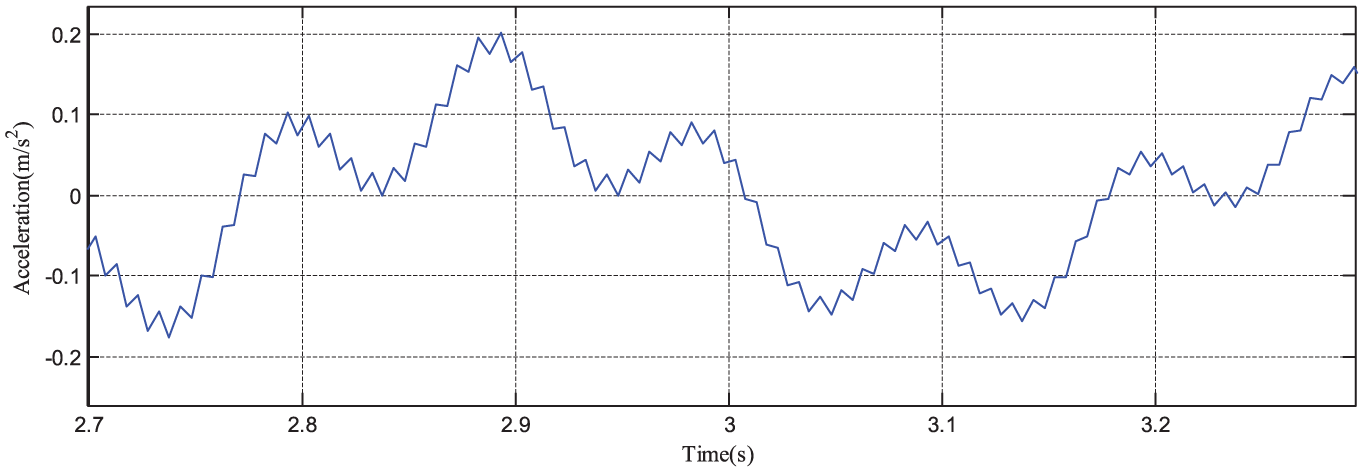
Structural vibration signals in time domain.
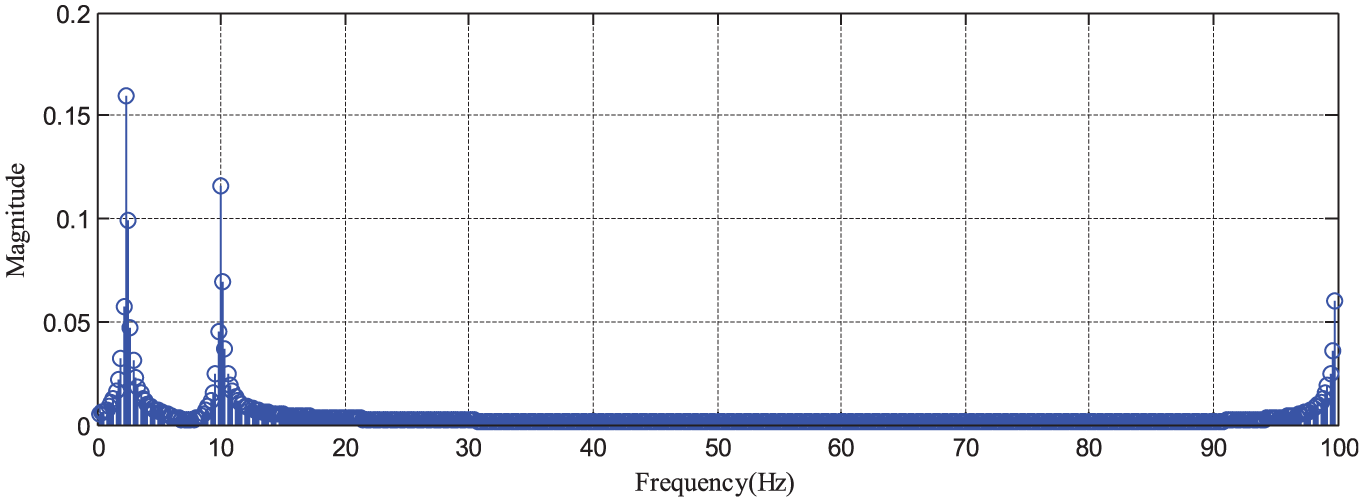
Structural vibration signals in frequency domain.
According to Figures 2 and 3, the simulation signal is sparse in the frequency domain, so the discrete Fourier orthogonal basis is used for its sparse representation. To represent the reconstruction effect more intuitively,
and

where
Figure 1 shows that the length of the measurement

Reconstruction comparison at different
Reconstruction results at different

Field test verification
In this section, a wireless structural health monitoring experiment conducting for a mono-pile foundation offshore structure is carried out. The top of the foundation is approximately 15 m above the sea surface. Five sensors installed every 2 m on the vertical side plane from top to down are Measurement Specialties Inc (MEAS) 4803A ±2g tri-axial accelerometers and the z-axis is in the vertical direction. The sampling frequency was set to 500 Hz. As shown in Figure 5, the signal acquisition equipment is a wireless health monitoring system independently developed by the Ocean University of China (OUC). Figure 6 only shows the data of x-axis direction. It can be seen from Figure 6 that due to the impact of the environment such as wind, waves, and certain noise interference of the instrument itself, a large noise is present in the acceleration data. In the frequency domain, it is easy to see that the energy is mainly distributed approximately 2.17 Hz, but with some energy still remaining in the band from 10 to 250 Hz. Therefore, the signal is not sparse in the Fourier basis. To compress and reconstruct the structural vibration signals by CS, it is natural to adopt a noise reduction technique which would only retain the main frequency band parts, so that the signal can be sparse-expressed in the frequency domain.

Wireless health monitoring system (left) by Ocean University of China (OUC) and tri-axial accelerometer (right).

Waveform of the original signals and its frequency spectrum: (a) original vibration signals of x-axis, (b) local enlarged view of vibration signals from 415 to 421 s, and (c) frequency spectrum.
The wavelet de-noising technique mainly includes two methods: the soft threshold and hard threshold. The soft threshold sets the signal absolute value which is less than or equal to the threshold to zero and shrinks the signal point absolute value of which is greater than the threshold. The hard threshold also sets the signal absolute value which is less than or equal to the threshold but keeps the signal point for which the absolute value is greater than the threshold value. It was determined that the values obtained by the soft threshold method show a better signal continuity characteristic than those of the hard threshold. Therefore, the soft threshold is used in this article. Another factor that could directly affect the wavelet de-noising is the threshold selection. Four kinds of threshold are provided in MATLAB: “rigrsure,”“heursure,”“sqtwolog,” and “minimaxi.” In this work, eventually “rigrsure” was adopted for threshold selection and sym8 wavelet for de-noising because of the good continuity and symmetry. As shown in Figure 7, it is clear that the signal is sparse in the frequency domain and the waveform is basically identical to the original signal. However, it may still make some information loss in the de-noising process which is not visible in waveform view. To avoid this influence, the modal parameters of both original and de-noised data are calculated. The first-order frequencies of original signal and de-noised signal are 2.135 Hz and 2.136 Hz respectively. That means the modal information are well preserved after the de-noising process.
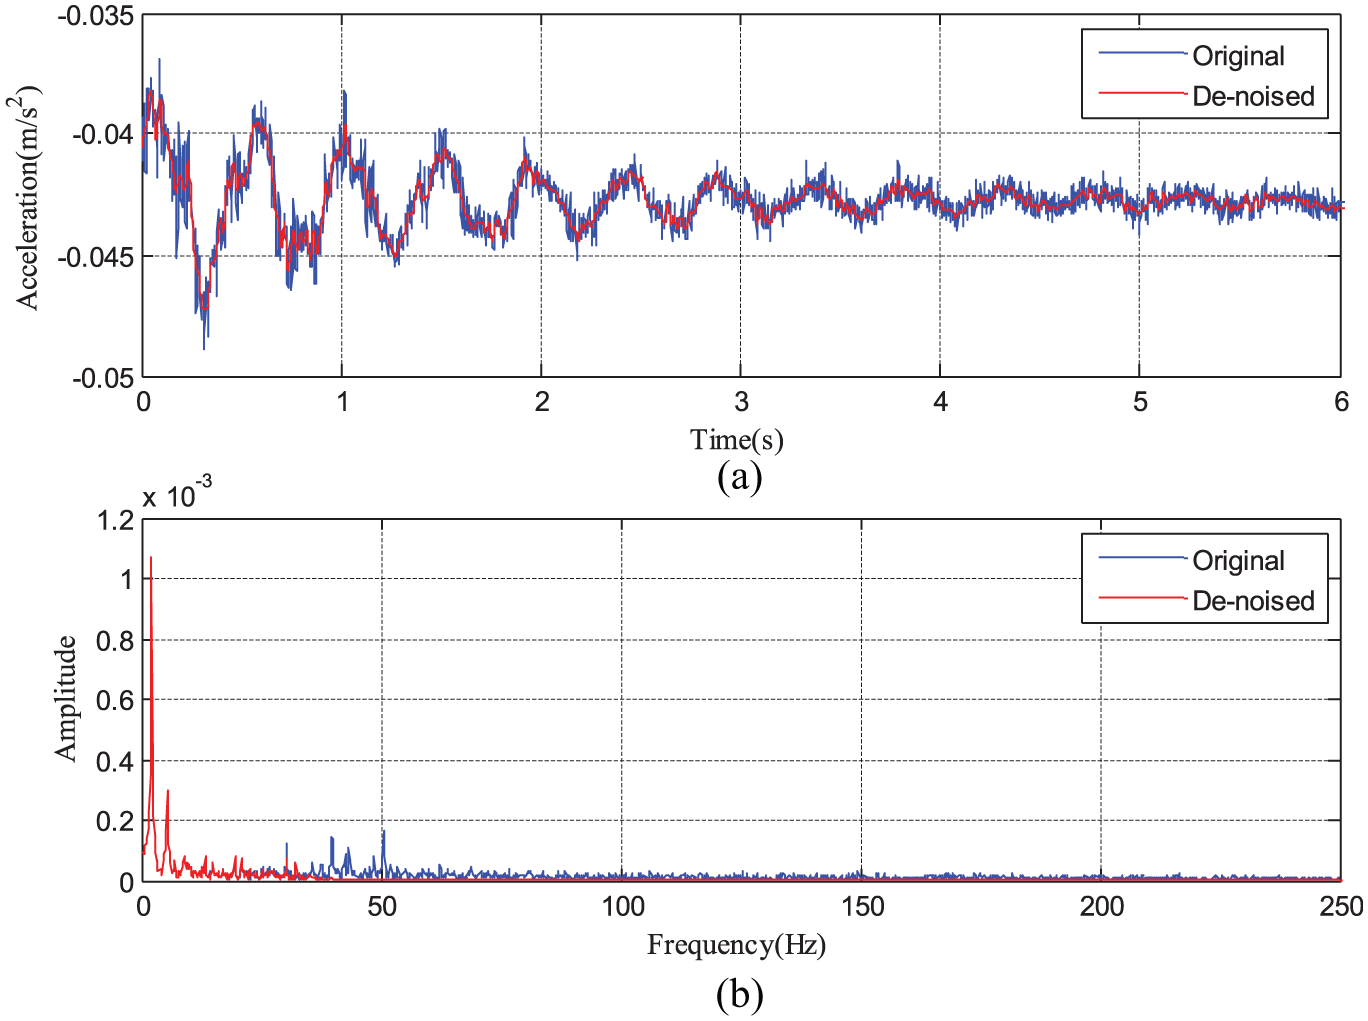
The comparison between the original signal and de-noised signal: (a) In time domain, and (b) In frequency domain.
Generally, the signal length cannot be too long, because then direct compression causes a great complication. Therefore, segment signal processing of every 1500 is adopted.

Reconstructed vibration signal diagram in time domain: (a) CR = 0.5, (b) CR = 0.4, (c) CR = 0.3, and (d) CR = 0.25.

CR: compression ratio.
In addition, the corresponding frequency domain spectrum is shown in Figure 9. The results show that it can basically cover the most of frequency distribution in 0–30 Hz as CR = 0.4 and 0.5, but the results of CR = 0.3, 0.25 are not as well as formers. Generally, it is difficult to determine the effectiveness of this result from the time–frequency diagram only, the detailed information cannot obtained directly from waveform comparison. Therefore, the ERA method is used to provide a more accurate approach for the analysis of the reconstruction effect. Using the data acquired from the above simulation test, the ERA method is applied to calculate the structure modal parameters of this offshore structure, and the specific calculation result is shown in Table 4.

Reconstructed vibration signal diagram in frequency domain: (a) CR = 0.5, (b) CR = 0.4, (c) CR = 0.3, and (d) CR = 0.25.
Structure modal parameter result by ERA.

CR: compression ratio.
Since the energy of vibration signal is mainly distributed at first- and second-order frequency, so only two orders of modal parameters (frequency and damping) are calculated. The original data and reconstruction data are both calculated at 125 orders. The calculation results presented in Table 4 show that the reconstructed data in CR = 0.5 and 0.4 obtained by the proposed method exhibit good performance in the modal analysis result. Between original data and reconstruction data, the difference of first- and second-order frequency is 0.0073 and 0.0085, respectively. That means the reconstruction data preserve almost all of the important information of original. But the ERA results of the other two CRs are comparably worse, which cannot precisely represent the structure modal information. The comparison in commercial data and original data show that the self-developed equipment can basically satisfies the requirement of data acquisition but still needs to improve in accuracy. Above all, the calculation results prove that the CS method can be applied in a wireless structure health monitoring system.
Conclusion
In this article, a CS-based SASP algorithm is proposed. Different from the conventional Nyquist theorem, CS can achieve a low sample rate and reconstruct the signal from the low-dimension measurements. Using this method, wireless sensors would generate fewer data, relieving the burden on wireless communication and data storage. To verify the effectiveness of this method, simulation and realization for the reconstruction of a vibration signal are presented. And the correlation coefficient and root mean square error are introduced to evaluate the effectiveness of signal reconstruction. The compression rate influences the reconstruction effect, so four different compression rates over a synthesized vibration signal are compared and analyzed. The results show a good reconstruction rate when the compression rate is set at 0.5. The reconstruction test of practical vibration signal by proposed algorithm is presented. The correlation coefficient results between original signal and reconstruction signal are around 0.99 at CR=0.5. Finally, using the reconstructed signal to calculate the structure modal parameter by the ERA method, it is found that the result shows little change compared to the original signal, proving that the CS method can be applied in wireless sensor monitoring systems to reduce the data amount of transmission and storage.
Footnotes
Handling Editor: Zhixiong Li
Declaration of conflicting interests
The author(s) declared no potential conflicts of interest with respect to the research, authorship and/or publication of this article.
Funding
The author(s) disclosed receipt of the following financial support for the research, authorship and/or publication of this article: This research was financially supported by the National Natural Science Foundation of China (grant nos 51779237 and 51509229) and National Nature Science Foundation of China (grant no 61431005).