
Abstract
This work focuses on delay-tolerant networks in a social network environment. The nonexistence of end-to-end path between the source and the destination poses great challenges to the successful message transmission in delay-tolerant networks. In this article, we attempt to find a socially connected path above the intermittently connected physical topology. To this end, we study a weighted community graph model, which turns the original network into a network composed of communities and then describes the interaction delays between these communities. By performing a Dijkstra algorithm on this community graph, the expected minimum transmission delay to a destination community can be computed. To improve the performance on delivery delay, we propose a social routing called weighted community graph–based social routing that makes use of interaction delays between communities and social ties among nodes, which consists of two routing phases. In inter-community routing phase, messages are forwarded to its destination communities based on the computed minimum delays, and then in intra-community routing phase, each copy is forwarded within a destination community based on the social ties between nodes until meeting the final destination. Extensive simulations are conducted and the results show that weighted community graph–based social routing can improve routing performance, especially the performance on delivery delay and overhead ratio.
Introduction
Traditional communication model is based on some inherent network assumptions, such as the existence of end-to-end path, low delivery latency, and symmetrical bidirectional data transfer rate. Under these assumptions, traditional TCP/IP-based routing protocols are able to shield heterogeneous networks and communicate across multiple regions. However, such assumptions do not hold in delay-tolerant networks (DTNs), 1 an emerging network architecture for challenging environment such as vehicular ad hoc networks, 2 mobile social networks, 3 and under water sensor networks. 4 To deal with this problem and provide high-quality communication services, DTN routing adopts the store-carry and forward mechanism (i.e. exploiting the opportunistic contacts and node mobility to relay and carry messages around the network) to spread messages hop by hop. In this case, message transmission relies on other nodes to act as relays, carrying messages between the source and the destination.
Numerous routing algorithms have been proposed to address this difficult routing problem, such as Epidemic Routing and Spray and Wait. These “naive” routing schemes do not keep track of information about the network and choose relay nodes purely based on contact opportunities. For example, in Epidemic Routing, each node simply replicates each message it receives to all nodes it encounters. Spray and Wait limits the maximum number of message copies in the spray phase and directly transmit messages in the wait phase. Recently, more efficient routing schemes that utilize learned information (e.g. history state, utility metric, and knowledge oracles)5–8 or network coding techniques 9 have been proposed. DTN-Flow 5 maintains nodes’ transiting probabilities among different geographical sub-areas and chooses nodes that are most likely to move to the proximity of destination node as relay nodes. It is shown that this scheme can not only reduce transmission delay but also improve delivery rate. EERP 6 is done on the basis of intensity of received signals and messages are forwarded by the sensor node which has the maximum intensity of received signal from the object. Theoretical analysis and simulation results show that the protocol can reduce energy consumption and message transmission delay. Liu et al. 7 proposed a centralized optimization model that offers theoretic insights and developed a distributed data query protocol, which minimizes the total communication cost. DSearch 8 tracks the destination node with the geographical transiting information and nodes’ long-term staying probabilities, achieves greater transmission reliability than routing schemes that only use geographical information or meeting probabilities. All these schemes achieve improvement in delivery ratio and transmission delay; however, they do not consider the social aspects of the underlying network environment and may increase the difficulty of executing these algorithms in reality.
The state of the art in DTN routing is to leveraging social properties and human mobility to predict future contacts and therefore improve routing performance. Social network analysis (SNA) has been recently applied to perform such prediction. SNA provides an approach to analyze the social properties of humans such as social tie, community, and similarity. Based on these social properties, we can build a social graph which describes the social distances or ties between nodes. We can then search this graph to find an end-to-end “social” path between the source and the destination. The reason why we call the path “social” is that the path is socially connected (i.e. neighboring nodes along the path have certain social ties or are socially connected for common interest), but may not be physically connected. In fact, we can take a new viewpoint on the connectivity among nodes instead of the traditional one. Two nodes are also considered connected if they will meet each other in a very short period of time or if they have regular contacts with each other. Essentially, two nodes with strong social tie are very possible to contact each other in the near future, for example, two acquaintances usually come into contact with each other regularly. So from this new point of view, we can think the found social path is end-to-end connected. Then, in the social graph, we can find the best path to transfer message as long as the weights assigned to edges accurately reflect the strength of the social ties between nodes. In this sense, social graph provides an efficient way to overcome the intermittently connected physical topology.
However, for networks with a large number of nodes, the resulting social graphs (a complete graph with one vertex per network node) will have a large number of vertices and edges. Even if we only add the regular edges into the graph, the cost to search the whole graph is still high. In application scenarios where nodes have constrained resource, each node may not have enough computing capacity to perform the path discovery operation in the graph. Consequently, a simplified social graph model could be used instead.
In this article, we propose to model the DTN as a weighted community graph model. In the community graph model, the original network is turned into a network composed of communities. The weight of the edge between two communities describes their interaction delay, the weight of the edge within a community describes the strength of social tie between each pair of nodes with the community. By performing a Dijkstra shortest path algorithm on this model, we can derive the optimal relay set that the expected minimum transmission delay to a destination community, and by solving the associated maximum social tie strength with destination node problem, we can derive the optimal relay set within a community. Then, we propose an optimal opportunistic forwarding routing scheme which uses these two optimal relay sets. And finally based on this graph model, we propose a weighted community graph–based social routing (WCGSR) to improve routing performance in DTNs.
The main contributions of this work are summarized as follows:
To reduce the cost of searching the whole network and simplify the network model, we present a weighted community graph model and extend the interaction delay concept from a pair of nodes to a group of nodes. Besides, an evaluation criterion called social tie strength is proposed for evaluating social tie between nodes, and we use it as the next hop node’s selection condition within community.
We present a rule of optimal opportunistic forwarding routing through a theoretical analysis. We design two optimal opportunistic routing algorithms to determine the optimal relays and compute the minimum expected delivery delay. Based on this, the WCGSR algorithm can achieve the optimal routing performance.
We can simplify the original network by virtue of the weighted community graph model. We prove that the simplification does not affect the routing performance. Moreover, we extensively evaluate our proposed algorithm in a Helsinki City model–based mobility scenario and compared with several existing schemes. The simulation results obtained demonstrate the effectiveness of our algorithm.
The rest of this article is organized as follows. In section “Assumptions and notations,” we present our assumptions and explain the main notations used in this article. In section “Community graph model,” we present the two graph models: inter-community graph and intra-community graph. In section “Detailed routing design,” we present in detail the WCGSR. In section “Performance analysis,” we analyze the delivery delay and advantages of WCGSR. The performance evaluations and comparisons are presented in section “Simulation.” In section “Related work,” an overview of related work is presented. In section “Conclusion,” we conclude the work and discuss our future research direction.
Assumptions and notations
Before introducing the detailed framework, we first make the following assumptions:
The original network includes
The inter-contact time (i.e. the time interval between two subsequent contacts) between each node pair follows a certain probability distribution (e.g. power law and exponential distribution) or can be accurately estimated by random sampling.
The source (and relays) knows which communities that the destination node belongs to. That is, the message consists of the source, the destination information, and the data to be delivered.
Regarding the first assumption, we can find some prototype networks in real world. For example, the members of the same family, the workers of the same office, and the students in the same class can form a community, and all of them can form such a prototype network. Previous works observed that 50% of mobile users in this network spent 74% of their time at a single access point (AP) to show the characteristic of frequently visiting a few locations. 10 Moreover, many community detection algorithms11,12 have been recently proposed for the networks without clear community structures. So we can use these algorithms to divide nodes into different communities easily. Regarding the second assumption, many existing works13–16 have argued this issue, and their conclusions have shown that many human traces follow power law or exponential distribution. In fact, even for the network that inter-contact time does not follow a clear distribution, this assumption is still reasonable. Social relations and behaviors among mobile users are usually long-term characteristics and less volatile than node mobility. In this case, the interactions between nodes are regular and the changing scale of the inter-contact time between same node pair is small. Regarding the third assumption, this assumption is reasonable because the source generally knows some basic information about the destination in message delivery tasks. For example, the destination node can broadcast this information to all communities. A similar assumption is also adopted in previous work. 17
Table 1 explains the notations used in this article.
Mathematical notations.

Community graph model
Social property reflecting the social distance between human nodes provides a new way to characterize the connectivity of DTNs. In this section, taking full use of communities and social ties performed by humans, we introduce a weighted community graph model to assist message transmissions.
Common inter-community graph
Definition 1
Common weighted inter-community graph. A common weighted inter-community graph
As we focus on the usage of community graph in social routing, we assume the communities have been detected using any existing community detection algorithm. Now, the key issue is to compute a weight for each edge.
Definition 2
For two communities
Now with the above definition, we can compute
Lemma 1
For
Proof
As shown in Figure 1, we can treat
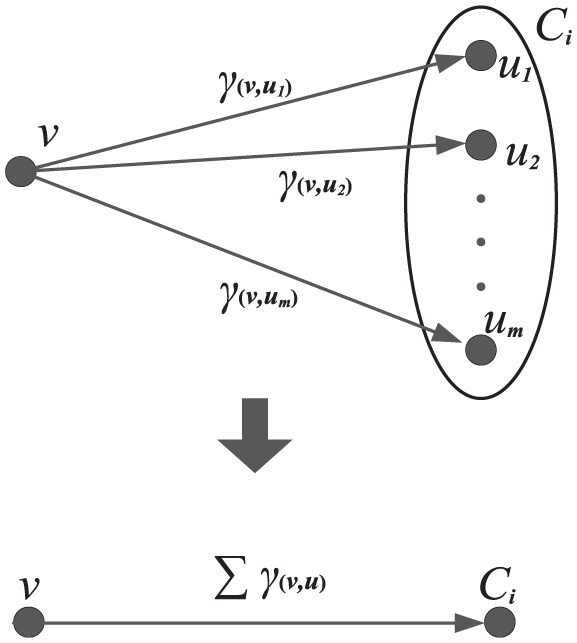
See community
Lemma 2
For the edge

Proof
As shown in Figure 2, considering all interactions between each

where
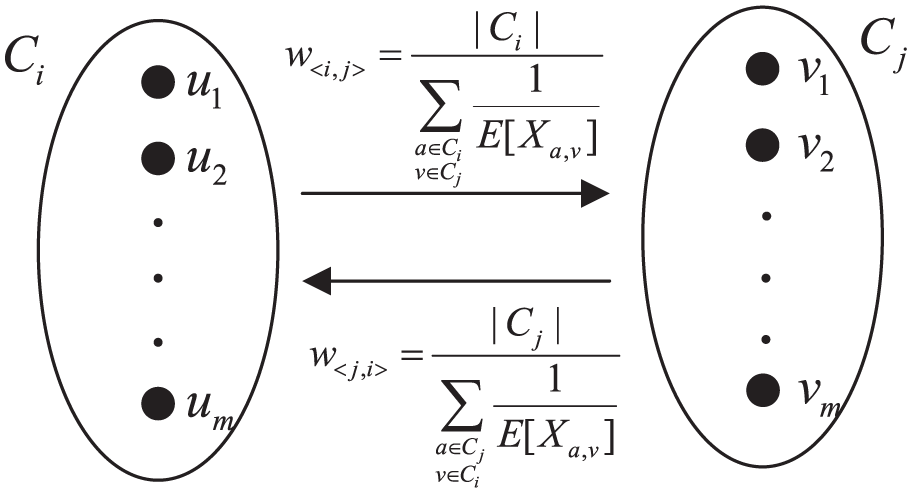
The weight for the edge between
Lemma 3
The proposed weighted inter-community graph
Proof
According to Lemma 2, when

which proves in theory that
Extended inter-community graph
Definition 3
The extended weighted community graph for node
Note that for each node in the network, there is such an extended weighted graph. In the original graph
To construct
Definition 4
The weight
For convenience, here we define a community set
Now with
Estimate inter-contact time
To compute
Sampling by growing time window. Samples of the inter-contact time between
Sampling by sliding time window. In this approach, a pre-set time window is used to restrict the sample data. Only the samples collected in current time window will be used to compute
In the above approaches, we need to set a variable


This variable ensures that there is no need to store old sample data, which greatly saves the cache resource and makes the continuous sampling possible.
Intra-community graph
A community essentially consists of a set of nodes that frequently visit a common geographic location. Each node is more closely associated with nodes from the same community than nodes from other community. To route message among nodes within the same community, we need to estimate the likelihood of each node (community member) to deliver a message to the destination. For this purpose, we build an intra-community social graph which describes the social ties between nodes. Intuitively, within a community, frequent communications between nodes indicate higher encountering probability and existence of a strong tie between the nodes. For instance, students in the same laboratory have a higher chance to see each other than the students from other laboratories. Here, to illustrate this point, Figure 3 shows an example of encounter frequency in different communities. In this example, Professor 1 has two students, 1 and 2, and Professor 2 has two students, 3 and 4. Every week, each individual’s contact time is shown in Figure 3. Professors contact their own students more frequently than another laboratory’s students. Students tend to contact students on their own team more frequently than students on a team different from their own. Furthermore, social-based algorithms (e.g. Bubble Rap 18 and SimBet 19 ) have shown their superiority in choosing the most appropriate relay nodes by exploiting social ties such that messages are sent to those nodes well socially connected with their destinations. Therefore, routing based on an intra-community graph with social tie weights can significantly reduce delivery delay.

An example of encounter frequency in different communities.
To accurately capture social ties between nodes, we consider the following two behavioral features of friendship: frequency and longevity. A stronger social tie between nodes means more frequent encounters and encounters of longer duration. Previous social-based routing schemes (such as Bubble Rap 18 ) took into account some of these features, but not all at the same time. In contrast, we define the following metric to reflect the social ties more accurately using both features.
Definition 5
Social tie strength. For each node pair a and b of the same community, we use the statistical analysis methods to compute the social tie strength


Definition 6
The weight

We can use a matrix to represent the social tie strength between different pairs of nodes within a community. Matrix

Intra-community
Inter-community optimal relay set
Definition 7
Inter-community optimal relay set. For a message
Here, the threshold value for determining whether a node should be added to
Intra-community optimal relay set
Definition 8
Intra-community optimal relay set. For a message
Optimal opportunistic forwarding routing
According to the above definitions, only nodes that can reduce the transmission delay of a message are added to the optimal relay sets. In the optimal opportunistic forwarding routing scheme, each message carrier delivers messages via its optimal relay set (i.e.


where
Definition 9
Optimal opportunistic forwarding routing rule. The optimal forwarding is to forward message to the encountered node that can get the minimum transmission delay to the destination. Concretely, for current carrier
This optimal forwarding rule ensures that each newly selected relay will further reduce the transmission delay of the message. As relay selection continues,
Detailed routing design
With the above definitions, we now present details of WCGSR. We first present the basic ideas behind the routing scheme, then describe the initialization process, and finally present the two phases of the routing scheme (inter-community and intra-community routing).
Basic routing idea
The basic routing idea of WCGSR is to use long-term social ties of human nodes to forward messages along a socially connected path to the destination. Concretely, each node
Initialization process
In the initialization stage, all nodes in the network are grouped into communities either by using a certain community detection algorithm or using community-aware opportunistic routing (CAOR), 17 in which nodes visit the same location frequently form a community. In our simulation studies, the communities are formed by nodes with same interest.
Next, nodes exchange its community information with other nodes in the network. In particular, each node maintains a list

Now with

Next, we can obtain the extended inter-community graph for each node
Inter-community routing
The objective of inter-community routing phase is to forward the message to its destination communities as quickly as possible. The basic idea is to compute the minimum expected delivery delays from one community to the destination communities in an ascending order. In the meantime, when a node
Concretely, when source

Intra-community routing
After a message is forwarded to a node in the destination community, the intra-community routing scheme is used to forward it within the destination community until it is delivered to the destination. The basic idea of intra-community routing is to forward the message to member nodes with a stronger social tie with the destination. This is because that nodes with stronger social ties with the destination has a greater probability to come into contact with the destination in the near future. The details of the relay selections in the second phase are outlined in Algorithm 2.

Performance analysis
Upper bound of expected delivery delay
In this section, we derive a close formula for the upper bound of expected delivery delay. For a message


The expected transmission delay along the path

Note that for message

In addition, based on above analysis, the delivery probability of

Advantages
In this section, we discuss advantages achieved by WCGSR due to the adoption of extended graph
First, the community graph model uses a graph composed of
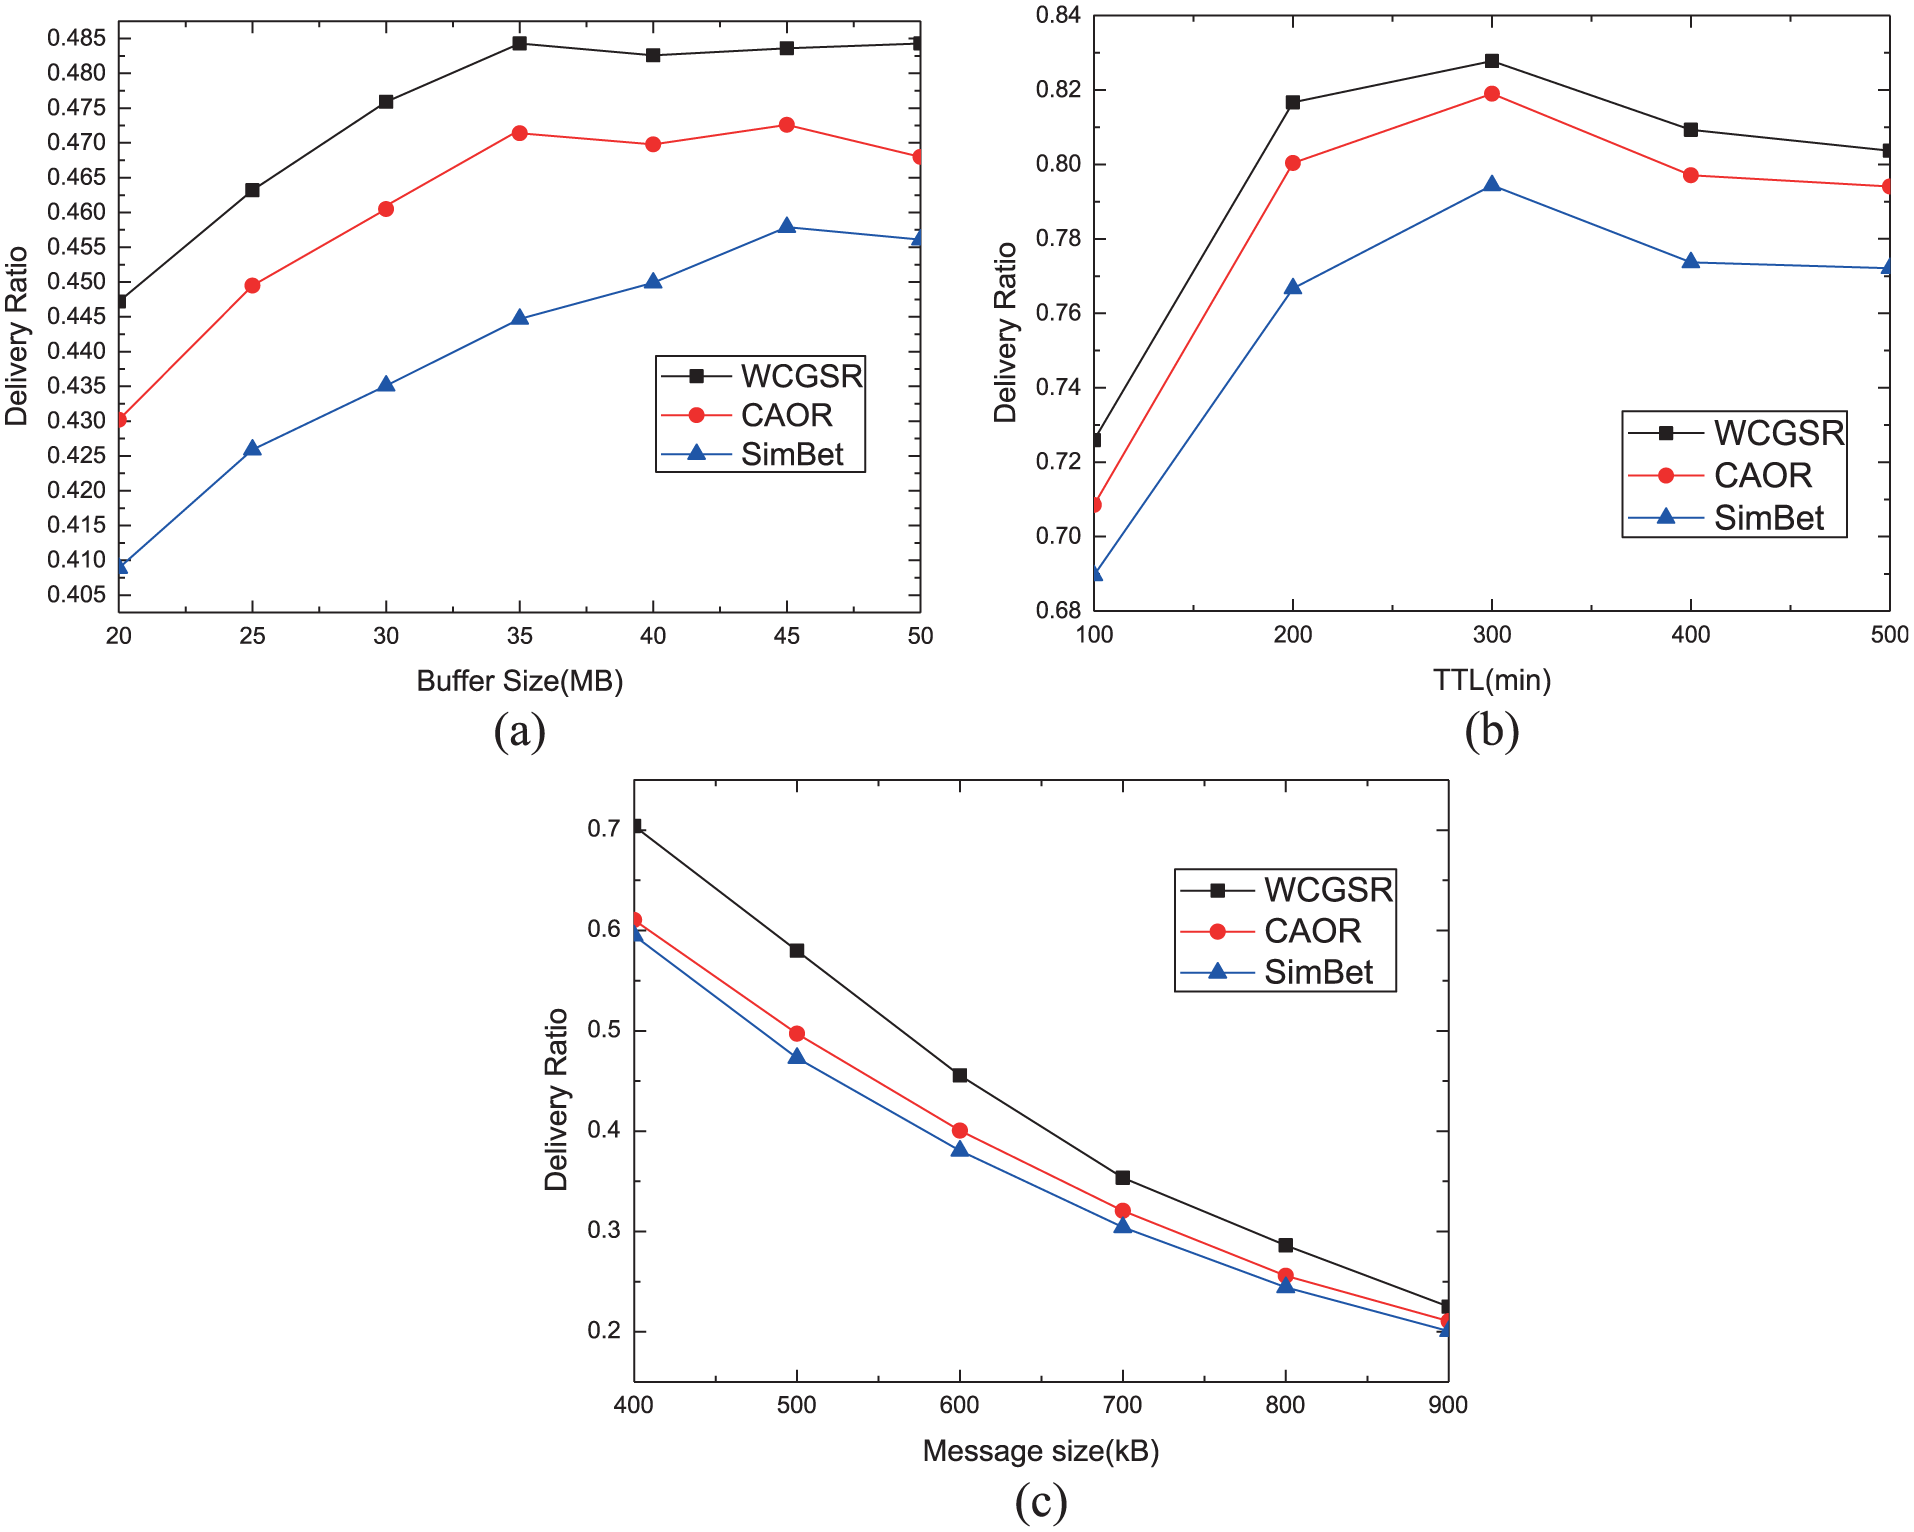
Delivery ratio versus (a) buffer size, (b) message TTL, and (c) message size.
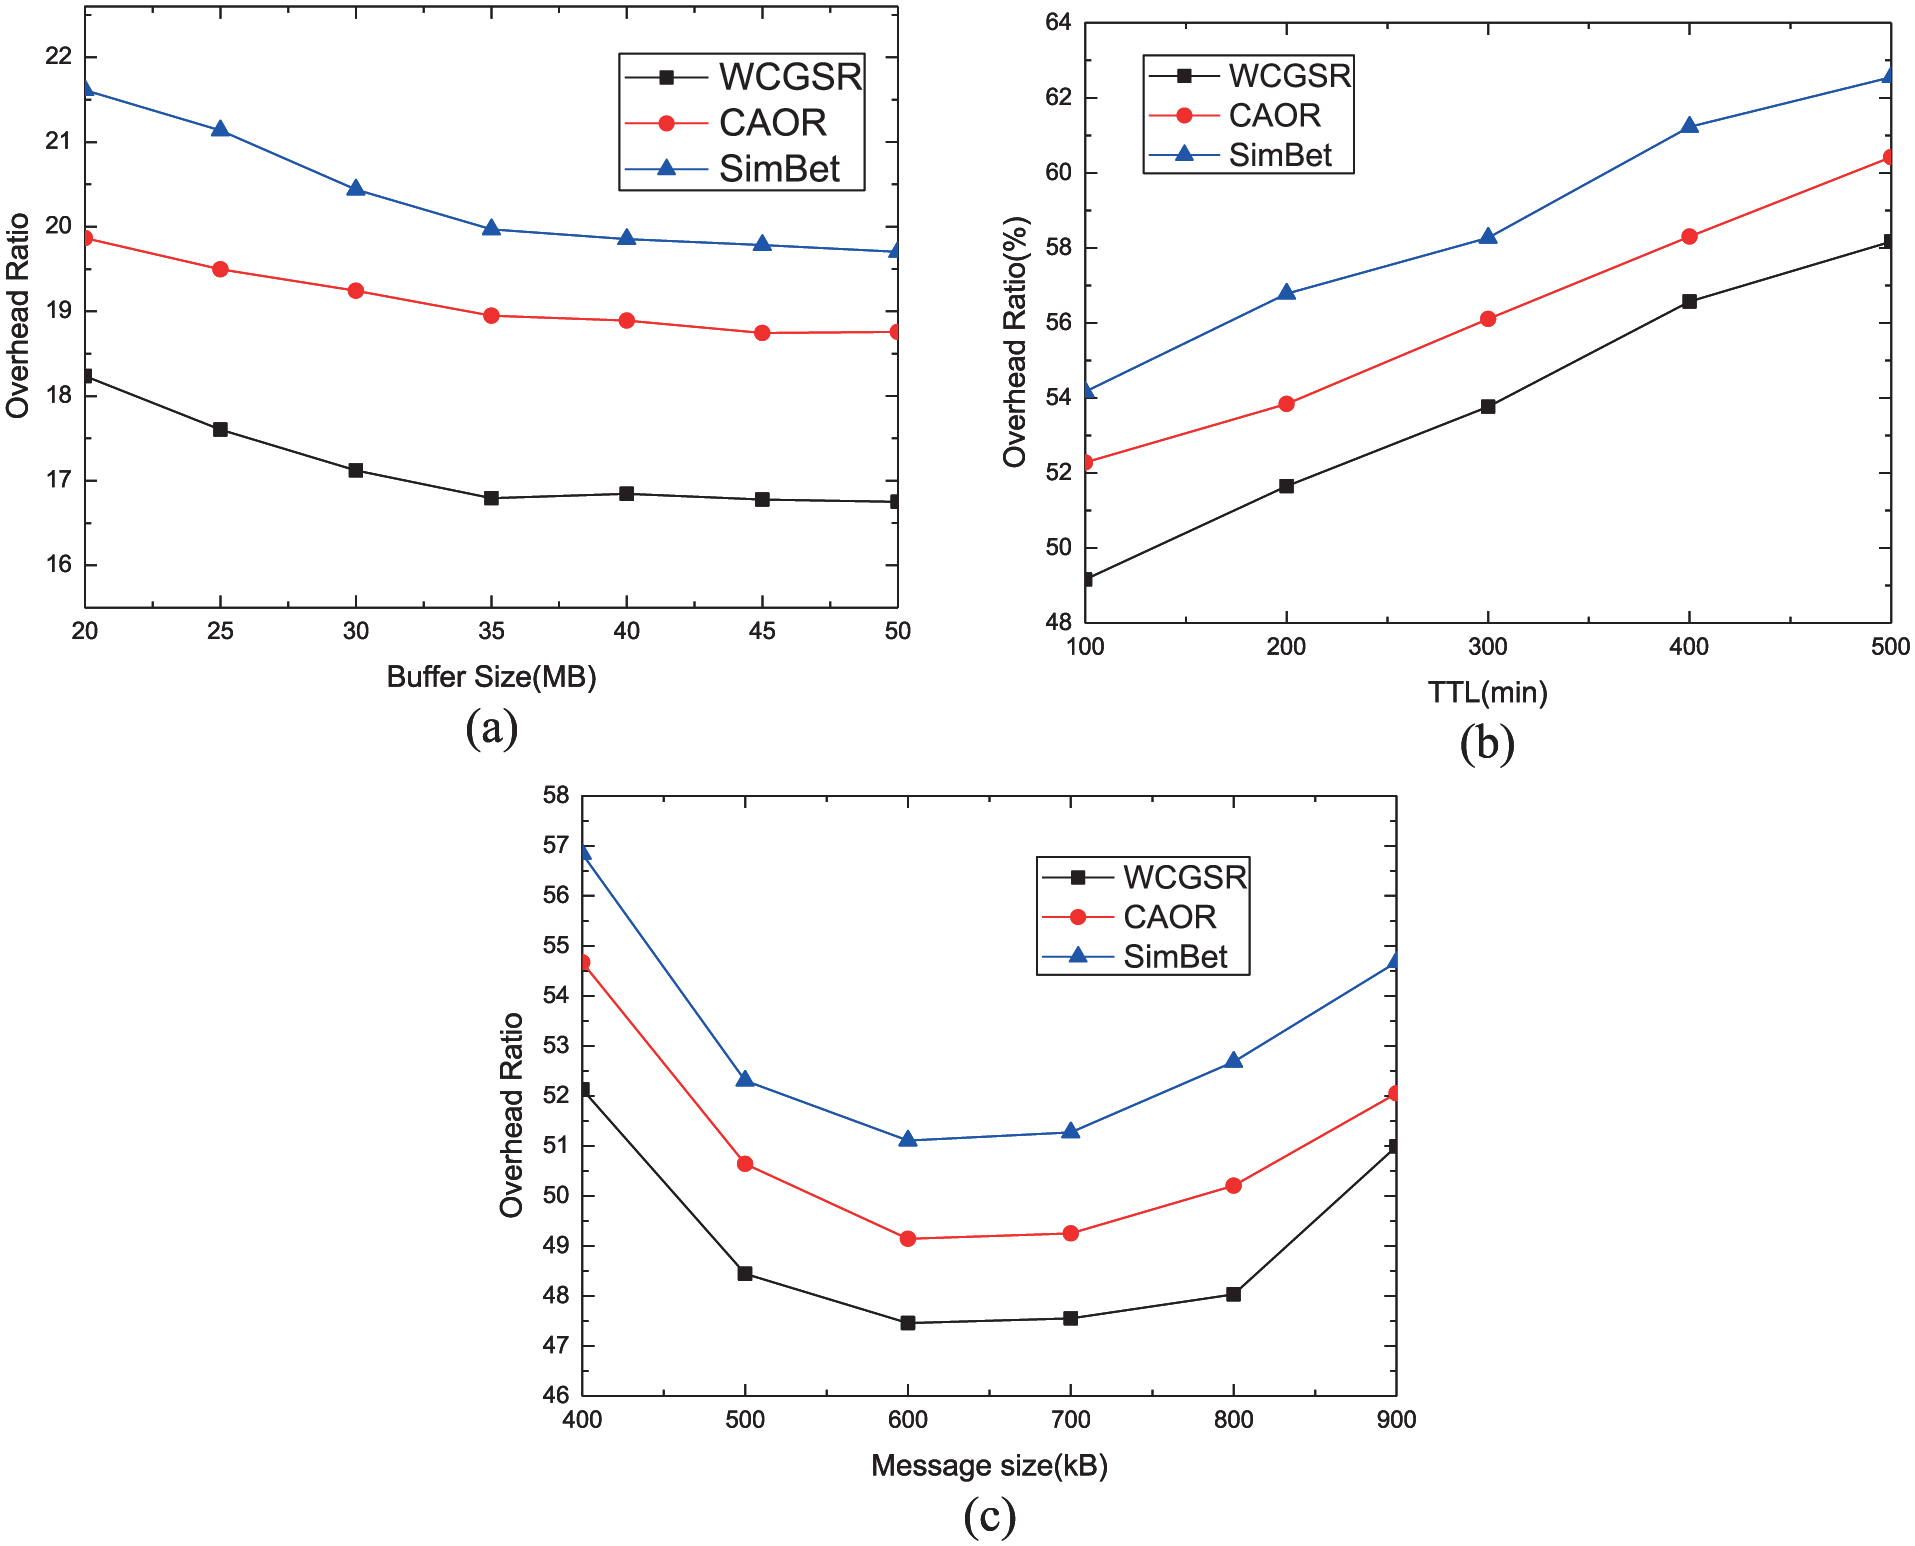
Overhead ratio versus (a) buffer size, (b) message TTL, and (c) message size.

Average latency versus (a) buffer size, (b) message TTL, and (c) message size.

Average hop count versus (a) buffer size, (b) message TTL, and (c) message size.

Delivery ratio versus (a) buffer size, (b) message TTL, and (c) node number.

Overhead ratio versus (a) buffer size, (b) message TTL, and (c) node number.

Average latency versus (a) buffer size, (b) message TTL, and (c) node number.

Average hop count versus (a) buffer size, (b) message TTL, and (c) node number.
Simulation
In this section, we conduct extensive simulations to compare the performance of WCGSR against CAOR, 17 Bubble Rap, 18 SimBet, 19 and Epidemic Routing. 20 We examine four commonly adopted performance metrics: delivery ratio, average latency, overhead ratio, and average hop count.
Our simulation results demonstrate that our proposed scheme significantly improves routing performance. We next describe the routing schemes studied, the simulation setting, evaluation metrics, and simulation results in detail.
Compared routing algorithms
We compared our routing scheme against the following routing schemes: CAOR, SimBet, Bubble Rap, and Epidemic Routing. Both CAOR and SimBet use social property to find a path to the destination, and its relay selection is similar to that of WCGSR. Similar to WCGSR, Bubble Rap is a typical social-based routing, which exploits the concept of community in a different way. Epidemic Routing scheme flood messages to the whole network and achieve the optimal delivery performance in the case where there are sufficient network resources (storage, bandwidth, and energy). In our simulation studies, we assume there is sufficient network resource. As a result, Epidemic Routing achieves optimal delivery performance and serves as a baseline to compare with WCGSR.
Simulation settings
We implement our simulations using the ONE 21 simulator. We consider a network of 126 DTN nodes in a Helsinki City model–based mobility scenario, the Helsinki City scenario is with 15.3 km2 area where 126 DTN nodes are classified as 80 pedestrians at 0.5–1.5 m/s, 40 cars at 2.7–13.9 m/s, and 6 trams at 7–10 m/s. Furthermore, human’s interests to visit places decides the nodes movement. Table 2 summarizes other parameters used in the simulation.
Simulation settings in Helsinki City model.

Evaluation metrics
To evaluate the performance improvements of WCGSR, we focus on the following metrics:
Delivery ratio. The ultimate goal of routing in DTNs is to achieve great delivery performance. This criterion is the measure of delivery capability for a routing scheme. When the network resource is sufficient, Epidemic routing usually has the best delivery performance. This is because Epidemic routing always finds the best possible path to the destination. Therefore, it represents the baseline for the best possible delivery performance.
Overhead ratio. It is desirable to achieve a low overhead ratio, since it reflects the efficiency of message transmission. Overhead ratio is defined to be the number of relay operations over the number of total delivered messages.
Average latency. This metric is another important routing goal. Average latency is the average duration of time elapsed from message generation at the source to message delivery to destination. A lower end-to-end latency means a better routing performance.
Average hop count. Average hop count is the number of hops along the path that a message is delivered.
Comparison with CAOR and SimBet
We compare the performance of different routing schemes under varying node’s buffer size, varying TTL (time-to-live) for messages, and varying message size. In the first category of simulations, we set the message size constant at 600 KB. The buffer size is set from 20 to 50 MB. As shown in Figures 5(b)–8(b), CAOR and SimBet perform well when TTL is less than 300 min. Therefore, we set message TTL at 120 min in the first category and third category of simulations so as to better evaluate WCGSR’s improvements. The simulation results are shown in Figures 5(a)–8(a). In the second category of simulations, we set the buffer size constant and message size constant at 100 MB and 600 KB, respectively. The message TTL is varied from 100 to 500 min. The simulation results are shown in Figures 5(b)–8(b). In the third category of simulations, we set the buffer size constant and message TTL constant at 50 MB and 120 min, respectively. The message size is varied from 400 to 900 KB. The simulation results are shown in Figures 5(c)–8(c).
From Figure 5(a) we find that all algorithms perform well when buffer resources of nodes are sufficient. We also observe that WCGSR significantly outperforms SimBet in delivery ratio and slightly outperforms CAOR also. We think this is because WCGSR takes full advantage of community information and social properties and transfer message to its destination community gradually. So the routing selections are more efficient. In Figure 6(a)–(c), we compare the overhead ratio of the three schemes. We notice from Figure 6(a) that the overhead ratio of all algorithms decreases when a node is equipped with more buffer resources, because larger buffer size leads to copying with a higher overhead ratio (as shown in Figure 5(a)). In Figure 6(b), the overhead ratios of CAOR and SimBet are higher than that of WCGSR. This verifies that WCGSR has a better advantage in reducing the overhead ratio because WCGSR combines nodes’ social attributes and transmission delays to choose the next hop node instead of choosing blindly. Figure 6(c) shows that the overhead ratio of all the algorithms increases with message size greater than 600 KB because the buffer resource is always limited, thus increasing the message size will increase the message loss.
Figure 7(a)–(c) plots the average latency achieved by the three schemes. We observe that WCGSR has a great advantage in terms of average latency, due to the fact that the scheme tries to reduce transmission delay in each step of the relay selection. We also notice that WCGSR achieves a slighter lore latency than CAOR, which demonstrates that relay selection strategies adopted by WCGSR are effective. The simplified network model and the usage of social properties help to find a socially connected path to the destination node, avoiding blind selection and reduce transmission latency.
Figure 8(a)–(c) compare the average hop counts for the three routing schemes under different scenarios. We observe that WCGSR outperforms CAOR in terms of average hop count. This is because that WCGSR takes into account the community as a whole in the inter-community graph and makes use of social tie strengths when performing intra-community routing. These features help to choose the next hop node and also locate the destination from social perspective (other than the current location of the destination). From the above simulation results, we conclude that WCGSR achieves better routing performance than CAOR and SimBet.
Comparison with Bubble Rap and Epidemic
In our simulation studies comparing WCGSR with Bubble Rap and Epidemic Routing, we vary the node’s buffer size, message TTL, and the number of nodes in the network. In the first category of simulations, considering the vast amounts of data transmission tasks in real world and the commonly used multi-copy strategies in DTN routing, these storage resources may still not enough. So in order to evaluate WCGSR’s performance in the case of different storage resources, we change node’s buffer size from 30 to 80 MB while setting the message TTL to 120 min and the node number to 200. From Figure 9(a), it can be seen that with the increase in the buffer resources, the message delivery ratio of all algorithms’ performance goes up, but WCGSR still performs well even with limited buffer resources. In the second category of simulations, we change message’s TTL from 100 to 500 min while setting the buffer size to 100 MB and the node number to 200. As shown in Figure 9(b), WCGSR achieves the highest delivery ratio when message’s TTL is greater than 200 min. In the third category of simulations, we set the message TTL constant at 120 min. We change the node number from 200 to 700. The buffer size is set to 100 MB, which ensures that the other three algorithms can perform well. WCGSR achieves the highest delivery ratio when messages have a small TTL and nodes have sufficient buffer resources.
By locating the destination community of a message, WCGSR can find a socially connected path to the destination, thus overcoming the problem caused by the lacking of connected end-to-end path. As shown in Figure 9(a) and (b), WCGSR is able to improve delivery ratio, especially when messages have a larger TTL. From Figure 9(c), we observe that when node density is low, no routing schemes achieve satisfying delivery ratio, indicating that the successful message delivery depends largely on contacts among nodes. When there are only a small number of nodes in the network, each node has little chance to contact other nodes directly or indirectly. When more nodes are added into the network, the contact probability between nodes is improved. As shown in Figure 9(c), when more nodes are added into the network, all routing schemes achieve higher delivery ratios. From Figure 9(a) and (c) we can also see that more copies are helpful to improve delivery ratio when network resource is sufficient. However, these copies inevitably increase the network overhead ratio. As shown in Figure 10(a)–(c), the overhead ratios of Epidemic and Bubble Rap are higher than that of WCGSR. This also shows that WCGSR achieves a great trade-off between delivery ratio and network overhead ratio. From Figure 11(a)–(c), we observe that WCGSR achieves advantages on average delivery latency compared to the other three algorithms. This indicates that WCGSR can improve the performance on end-to-end latency. The key reason is that, in each step of relay selection, WCGSR tries to further reduce the transmission delay based on the extended graph
Related work
There have been many works proposing routing schemes for DTNs. Most of DTN routing research focus on leveraging contact opportunities, such as flooding-based algorithms (e.g. Epidemic 20 and Spray and Wait), the probability-based algorithms,22–24 and the location-based algorithms.25,26 Other works introduce additional communication facilities such as message ferry and control nodes into the network. Li et al. 24 proposed an optimal opportunistic routing strategy based on a continuous time Markov framework. GeoDTN 25 uses historical movement information to predict the possibility of two nodes becoming neighbors and forwards message to nodes more likely to be a neighbor of the destination node. However, these algorithms may increase the resource consumption and the difficulty of executing these protocols in reality.
To reduce computation complexity and achieve good performance in real networks, many social-aware DTN routing schemes have been proposed. These schemes take advantage of social characteristic (such as community, centrality, and similarity) of network nodes to improve delivery performance. Xiao et al. 17 proposed a distributed community-aware opportunistic routing called CAOR. They present a home-aware community model and then turn the network into a network that only includes community homes. Through a reverse Dijkstra algorithm, they compute the minimum expected delivery delay for each node. And then based on the computed delays, they try to find the optimal relays for message transmission so as to achieve the optimal opportunistic routing performance. By simplifying the original network, they greatly reduce the cost of computing and maintaining the contact information among nodes. The SimBet 19 is another social-based routing scheme, using centrality and similarity to find the optimal relays. SimBet estimates the betweenness for each node by considering its local neighbors. A high betweenness means that the node can act as bridges among their neighbors. In addition, SimBet computes a similarity for current node and destination node by considering the amount of common neighbors. A high similarity means that the node is more likely to contact the destination. The two metrics are used to detect the node that provides the maximum utility for transferring messages.
Pan et al.
18
proposed social forwarding strategy called Bubble Rap, which uses the k-clique algorithm to detect a community. Bubble Rap ranks each node by their centrality values and then uses the rank values in the routing decision. Wu and Wang
27
proposed a hypercube-based multi-path social feature routing algorithm by taking full use of human contact features. This routing consists of two processes: social feature extraction process and multi-path routing process. In social feature extraction process, they first use Shannon Entropy to capture the
In this work, we study the advantage of social network–based routing. We make use of the social properties (community and social tie) and interaction delays to achieve more informed optimal relay set selection. Furthermore, inspired by existing social routing schemes, we design a weighted community graph model and an opportunistic forwarding routing strategy for delivering message from the source node to the destination node.
Conclusion
In this article, we study a social-based routing in DTNs so as to find a socially connected path to the destination over an intermittently connected network. To this end, we introduce a weighted community graph model. Based on the proposed community graph, we propose a social routing called WCGSR, whose routing process consists of two phases. The first phase of WCGSR forward a message to its destination communities based on the computed minimum delays. The second phase forward the message within the destination community based on the social tie strength until the message is delivered to the destination. Extensive simulations have been conducted and the results show that WCGSR is able to improve performance on end-to-end latency and maximizing message delivery ratio.
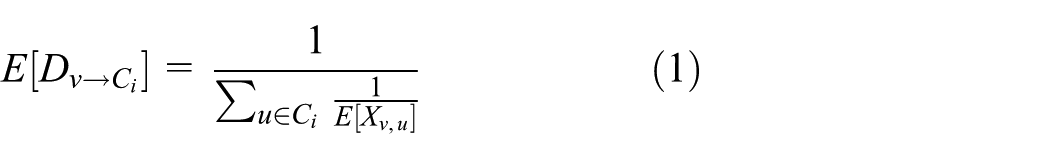
In order to lower the delivery delay, we compute edge weights in
Footnotes
Handling Editor: Sergio Toral
Declaration of conflicting interests
The author(s) declared no potential conflicts of interest with respect to the research, authorship, and/or publication of this article.
Funding
The author(s) disclosed receipt of the following financial support for the research, authorship, and/or publication of this article: This research was supported in part by National Natural Science Foundation of China (nos 61502261, 61572457, and 61379132), Key Research and Development Plan Project of Shandong Province (no. 2016GGX101032), and Science and Technology Plan Project for Colleges and Universities of Shandong Province under Grant No. J14LN85.