
Abstract
In this study, prediction routing algorithms are proposed to select efficient relay nodes. While most prediction algorithms assume that nodes need additional information such as node’s schedule and connectivity between nodes, the network reliability is lowered when additional information is unknown. To solve this problem, this study proposes a context-aware Markov chain prediction based on the Markov chain that uses the node’s movement history information without requiring additional information. The evaluation results show that the proposed scheme has competitive delivery ratio but with less average latency.
Introduction
A delay-tolerant network (DTN) is a network architecture that is designed to enable communication on unreliable networks such as those in wars or disasters, wherein it is difficult to apply the existing transmission control protocol (TCP)/internet protocol (IP). 1 To address this problem, DTN enables communication using message forwarding methods based on store-carry-forward (SCF) paradigm. 2
In DTNs, the selection of relay node has a significant impact on the overall network performance. To select efficient relay nodes, several research groups have proposed prediction routing models like PRoPHET (Probabilistic Routing Protocol using History of Encounters and Transitivity) and PER (Predict and Relay).3–9 The existing prediction models require additional information such as a node’s schedule and delivery predictability. However, network reliability is lowered when additional information is unknown.
To address this problem, in this study, we propose a context-aware Markov chain prediction (CMCP) model based on node behaviour movement that can predict the mobility without requiring additional information such as a node’s schedule or connectivity between nodes. The proposed model maps a given node’s movement behaviour onto the movement information history state each other. The next history information state is predicted by the transition probability matrix obtained using Markov chain to predict the mobility of nodes. In this study, the optimal behaviour nodes are predicted by the relay nodes that move towards the destination. Furthermore, a simulation study was conducted to confirm that this model approach improves the delivery ratio and lowers the average delay as compared to traditional DTN routing schemes such as PRoPHET or PER.
Related works
A representative DTN routing model, epidemic, delivers the message to all nodes within the transmission range. In an ideal network, the delivery ratio of the epidemic is higher than the prediction model because source node selects many relay nodes. However, the rate of input traffic to the processing buffer of node is limited in real networks. Therefore, this could result in an increase in the network overhead as large area networks or increased number of nodes can result in the copying of the buffer register.
To solve this problem, many prediction models have been proposed. PRoPHET is one such prediction model. In PRoPHET, a node can select a relay node using the delivery predictability. The delivery predictability is proportional to the probability of subsequent contact between nodes. In addition, the node behaves independently with characteristics like velocity and direction. We can analyse node behaviour in the Markov chain model. The results of this research, based on the analysis of the delivery ratio, show that low efficiency is obtained in a non-scheduled network.
PER model is proposed in a network-configured landmark. A landmark is defined as a place where nodes can communicate directly at same time. PER utilizes a model based on a time-homogeneous semi-Markov process model to predict the probability distribution of the time of contact and the probability that two nodes will have a contact in the future. However, in PER, the network is configured by landmark and the nodes have mobility schedule.
In this article, we propose a method that predicts the current and future states of the network using Markov chain.
Proposed algorithm
Each node stores a multidimensional array that records a node’s movement history in each time domain. A node’s movement history comprises speed and direction information. Then, the general range of a node’s movement history can be predicted based on the previous history using Markov chain, and the highest utility value is assigned to the node holding the next movement path. During the spray phase, the message is forwarded to the node in the direction of the destination. Figure 1 shows the sequence diagram describing the proposed model.

Sequence diagram describing the proposed model of CMCP.
Figure 2 shows the message transmission procedure. The message is transmitted according to the following procedure:
Source node A transmits location information of destination to neighbour node B.
Node B predicts movement path of itself and which can connect destination. If node B can connect destination, node announces own condition with relay node to source node A. Else if node B announces neighbour node.
If source node A receives node B with relay node, source node A transmits message to node B.
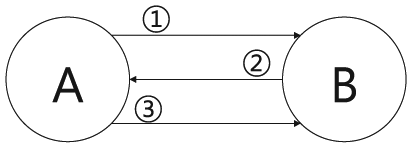
Message transmission procedure.
Set state and map node’s movement history
We proposed a model wherein nodes have the mobility of a node with discrete-time Markov chain. In Markov chain, the states are usually discrete. Therefore, we need to map a node’s movement history onto states. States are values having even intervals between minimum movement history and maximum movement history. Figure 2 shows example of states for speed and direction.
In Figure 3, there are eight states of direction and four states of speed. Each state has a mapped real value. For example, state 2 presents the real value π/2 in Figure 3(a) and state 1 presents the real value 0 m/s in Figure 3(b).
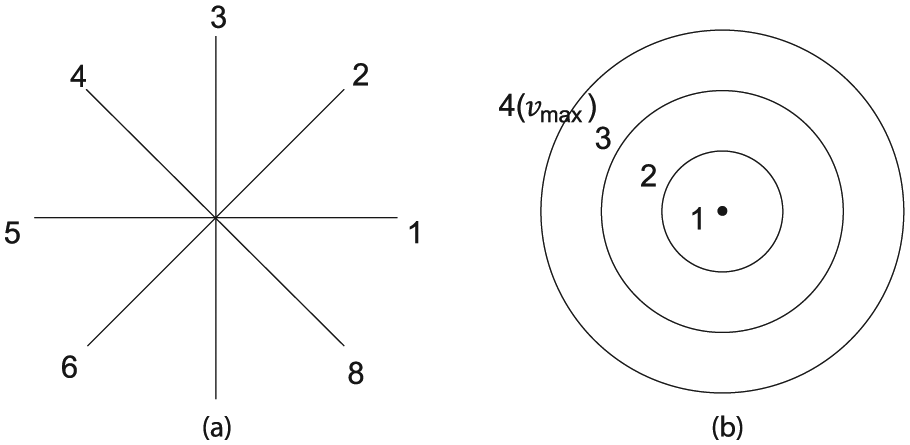
Example of mapping states of direction between 0 and 2π and speed between 0 and vmax: (a) state for direction and (b) state for speed.
We assign a random variable X as the node’s movement history. The sequence Xi forms a discrete-time and discrete-state Markov chain. Each node records the node’s movement history sequence Xi and maps Xi into one of states. To map the node’s movement history information to a state, the node’s movement behaviour history information compares the difference of value to each state

In equation (1), dira(b) is a difference between the direction value of node a and direction value of state b; dira is the direction value of node a and dirb is the direction value of state b; va(b) is the difference between the speed value of node a and speed value of state b; and va is the speed value of the node a and vb is the speed value of state b.
Then, lowest difference is endowed to the mapped state. Mapped state is represented as follows
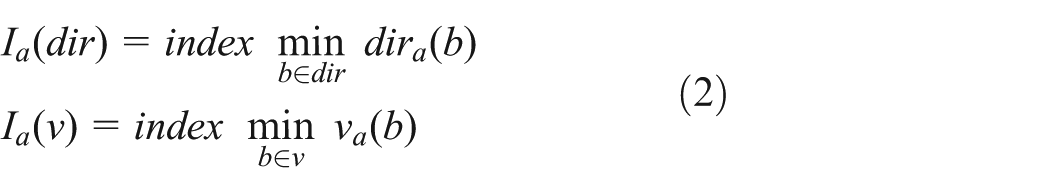
In equation (2), Ia(dir) is a mapped state of direction and Ia(v) is a mapped state of speed.
Create transition probability matrix
A Markov chain is a sequence of random variables X1, X2, X3, …, Xn with Markov property. ai (i = 1, 2, …, n) is the real value accordance to time. The probability of moving to next state depends only on the present state and not on the previous states if both conditional probabilities are defined by

When node A meets a random node Bi, node Bi predicts that node A moves in the direction of the destination. The transition probability matrix P is created based on the previous movement history sequence for Bi. The transition probability matrix P is defined by
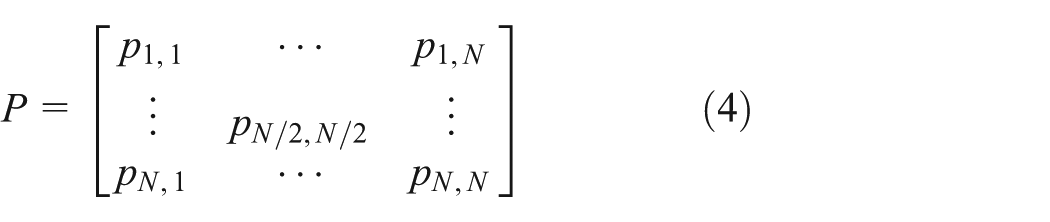
where N is the number of maximum states and pi,j is the probability that present state is i and next state is j.
M is length of analysis interval. If M is shorter enough, M is affected by the newest movement history. However, if M is too longer, it is affected by average movement history. The transition probability matrix P is created by the process described in Table 1.
Pseudo code for creating transition probability matrix.

The probability pi,j that a node’s property moves from state i to state j is defined by

where numi stands for the number of transitions from state i without considering the next state and numij is the number of transitions from state i to state j. Each node could generate and refine its own P matrix over time.
We predicted the next state according to the current state. Assuming that the current state is i, where i corresponds to ith row of matrix P, search for the column with the highest probability in the ith row in the transition probability matrix, and this column number is the next state.
For example, assuming that the sequence of states in interval M is 2, 3, 4, 2, 1, 3, 3, 1, 3, 3, the transition probability matrix is calculated as follows

Take matrix (6) for example. Supposing that the current state is 3, the highest probability in row 3 is 2/4, and it is located at column 3. Therefore, the next state is predicted as state 3.
Predict path of node and select relay nodes
We predicted node’s next state in the previous step. In this step, we predict node’s movement path and select relay node.
The movement path of the node is a set of location of node in every time. Therefore, the node predicts the next location of the node to predict the movement path of the node. The next location of the node is a location moved to current direction with current direction from current location of the node.
Source node selects relay nodes that will contact destination in predicted movement path. Figure 4 shows the selection of relay node in the proposed model.

Selection of relay node in the proposed model.
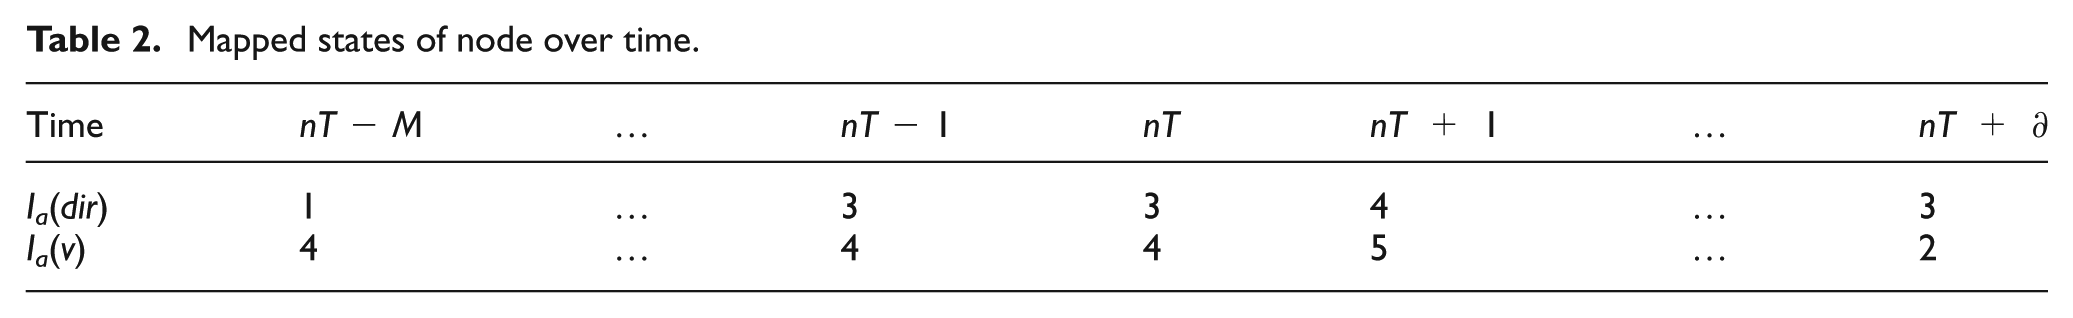
Figure 5 shows the process of movement path prediction of the node using mapped node’s state in the time between nT − M and nT. A node predicts next state at time unit nT + 1 using mapped state from time unit nT − M to nT, and then the node predicts next location by aggregating next states. When the node is able to communicate to destination at next location, the node is selected as a relay node. However, when the node is not able to communicate to destination at next location, the node repeats above process up to sequence period M at time unit nT+1. Table 2 shows the mapped state by Figure 4. At this time, the number of state N is 8.

Model of selecting the intermediate node for the routing path.
Mapped states of node over time.
Performance evaluation
In this section, we describe the simulations performed to compare the prediction-based routing of the proposed algorithm and PRoPHET. Prior to the simulation, we assume the following:
Destination is the node fixed at the centre.
Movement model is a random waypoint model. 10
Message is randomly created.
Message has time to live (TTL).
Delivery ratio is represented as described in equation (7) 11

G is the number of total created messages and D is the number of total messages that have reached the destination. Table 3 describes the simulation environment.
Units for magnetic properties.

TTL: time to live.
Average latency
If transmission range is increased, the number of nodes present in the transmission range increases correspondingly. The average latency is lowered because the node efficiently selects the relay nodes. Figure 6 shows the comparison of the average latency of the existing routing model and the proposed routing model with increasing transmission range for 50 nodes. The figure indicates a 17% improvement in the average latency as compared to the existing routing model. This can be attributed to the fact that the routing protocol utilizes the proposed algorithm to select relay nodes more efficiently than the existing routing protocol.

Average latency for increasing transmission range.
Figure 7 shows the comparison between the average latency of the existing routing model and the proposed routing model for increasing the number of nodes in network when the transmission range of node is 50 m. The figure indicates a 21% improvement in the average latency as compared to the existing routing model.

Average latency with increasing number of nodes.
Delivery ratio
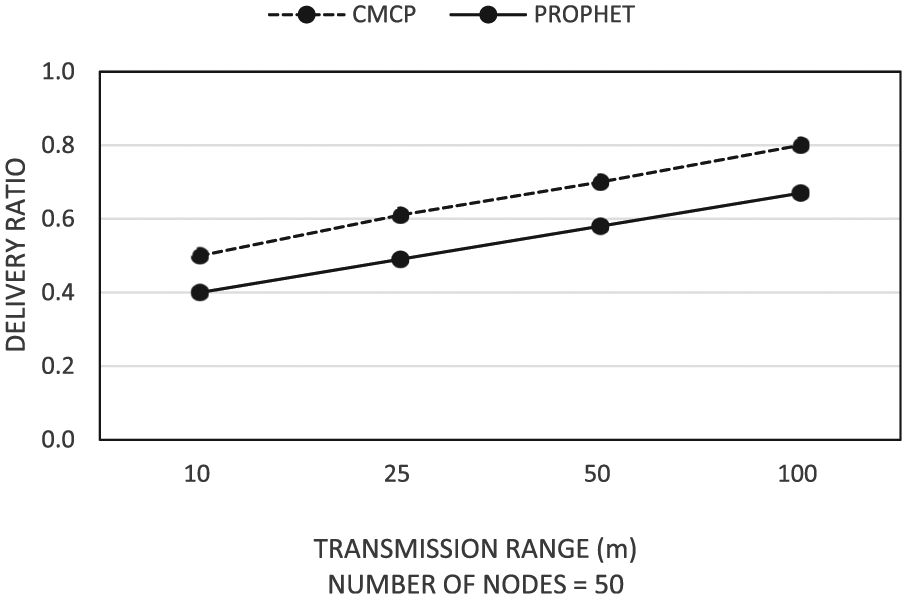
If transmission range is increased, the number of nodes increases correspondingly with the transmission range. The delivery ratio is increased because node selects the relay nodes more efficiently. Figure 8 shows that comparison between the delivery ratio of the existing routing model and that of the proposed routing model for increasing transmission range when the number of nodes is 50. The figure indicates a 10% improvement in the delivery ratio as compared to the existing routing model.
Delivery ratio for increasing transmission range.
Figure 9 shows the comparison between the average latency of the existing routing model and the proposed routing model for increasing number of nodes in network when the transmission range of node is 50 m. The figure indicates a 12% improvement in the average latency as compared to that of the existing routing model.

Delivery ratio with increasing number of nodes.
The results demonstrate that the proposed routing model is better than the existing routing model. The proposed model resolves the disadvantage of the existing prediction-based routing protocol using Markov chain.
Conclusion
In the DTNs, the existing prediction models require additional information such as node’s schedule and connectivity nodes. However, the network reliability is low when additional information is unknown.
To solve this problem, this study proposed a CMCP model based on the Markov chain, which utilized the node’s movement history without requiring additional information. The proposed model mapped the node’s movement history to state, and then predicted the subsequent state of node’s movement history using transition probability matrix created by Markov chain.
The node’s mobility was applied in the simulation in a way that is different from the approach of the random waypoint model. Therefore, in the simulation, the network environment was more realistic, thereby significantly improving the prediction accuracy of the node’s movement and actual performance. Further studies on the prediction ratio that determine the relay node contact destination can produce a more reliable configuration of the routing protocols in DTNs.
Footnotes
Academic Editor: Haigang Gong
Declaration of conflicting interests
The author(s) declared no potential conflicts of interest with respect to the research, authorship, and/or publication of this article.
Funding
The author(s) disclosed receipt of the following financial support for the research, authorship, and/or publication of this article: This research was supported by the Ministry of Science, ICT and Future Planning (MSIP) (2014H1C1 A1066391), Republic of Korea, and partially supported by the Education and Research Promotion Program of KUT.