
Abstract
Microscopy image fusion, as a new item in related research field, has been extensively used in integrated-circuit defect detection and intaglio-plate-microstructure observation. In this article, a novel microscopy image fusion algorithm based on saliency analysis and adaptive m-pulse-coupled neural network in non-subsampled contourlet transform domain is proposed, in which each original image can be decomposed into a low-frequency subband and a series of high-frequency subbands. A new measurement technique based on image variance permutation entropy is designed for fusion of the low-frequency subbands, and a novel sum-modified Laplacian is chosen as external stimulus which motivates the adaptive m-pulse-coupled neural network for the high-frequency subbands. Yet, the linking strength of the m-pulse-coupled neural network is determined by five features of the saliency map. Then, the selection rules of different subbands are worked based on the corresponding weight measures. Finally, the fusion image is reconstructed via inverse non-subsampled contourlet transform. Experimental results reveal that the proposed algorithm achieves better fused image quality than other traditional representative ones in the aspects of objective evaluation and subjective visual.
Keywords
Introduction
In order to better observe the details of small objects in gravure engraving field, the micro-observation technique is usually employed to grab the high-resolution images. With the increment of image resolution, the numerical aperture becomes higher and higher. Since this value varies inversely with the depth of focus, it is hard to inspect all details of a object in one image. Image fusion is a new technique which uses the different-depth images to synthesize one full focus image with the property of better visual effects. The image fusion technique has been widely applied in video applications, 1 medical applications, 2 and sensor applications. 3
Within the last decade, many algorithms have been proposed related to the subject in image fusion. These algorithms can be classified into two categories: image fusion algorithms based on spatial and transform domains. The spatial domain fusion algorithms select some features of images such as pixel, 4 block, 5 and region 6 as their final fused images. A simplest pixel-based fusion algorithm is intended to weight the source images to obtain fused results. However, this algorithm may lead to information loss and decreased clarity. The key point of the block-based algorithms is to select some image blocks from source images by some saliency measures such as spatial frequency, contrast visibility, and edge information. However, the image block containing both focus and defocus parts will result in blocking effect. In addition, it is difficult to choose a block size appropriately. In order to overcome these problems, many improved spatial domain fusion algorithms have been proposed. 7 The super-pixel-based saliency analysis method is used to obtain the target region which leads to the focus areas’ accurate extraction. 8
In recent years, many scholars have discovered that multi-scale transform (MST) may be a helpful tool for image fusion. The performance of the fusion result significantly depends on two aspects: MST method selection and effective fusion rules for different scales. The common MST approaches include discrete wavelet transform (DWT), 9 stationary wavelet transform (SWT), 10 discrete fractional random transform (DFRT), 11 internal generative mechanism transform (IGMT), 12 and shearlet transform. 13 However, the PT, DWT, and SWT methods can only capture the details of limited direction information and cannot represent an image. There are many excellent features in the curvelet transform, contourlet transform, and shearlet transform, such as multi-direction, multi-resolution, and anisotropy. Although these characteristics can fully describe the image edges, curves, and other details, it can easily lead to the pseudo-Gibbs phenomenon and thus reduce the image fusion quality according to the lack of shift-invariance. The non-subsampled contourlet transform (NSCT) is a new method that can overcome the above-mentioned shortcomings, which is widely used in image fusion fields. 14
In addition, an effective fusion rule is another important factor that impacts the fusion results. How to design a useful fusion strategy for fusion has attracted scholars’ attention. Recently, researchers have put forward many fusion rules in different transform domains. 15 The common neighborhood evaluation measurement includes spatial frequency (SF), 16 sum-modified Laplacian, 17 and energy of edge. 18 However, it is not enough to just consider the neighborhood information, since it may lead to the loss of some details. The pulse-coupled neural network (PCNN) as a global algorithm can retain more detailed information. PCNN was first introduced by Eckhorn in 1990. 19 As there are some advantages like global coupling and pulse synchronization, PCNN has become a promising image fusion tool. However, due to its high computational complexity, some available image fusion algorithms with PCNN are not suitable for real-time applications. 20 Another limiting factors of traditional PCNN for image fusion is that many parameters need to be set up. 21 In order to improve the performance of image fusion algorithm based on the PCNN model, scholars have proposed lots of modified PCNN models. The intersecting cortical model (ICM) 22 is a simplified version of the PCNN. Compared with the conventional PCNN model, the ICM has the advantages of low computational complexity and simple in formulation. A new multi-channel model for medical image fusion (m-PCNN) is established by a set of parallel PCNN units with intra-channel and inter-channel linking. 23
There are two main characteristics of microscopy image fusion filed. First, the number of source images for fusion is far more than two images. Second, satisfactory fusion results are obtained by keeping details as much as possible from the source images. In this article, a new fusion algorithm for microscopy image fusion tasks combining NSCT and m-PCNN is proposed. After decomposing the source images using the NSCT, in the low-pass subbands, a novel permutation entropy (PE) based on variance, which can reflect the feature of the low-frequency subimages, is used to evaluate the weight of different source images. In the high-pass subbands, the region local energy, the region standard deviation (SD), the information entropy, the correlation of co-occurrence matrix, and the local image contrast are combined as five features of saliency map to construct a new measurement to the linking strength of m-PCNN. The novel sum-modified Laplacian (NSML)-based method is used to motivate the m-PCNN neurons. The coefficients of high-pass subbands in NSCT domain with lager firing times are selected as the final high-frequency coefficients of the fused image. The innovation of this algorithm is that two novel effective measures for different frequency subbands were proposed. Unlike traditional algorithms, the proposed algorithm not only takes account of the characters of single image but also considers the relationship between image sequences at the same position.
The structure of this article is organized as follows: Section “NSCT” introduces the theory of the NSCT. In section “PCNN,” a brief review of the traditional PCNN and the m-PCNN, and the adaptive m-PCNN are introduced in detail. Section “Proposed fusion scheme–based NSCT and m-PCNN” introduces the fusion algorithm of this article. Section “Experimental analysis” gives the several experimental results and the proposed algorithm is compared with other algorithms. Concluding remarks are given in section “Conclusion.”
NSCT
As a new MST analysis tool, NSCT is different from other MST methods, such as DWT and SWT, and has many advantages for image processing. First, using up sampling technique in filter contributes to overcome the shortcoming of contourlet transform without the property of shift-invariance. Second, the directional filter banks are employed to implement multi-direction decomposition. Hence, the NSCT can retain more image details. Finally, since NSCT has the characteristic of anisotropy, it can effectively represent the high-dimensional singularities than wavelets. In summary, NSCT shows a better performance in areas with low constraint degree of data redundancy, such as image fusion.
The structure of the NSCT is shown in Figure 1. NSCT can be divided into two parts: non-subsampled pyramid (NSP) and non-subsampled directional filter bank (NSDFB). The former part maintains the multi-scale property using a pair of non-subsampled filter banks. A high-frequency image and a low-frequency image are obtained at each decomposition level. The low-frequency image is utilized as input of the next decomposition level. As a result, NSP can produce

Structure of the NSCT.
PCNN
The PCNN, which is different from the process of traditional neural network, was proposed by Eckhorn in order to explain the synchronous pulse bursts in the visual cortex of the cat. It is proved that PCNN is a useful tool which gets valid information from the complex background effectively. 19 As PCNN does not need to be trained throughout the process and its process is more accordant with the physical foundation of the human visual neural system, it is widely used in image segmentation, image de-noising, and image fusion. 24
The basic model of PCNN is depicted in Figure 2. It contains three parts: receptive field, modulation field, and pulse generator. The receptive field is divided into two parts by received signal. One of them is called linking input, and the other is called feeding input. Only the feeding input can accept the stimulus


where

PCNN model.
The main function of modulation field is to regulate the ratio between the two channels. The internal state

The pulse generator is composed of the internal state


where
m-PCNN
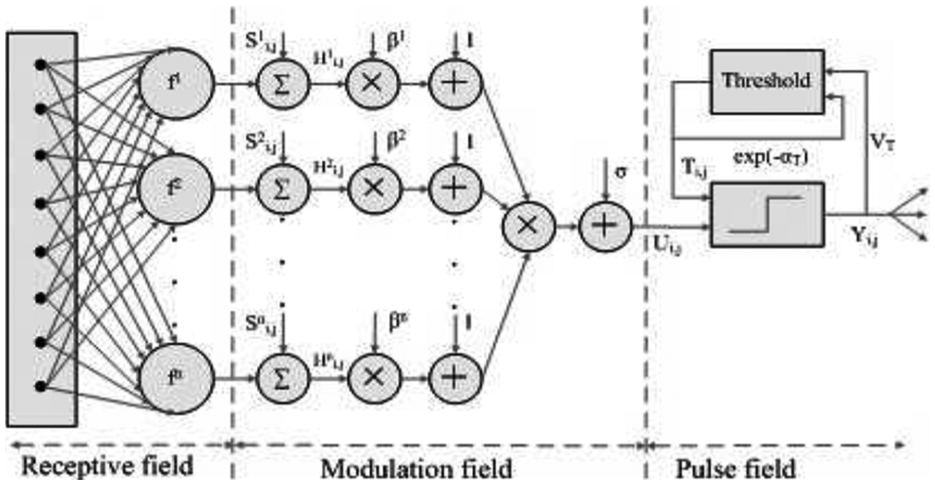
Although the PCNN methods have a wide range of advantages in image processing, it still have some shortcomings that cannot be ignored. First, parameter setting mainly depends on experiential knowledge which may lead to incorrect results. Second, the iteration number is usually set to a constant that may be time-consuming. Third, the fusion task which has more than two source images is an iterative process with sophisticated mechanisms. In order to overcome the above drawbacks, a new model called m-PCNN has been proposed by Wang. 23 As shown in Figure 3, unlike the traditional PCNN, the m-PCNN model can be applied to microscopy image fusion filed which has special requirements for good expandability. The mathematical equations of m-PCNN can be described as follows


where
m-PCNN model.
The main advantage of m-PCNN model compared to the traditional PCNN is that it has more external inputs. For traditional PCNN, if there is a task to deal with multiple image fusion, the whole process must be iterated as shown in Figure 4. However, for m-PCNN, it can receive multiple inputs at the same time, thus it accomplishes the whole process of fusion by only requiring single PCNN instead of multiple PCNNs.

Multiple image fusion in traditional PCNN model.
Adaptive m-PCNN
In m-PCNN, the linking coefficient
In recent years, researchers have developed many methods for determining the linking strength. A new gradient measurement took a sigmoid function as linking strength. 11 The region feature was made to strengthen the self-adaptive in Wang et al.’s 18 work. The local SD as the linking strength can give more exact expression to the intensity of local information in transform domains. 25 However, for microscopy image fusion, the requirement of details preservation is usually incompatible. It is hard to satisfy the requirement only by single evaluation method.
In this article, a multi-judgment measure of the clarity of each source images as the linking strength of corresponding neuron is designed. It is well known that gradient is the most striking feature in an image and it reflects the clarity of the image. First, we need to determine the saliency analytical method on multi-focus images, and then get the saliency maps. Second, according to trend analysis of saliency maps, the formula of the linking strength can be derived.
Saliency analysis based on image
A region or pixel is in focus with higher saliency. In order to enhance the fusion result, an effective saliency feature extraction method should be well designed. In addition, it is true that human visual system has strong ability on identifying the texture in the image. The region which has large contrast is always easily captured by human eyes in a complex scene. Inspired by this, a new method for saliency analysis through the comparison between the pixel value of block center and the value of neighborhood pixels is proposed. A saliency map with the same size of source image

where

Experiment on clock to illustrate the saliency map of different methods: (a) source image, (b) our saliency map, and (c) Sobel result.
Trend analysis of saliency map
In order to analyze the change trend of the saliency map sequences, not only the measurement method is considered in the internal structure information of an image but also the variation of the same pixel position in continuous saliency maps. Therefore, five features are used to quantify this trend.
Feature

where
Feature
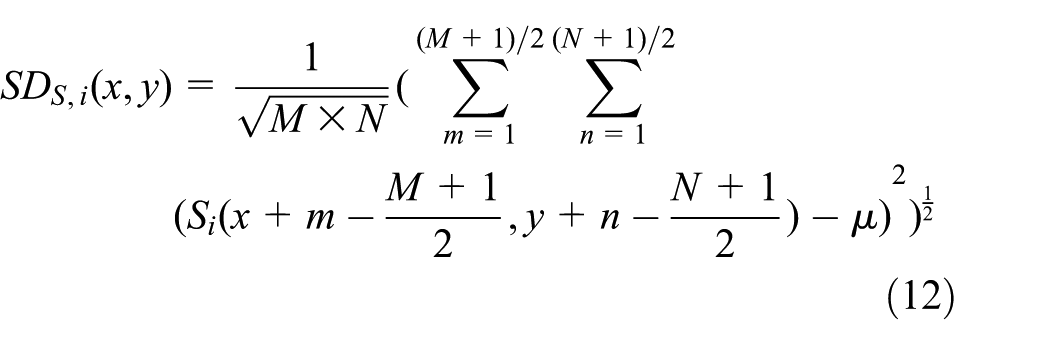
where
Feature

where
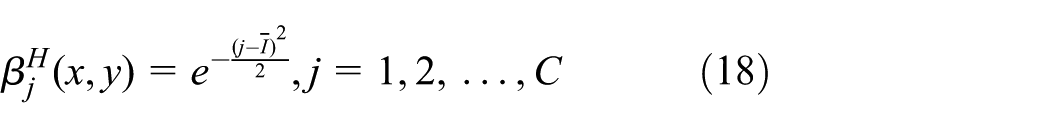
Feature

where
Feature

where
An index function can be defined to get the maximum index among the five features

where

where
Proposed fusion scheme–based NSCT and m-PCNN
Rule of low-frequency subbands
The low-frequency subbands represent the approximation component of the multi-focus images. An effective fusion rule assigned to get a good performance of the fused image is essential. Some researchers have proposed many fusion methods of the low-frequency subbands, such as local energy-based selection scheme, 26 novel sum-modified Laplacian, 27 and weighted average. 28 However, these methods may reduce the contrast of the fusion image. It is well known that an image with some low-level visual features like edges and corners is very friendly to human vision system. So, it is not enough to determine the low-frequency subbands used in the above methods. In order to observe the small variations of the low-frequency subbands, a novel measure based on image variance permutation entropy (VPE) is proposed to meet the requirement.
PE is an effective analytic tool for measuring the time series.
29
There are many advantages of PE algorithm such as low computational complexity, and it amplifies slight changes of a time series effectively. For low-frequency subbands, a measurement of the regional variance is treated as time series in PE algorithm because most of the image energy is retained in low-frequency image. The low-frequency image is divided into several non-overlapping regions whose size is

where

Then, the reconstruct vector
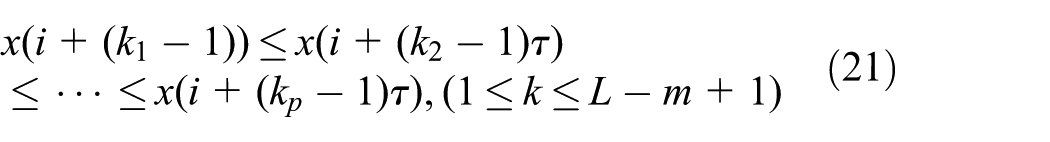
The symbol sequence

There are
After normalization processing, the new PE can be obtained by the following equation

Then, the PE of the next subsequence

As a result, the final low-frequency coefficients of the block image

In this article, the embedding dimension
Rule of high-frequency subbands
The high-frequency subbands represent the details of the source image. However, the traditional method motivates the neuron directly using the high-frequency coefficients, because the coefficients are not only representative of details but also possible noise. As features can represent more abundant information than pixels, it is reasonable to replace pixels with features. The NSML-based method can be used to motivate the adaptive m-PCNN neurons. The expressions of NSML is defines as follows

where


Image fusion algorithm
In this article, a novel image fusion algorithm is presented using NSCT and adaptive m-PCNN technique for microscopy image fusion. The source multi-focus images have got strict registration. Figure 6 displays the whole process in detailed steps.
Decompose the source multi-focus images into low-frequency subbands and a series of high-frequency subbands via NSCT.
For the low-frequency component fusion, the VPE is calculated via equation (24) in the slipping local window of each low-frequency subbands, and then, the fusion coefficients for the low-frequency subbands from source images is obtained via equation (26).
According to equation (10), a series of saliency maps can be obtained from the source images to prepare for the following feature analysis. From equations (11) to (18), the final formula of the linking strength
For the high-frequency component fusion, the NSML is computed via equations (27) and (28). Then, NSML in high-frequency subbands are input to m-PCNN to motivate the neurons. And then, the high-frequency images with large firing times are selected as the final high-frequency coefficients of the fused image.
The new fused coefficients of subimages are used to reconstruct the fused image by taking an inverse NSCT.

Proposed image fusion algorithm.
Experimental analysis
Linking strength
of m-PCNN
This section discusses the influences of the linking strength

Source image.
Figure 8(a)–(e) shows the five features of sample point 1. The linking strength

Sample point 1: (a) feature 1, (b) feature 2, (c) feature 3, (d) feature 4, (e) feature 5, and (f)
Figure 9(a)–(e) shows the five features of sample point 2. Feature 4 and 5 produce ambiguous results, while the proposed method eliminates the difference of features.

Sample point 2: (a) feature 1, (b) feature 2, (c) feature 3, (d) feature 4, (e) feature 5, and (f)
Figure 10(a)–(e) shows the five features of sample point 3. It can be seen from the figures that these features produce consistent results. Furthermore, compared with the result in Figure 14(h), the fusion results show the validity of the proposed saliency analysis method.

Sample point 3: (a) feature 1, (b) feature 2, (c) feature 3, (d) feature 4, (e) feature 5, and (f)
Parameter setting
Seven excellent fusion algorithms are compared with the proposed algorithm. All the methods based on NSCT use the “9-7” wavelets in scale decomposition and “pkva” wavelets in NSDFB.
Method 1: The direct average method. 30
Method 2: PCA-based method. 31
Method 3: Wavelet-based algorithm WT-AVG-MAX in which the averaging is used for the low-frequency subbands and maximum selection rule for the high-frequency subbands. The decomposition level is set to five and the wavelet filter is set to “db4.” 32
Method 4: Shift-invariant discrete wavelet transformation is based on algorithm with averaging and maximum for low- and high-frequency subbands. “db4” wavelets and five-level decomposition are adopted. 33
Method 5: The NSCT algorithm NSCT-AVG-MAX, in which the low-frequency subbands used the method of averaging and the high-frequency subbands used the method of absolute maximum choosing scheme. The decomposition level is
Method 6: In NSCT domain NSCT-AVG-PCNN, the averaging scheme and the PCNN scheme are used for low-frequency coefficients and high-frequency coefficients, respectively, and the NSCT decomposition level is
Method 7: The method based on NSCT used the spatial frequency–motivated PCNN model NSCT-AVG-SFPCNN with the decomposition level
Method 8: The proposed fusion method, where the NSML and m-PCNN are used for high-frequency subbands and the VPE is used for low-frequency subbands with the decomposition level
To evaluate the above methods objectively, the entropy (EN), the SD, and Petrovic metric (Q) are regarded as the evaluation indexes.
The entropy is used to reflect the information of image. The entropy of image is defined as follows
where
The SD is used to measure the contrast of image. The larger the SD, the higher the contrast of an image

where

where
Performance analysis
In order to confirm the performance of the proposed algorithm, three different groups of microscopy images have been used to test in this section which are shown in Figures 11, 12 and 14. All source images have the same size of

Source images for experiment 1.

Source images for experiment 3.

The fusion images of experiment 2: (a) method 1, (b) method 2, (c) method 3, (d) method 4, (e) method 5, (f) method 6, (g) method 7, and (h) method 8.
Source images for experiment 2.

Fusion images of experiment 1: (a) method 1, (b) method 2, (c) method 3, (d) method 4, (e) method 5, (f) method 6, (g) method 7, and (h) method 8.
The fusion images of experiment 3: (a) method 1, (b) method 2, (c) method 3, (d) method 4, (e) method 5, (f) method 6, (g) method 7, and (h) method 8.
The fusion images of the first-group microscopy images are shown in Figure 15. Figure 15(h) shows the result of the proposed algorithm. Figure 15(a)–(g) shows the fusion results based on the other seven algorithms described above for comparison. It is obvious that the proposed algorithm can achieve better visual effect than others. In Figure 15(a) and (b), the contour of the object is difficult to be identified since the fused images have low contrast. As shown in Figure 15(c), the fusion result of method 3 shows many artifacts around slope areas because the wavelet takes shift-invariance. Figure 15(e) and (f) indicates that the NSCT methods show better performance in fusion images compared to wavelet method. However, not all useful information of the source images can be retained in fusion result. In Figure 15(g), although the details of the fused image has been improved, the contrast of the source images is not well protected. As a result, the proposed fusion algorithm not only keeps most of the useful information of source images but also reduces the artifact during the whole fusion process.
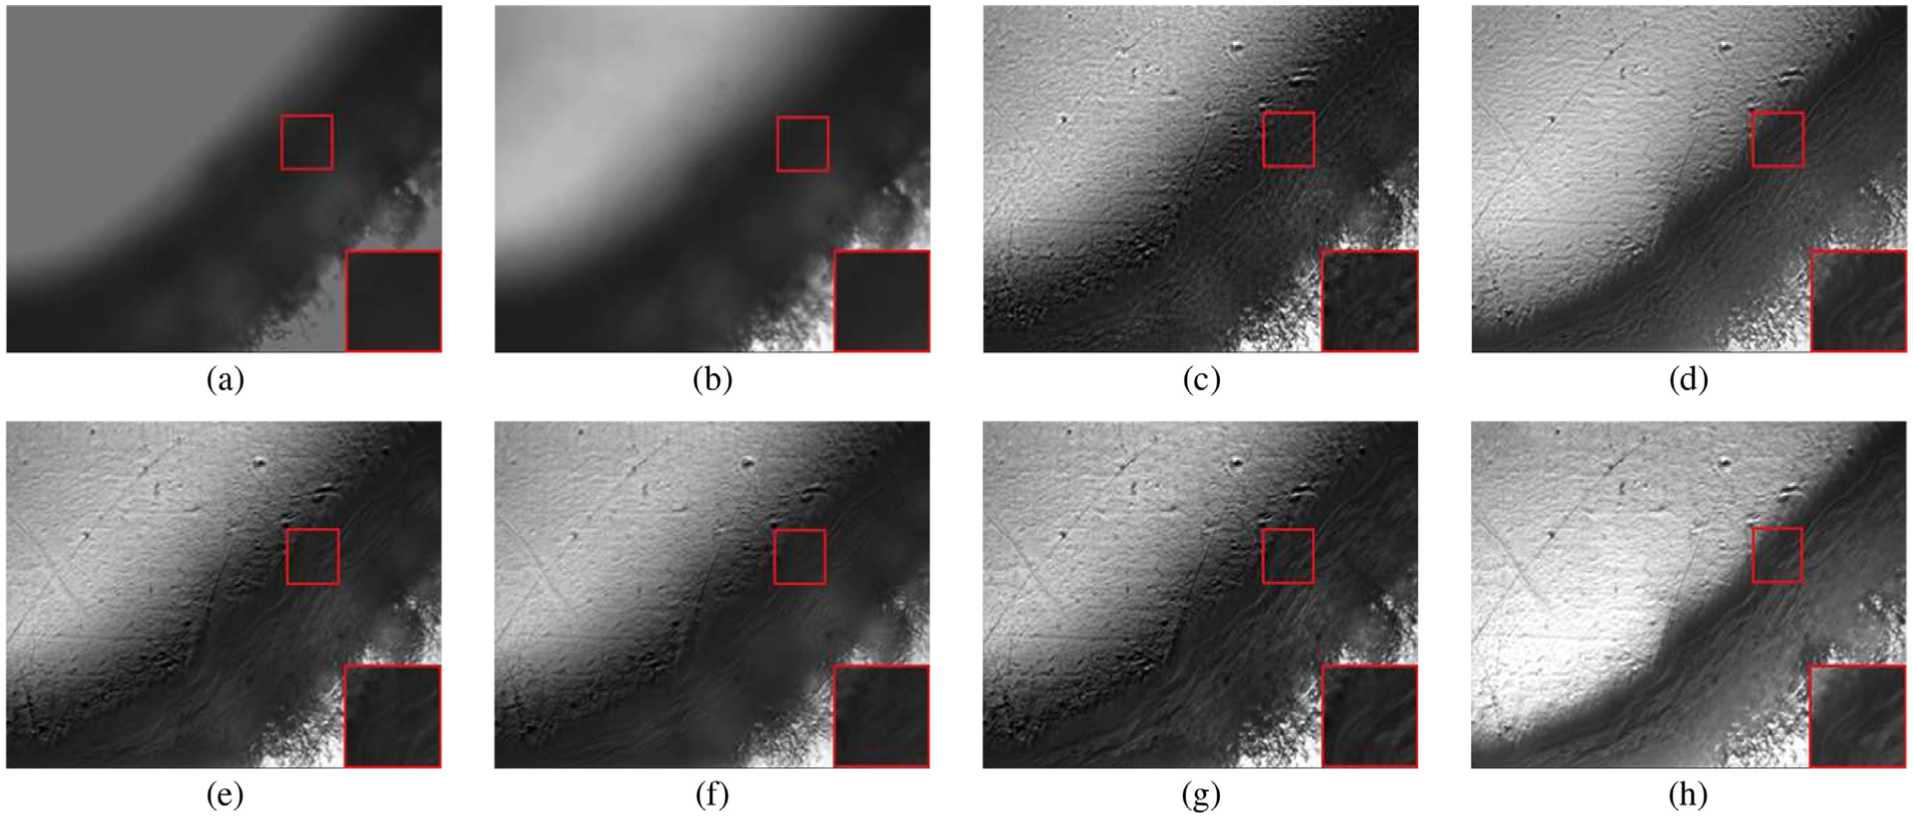
The microscopy images of the second experiment are shown in Figure 14. The metallic surface has the property of high light. Figure 13(a)–(h) shows the fused results of different fusion algorithms. It is clear that Figure 13(a) and (b) generated by method 1 and method 2 do not contain the information in source images at the same position. In Figure 13(c), the information is significantly distorted. The NSCT results (Figure 13(e) and (f)) contained artifacts in the edge regions. In Figure 13(g), although the fusion result generated by method 7 looks reasonable to the human eyes, the contrast in slope regions is lower than that in the image obtained by the proposed algorithm. These results indicate that the proposed algorithm can retain the contrast information more effectively, meanwhile, the detailed information of the metal profile is better preserved than others.
The rest of the microscopy images are shown in Figure 12, and the fusion images based on the above algorithms are shown in Figure 16. It shows that the region labeled by a red rectangle has lower contrast from the source images. Methods 1 and 2 cannot refine the detailed information of the original images. In Figure 16(c), although the contrast of the fused image has improved, there exists jaggy artifact in the edge of image due to the pseudo-Gibbs effect. In Figure 16(d) and (e), the fused ones suffer from the problem of artifacts. Fused results based on method 6 are blurred, such as the slope in the red box. Compared to Figure 16(g), the final result based on the proposed algorithm has much more reasonable contrast level and better visual effects. In Figure 16(h), the proposed algorithm well retains the details of the white areas in the original images. In summary, comparison results indicate that the proposed algorithm is more clear and more accurate than others in some lightless areas.
It is not enough to evaluate the fusion results only using the subjective evaluation method, hence three different performance measures are used for quantitative analysis of results. The results of different fusion algorithms are shown in Table 1. The SD values of the different fusion algorithms show that the proposed fusion image has better contrast than others. From the results of the second index, it is easy to find that the proposed fusion algorithm gets higher value of entropy than others. Another metric value is
Objective evaluation of fusion image quality.

Conclusion
In this article, a new microscopy image fusion algorithm based on saliency analysis and adaptive m-PCNN in NSCT domain is proposed. The NSCT is used to decompose each of source images into a low-frequency subband and a series of high-frequency subbands. Then, a measurement based on the image VPE, which reflects the slight changes in subimages, is used to evaluate the low-frequency subbands. For the high-frequency subimages, an NSML method is selected to motivate the adaptive m-PCNN neurons. The linking strength of the adaptive m-PCNN is determined by a multi-judgement measure of the clarity in each source image. Finally, the selection rules for different subbands are given based on the weight measures. Experiments are carried out for validation of the proposed algorithm’s effectiveness. The objective evaluation and visual quality results prove that the proposed algorithm is superior to other fusion algorithms in terms of both detail-preserving and contrast-enhancing.
Footnotes
Academic Editor: Shahnawaz Khan
Declaration of conflicting interests
The author(s) declared no potential conflicts of interest with respect to the research, authorship, and/or publication of this article.
Funding
The author(s) disclosed receipt of the following financial support for the research, authorship, and/or publication of this article: This work was supported by the National High Technology Research and Development Program of China under grant no. 2015AA015408 and the West Light Foundation of The Chinese Academy of Sciences under grant no. 2011180.