
Abstract
As a dynamic detecting method for abrupt information, permutation entropy could effectively reflect the subtle change in time series data, which is also simple and can be computed conveniently. Based on the permutation entropy, some improved methods for detecting weak abrupt information hidden in time series data are presented, such as permutation entropy spectrum, second permutation entropy, and second permutation entropy spectrum. Through some simulation examples, these new methods are compared with the existing single permutation entropy and approximate entropy, and the results show that these methods can more effectively detect the much weaker abrupt information. Especially, the second permutation entropy spectrum is very robust even if the periodic abrupt information is very weak.
Keywords
Introduction
It is very important to detect the abrupt information in various signals because the abrupt points often contain abundant characteristic information. In mechanical system, the reason for signal abruption is possibly due to impact shock, speed fluctuation, structure deformation or fracture, and so on, which would generally lead to mechanical fault and affect the safety seriously. Thus, the study on detecting abrupt information is very important and meaningful.
There are many kinds of methods for detecting abrupt information, such as Fourier transform, wavelet analysis, singular value decomposition, higher-order cumulant, detrended fluctuation analysis, and approximate entropy.1–17 Fourier transform could only determine the overall nature of the abrupt information, which was difficult to determine the exact time position of the abrupt point embedded in signal. Wavelet analysis could meet the requirements for detection of signals with multiple frequencies. But in the procedure of detecting abrupt point, the results would be affected by the selections of wavelet transform coefficients and wavelet basis functions. Singular value decomposition was just used to analyze the time domain signals, which had not used the information in frequency domain. 8 He and colleagues11–15 presented several efficient methods for detection of abrupt information, and some mathematical tools such as the higher-order cumulant, detrended fluctuation analysis, approximate entropy, conditional entropy, and permutations slopes were used in these methods. They11–15 applied those methods to detect abrupt change in different dynamic structures and verified the feasibility and robustness by some different examples.
The permutation entropy (PE) was also useful tool in signal processing. 18 Bandt and Pompe 19 proposed PE to measure the complexity of one dimension time series and found that its performance was similar to Lyapunov exponent. Comparing with Lyapunov exponent, PE was more simple and anti-noising in the calculation. As a new detecting method for abrupt information of the complex system, PE had been widely used in many fields, such as medicine, biology, and climate.20–25 In recent years, it had received more and more attention in the field of mechanical fault diagnosis26–28 and used to detect the abrupt information from different mechanical devices.
In this article, some improved methods based on PE for detecting weak abrupt information are proposed, such as permutation entropy spectrum (PES), second permutation entropy (SPE), and second permutation entropy spectrum (SPES). This article is organized as follows. First, the properties of PE are presented and simply summarized. Second, the three presented methods are introduced, and the property of doubling frequency in PES is illustrated through an example of sinusoidal signal. Then, the simulation examples of detecting weak abrupt information in time series are studied, and these new methods are compared with the existing single PE and approximate entropy. The results demonstrate that these methods can more effectively detect the much weaker abrupt information hidden in regular signals. At last, the main conclusions are drawn.
Basic principle of PE
The basic principle of PE was described in detail in Bandt and Pompe
19
and Cao et al.
29
To illustrate the basic idea, an arbitrarily scalar time series
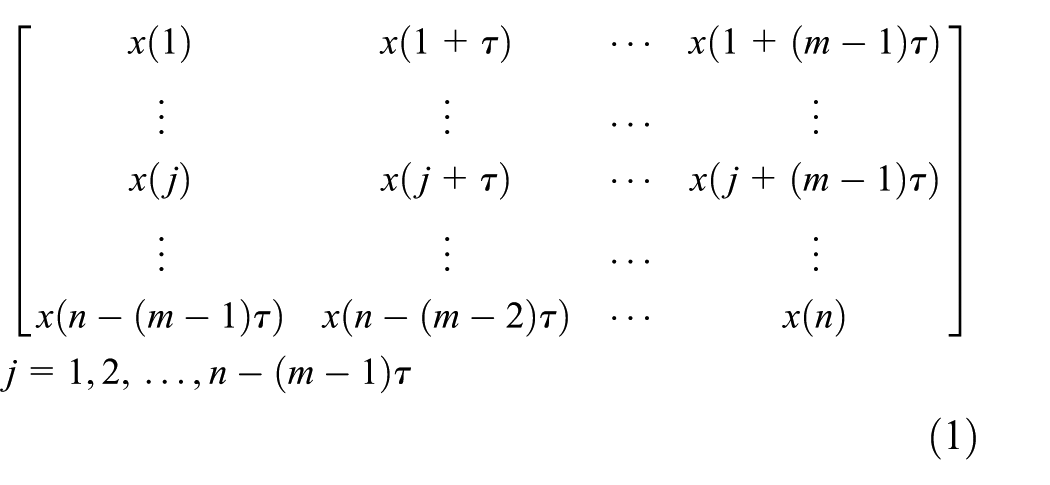
where m is the embedded dimension and

where
If two or more elements in the jth reconstructive component have the same value, for example

they could be arranged according to the value of

Accordingly, each row of the reconstruction matrix can be mapped into a group of symbols as

where

Obviously, if all the symbol sequences have the same probability as

The value
Improved methods for detecting weak abrupt information based on PE
When applying PE in detection of abrupt information hidden in periodic signal, the authors found it is difficult to detect the characteristics of the abrupt information by directly observing the change in PE if the abrupt information is weak. Accordingly, we put forward some improved methods to effectively detect the weak abrupt information hidden in periodic signal, which are named as PES, SPE, and SPES respectively.
PES
The PES is defined as the frequency spectrum of PE through Fourier transform. The specific calculation procedure is as follows.
Given the time series as

one could obtain the frequency spectrum called as PES.
SPE
In the study on PES, it may be difficult to detect some weak periodic abrupt signal. Hence, the method named as SPE is proposed. As the name implies, SPE is the PE of the obtained PE series.
Hence, the specific calculation procedure is very similar to the PE. Given the time series
SPES
As for the very weak periodic abrupt information hidden in other signal, the aforementioned methods may be invalid. Accordingly, the SPES is further presented in this article.
The calculation procedure of SPES is also similar to the calculation of PES. After the PE series

one could obtain the SPES.
Summarization on the three new methods
Obviously, the aforementioned three new methods are intuitively provided based on the properties of PE. Maybe it is difficult to establish rigorous mathematical theory for those methods. Accordingly, different numerical examples and comparison with other methods are presented in the next section, which could be used to illustrate the effectiveness of those new methods.
Simulation analysis of the new methods
When calculating the PE, it is important to choose the embedding dimension m, time delay
Periodic pulse hidden in the sinusoidal signal
Choosing the simulation signal as
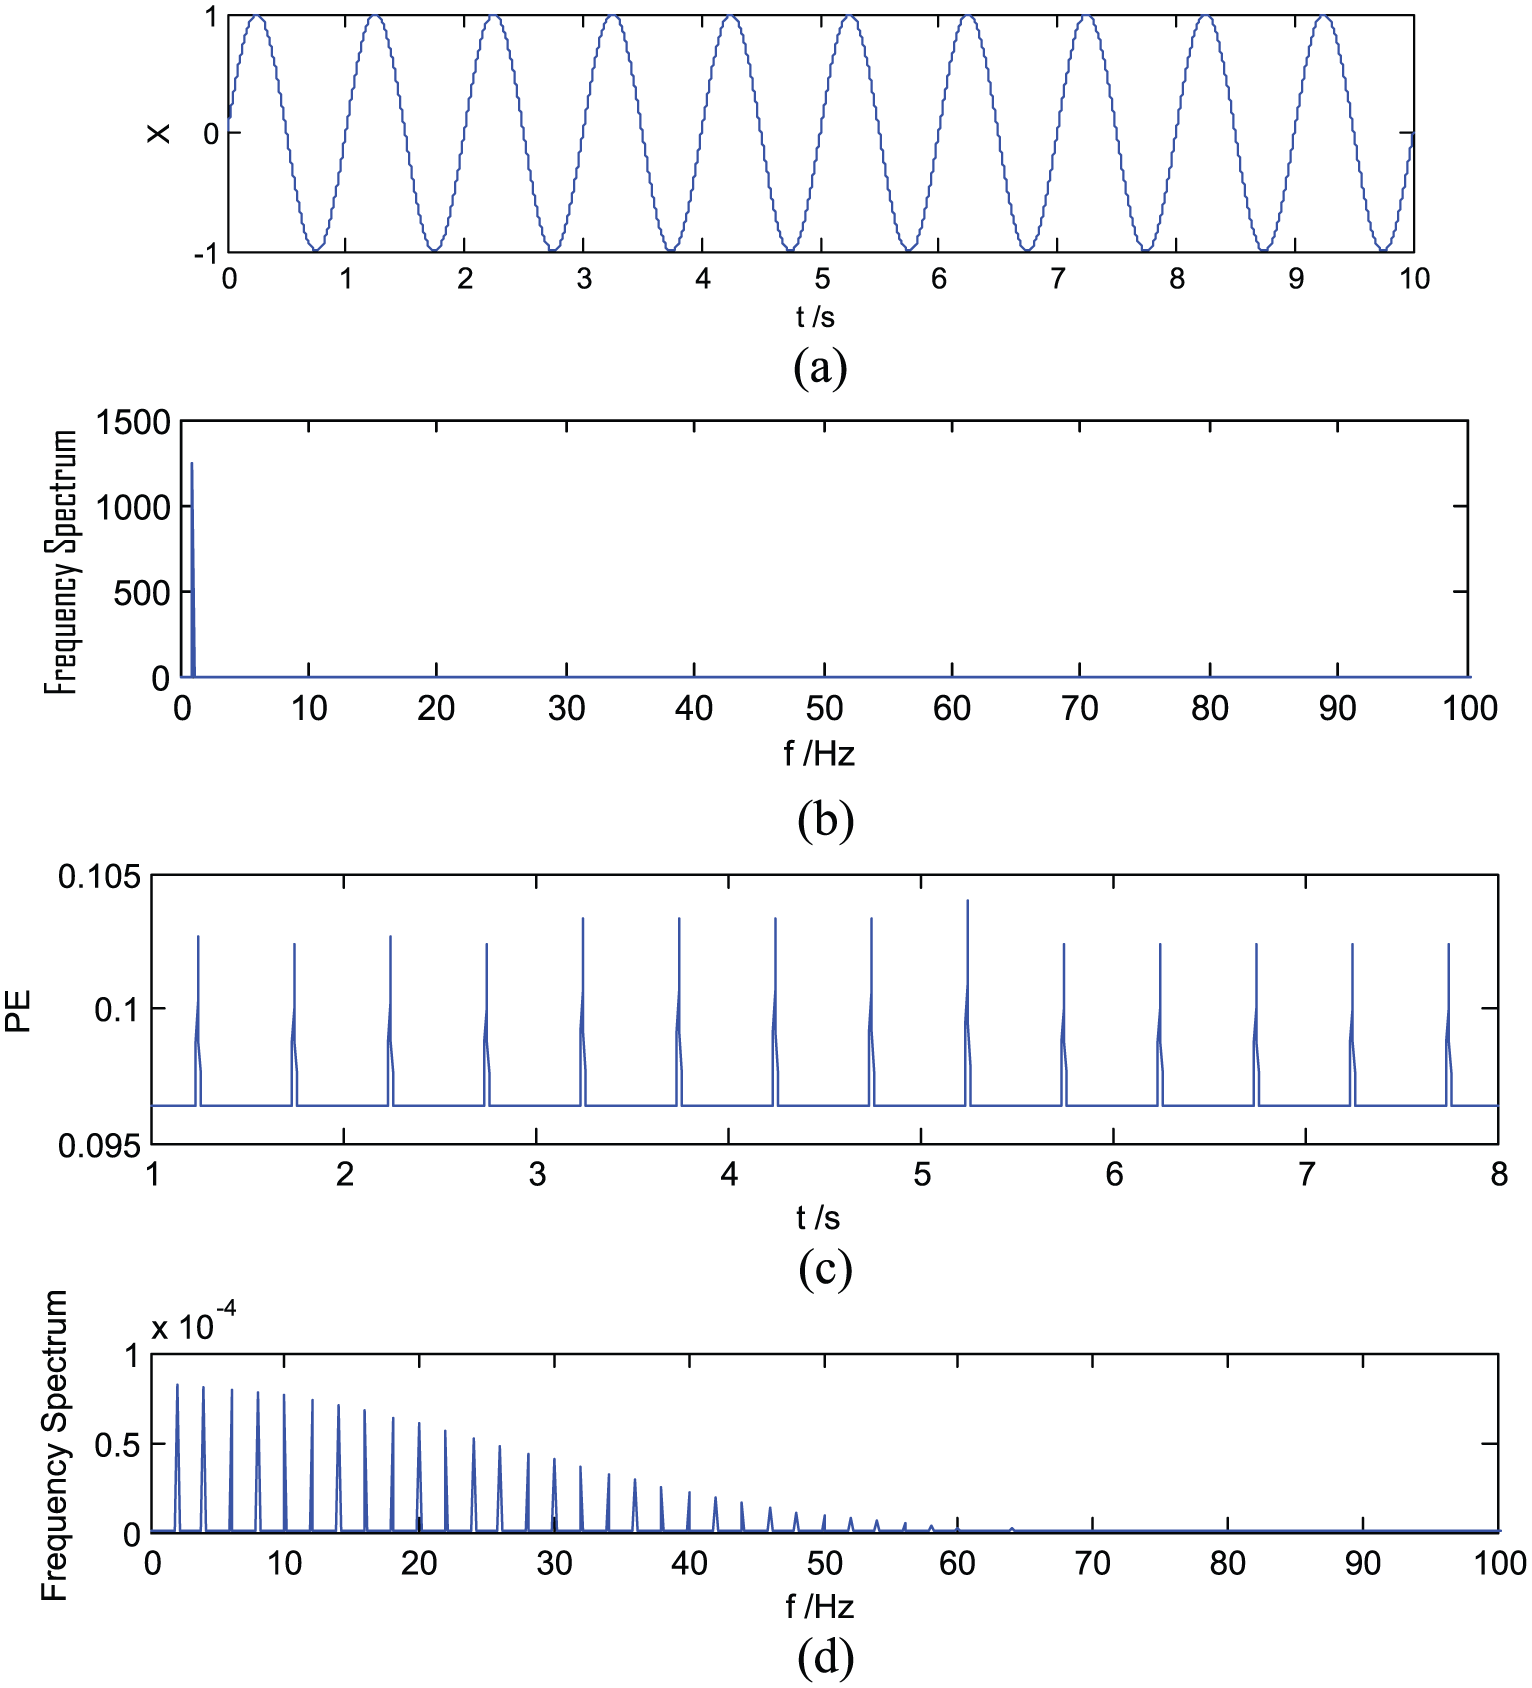
Simulation results of the pure sinusoidal signal: (a) time history of the simulation signal, (b) frequency spectrum of the simulation signal, (c) PE of the simulation signal, and (d) PES of the simulation signal.

Simulation results of periodic pulse hidden in the sinusoidal signal: (a) time history of the simulation signal, (b) frequency spectrum of the simulation signal, (c) PE of the simulation signal, and (d) PES of the simulation signal.
Moreover, approximation entropy is selected as a tool compared with the method in this article. The approximation entropy and the corresponding spectrum of the above signal are shown in Figure 3. It could be found that the characteristic frequency f = 25 Hz almost cannot be seen from the spectrum, and only the frequency for sinusoid signal and its doubling frequency could be distinctly observed. It illustrates the better performance of the methods in this article.

Results of periodic pulse hidden in the sinusoidal signal by approximation entropy: (a) AE of the simulation signal and (b) AES of the simulation signal.
Modulated signal
In this subsection, the simulation signal

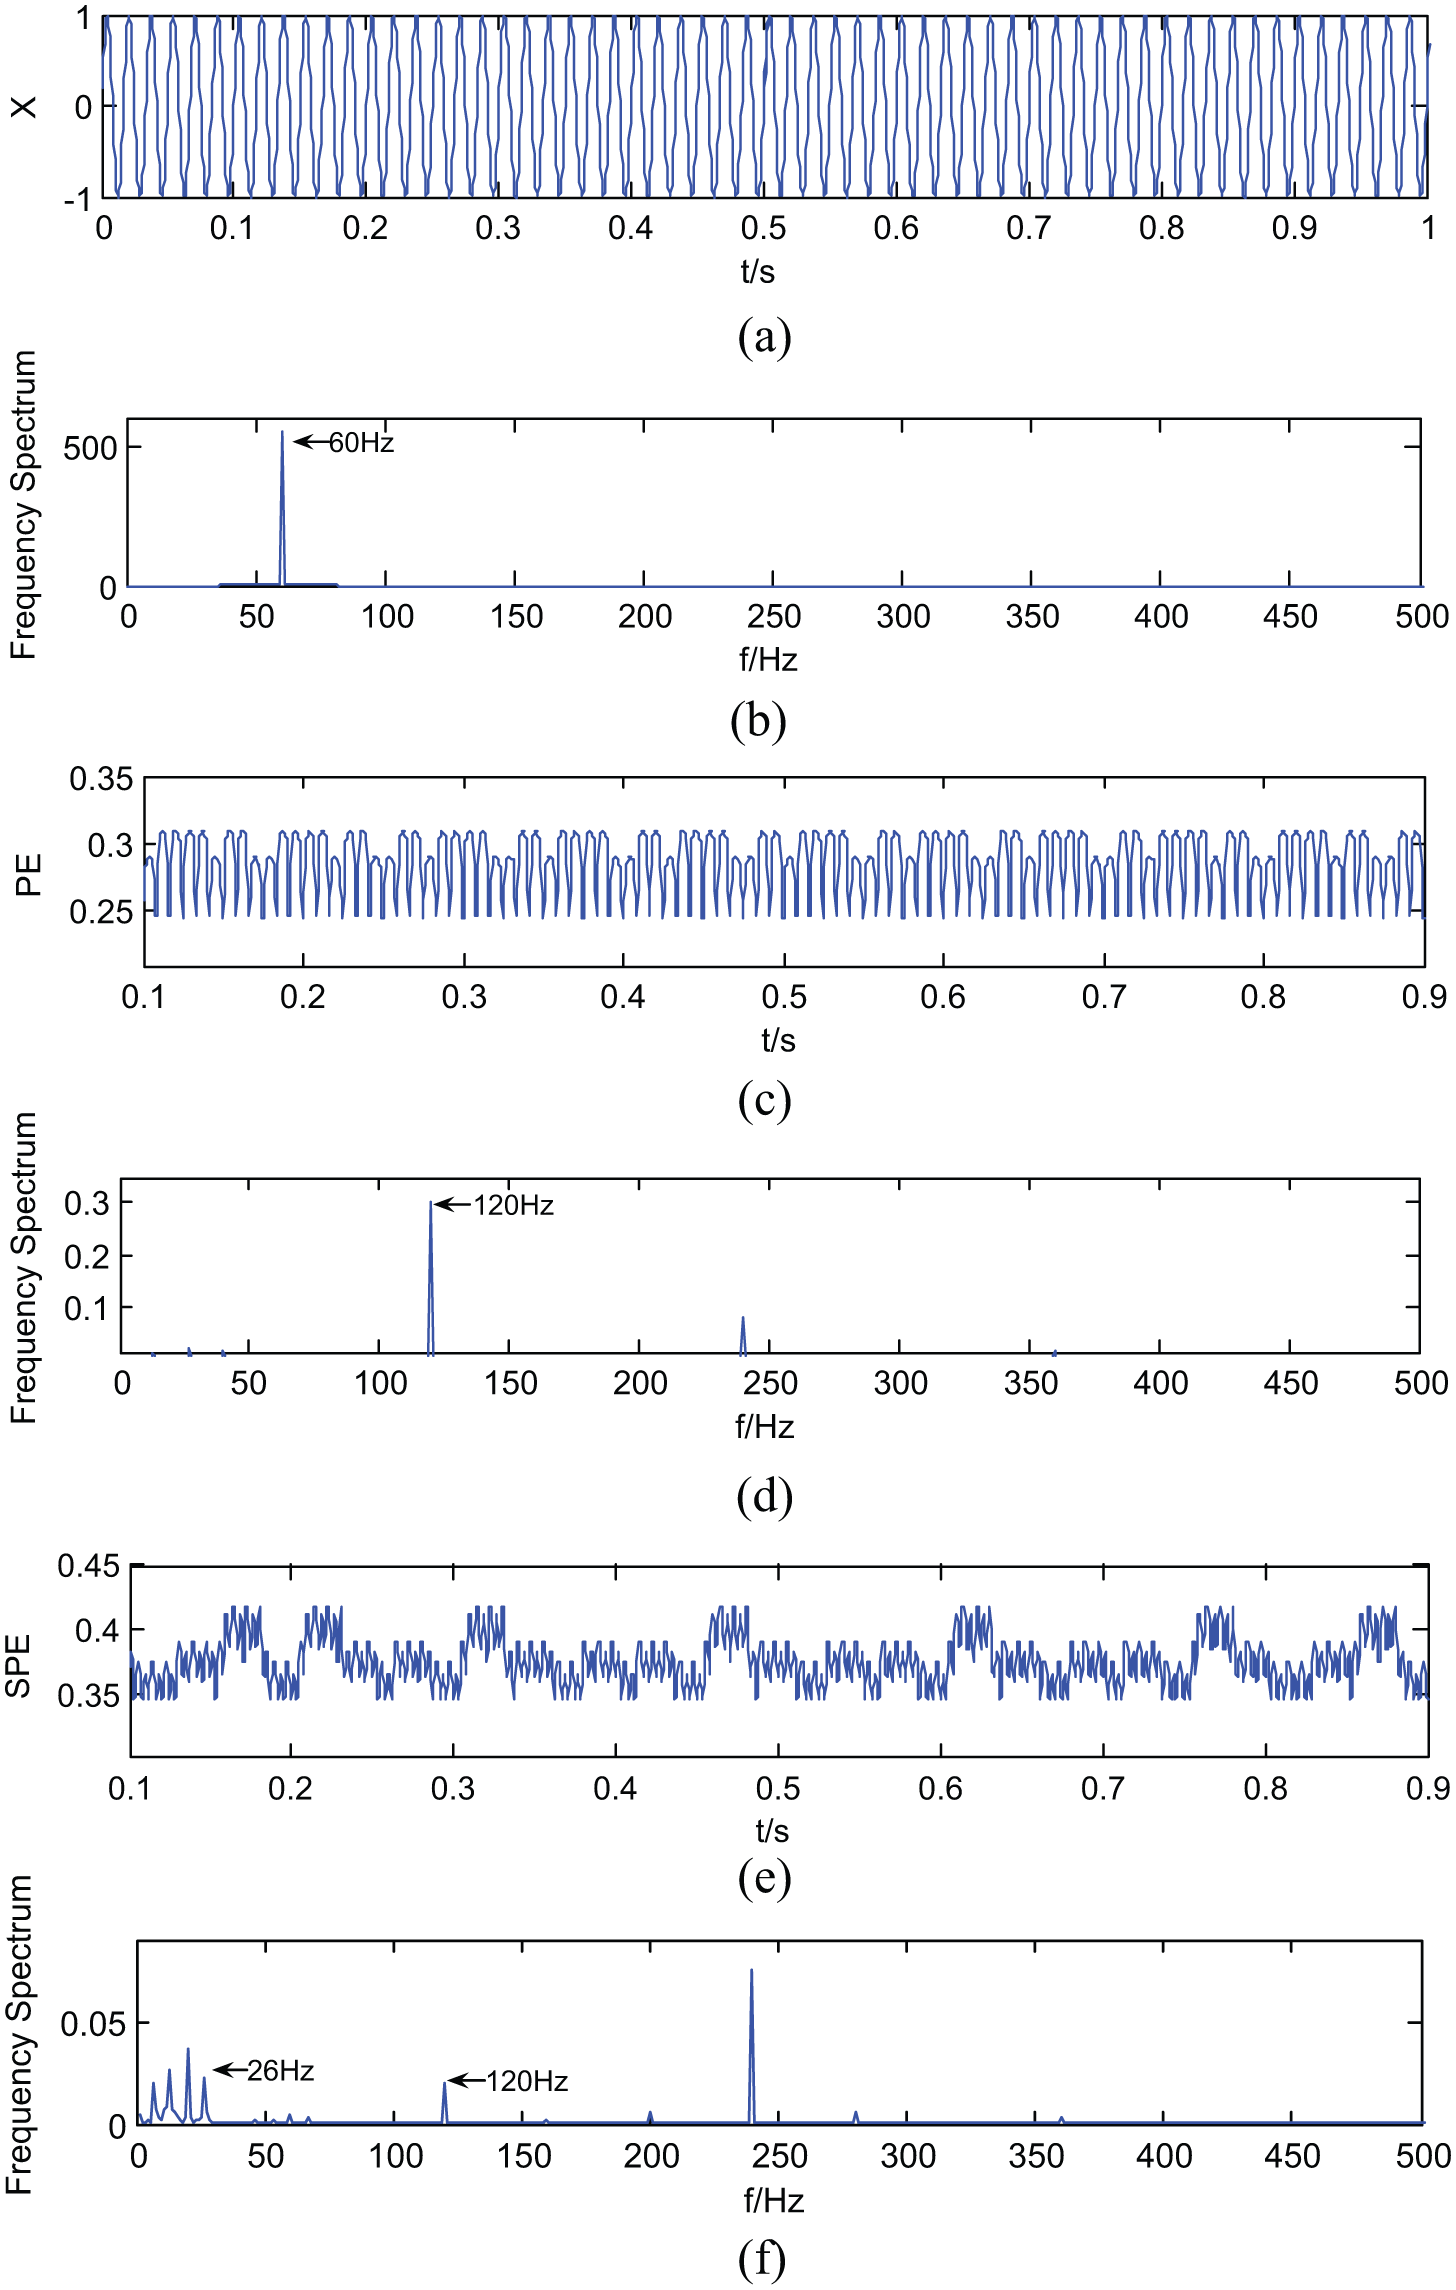
Simulation results of modulation signal (modulation index β = 0.008): (a) time history of the simulation signal with modulation, (b) frequency spectrum of the simulation signal, (c) PE of the simulation signal, (d) PES of the simulation signal, (e) SPE of the simulation signal, and (f) SPES of the simulation signal.
In the studying procedure, it is also found that the main features could still be observed by the SPES even if the modulation index is very small. The simulation results are as shown in Figure 5, where the modulation index is β = 0.000001, the sampling frequency is 2000 Hz, and the sampling time is 1 s. It can be seen that Figure 5 is similar to Figure 4. The time history of the simulation signal is presented in Figure 5(a), and the frequency spectrum of the simulation signal is given by Figure 5(b). The dominant frequency can be found obviously from this figure, but the modulation frequency can hardly be seen. Figure 5(c) shows the PE of the simulation signal from 0.1 to 0.9 s, and the PES of the simulation signal from 0.1 to 0.9 s is shown in Figure 5(d). Obviously, the modulation frequency can hardly be seen. Figure 5(e) shows the SPE of the simulation signal from 0.1 to 0.9 s, and the SPES of the simulation signal is shown in Figure 5(f). It is easy to find the characteristic frequency of the dominant frequency and modulation frequency in SPES. That means the SPES is robust even if the abrupt information is very weak compared with the regular signal.
Simulation result of modulation signal (modulation index β = 0.000001): (a) time history of the simulation signal, (b) frequency spectrum of the simulation signal, (c) PE of the simulation signal, (d) PES of the simulation signal, (e) SPE of the simulation signal, and (f) SPES of the simulation signal.
From the above simulation results, it can be found that the frequency component of sinusoidal signal is obvious in the frequency spectrum, but the frequency component of the periodic pulse signal can hardly be observed. While they are presented in PES, the two frequency components of the sinusoidal and periodic pulse signals could be observed simultaneously. In the simulation results of the modulation signal, it is very difficult to find the modulated frequency component directly from the frequency spectrum and the PES. But the doubling frequency for the modulated component can be found clearly in SPES, and it is interesting to find the fractional frequency of the dominant frequency and modulation frequency. Especially, when the modulation index of modulation signal is reduced to a very small level, the expected frequency components could be still easy to be found in SPES.
Conclusion
Based on PE, some new methods for detecting weak abrupt information in time series data are proposed, such as PES, SPE, and SPES. Through some simulation examples, it is illustrated that these new methods can more effectively detect weak abrupt information. Especially, the SPES is very robust even if the periodic abrupt information is very weak.
Footnotes
Academic Editor: James Lam
Declaration of conflicting interests
The author(s) declared no potential conflicts of interest with respect to the research, authorship, and/or publication of this article.
Funding
The author(s) disclosed receipt of the following financial support for the research, authorship, and/or publication of this article: The authors are grateful to the support by National Natural Science Foundation of China (No. 11372198), the Cultivation plan for Innovation team and leading talent in Colleges and universities of Hebei Province (LJRC018), the Program for advanced talent in the universities of Hebei Province (GCC2014053), and the Program for advanced talent in Hebei Province (A201401001).