
Abstract
A method to identify optimal strain sensor placement for examining structural static responses is presented. The method is based on the use of numerical optimization. Based on an assumed set of applied static forces, the optimal sensor placement can be obtained, and the measured strains can be used to provide the information needed to describe the structural stiffness. For example, the cross-sectional area can be determined by minimizing the difference between the analytical and measured strains. This approach is used to identify the optimized sensor placement. The objective of this study is to identify the minimum number of static strain sensors and the optimal sensor layout needed to evaluate a bridge’s structural condition. This study includes an automatic model parameter identification method, optimal static strain sensor placement, damage detection, and application to an actual bridge.
Keywords
Introduction
Bridge engineers are faced with deteriorating infrastructures, resulting in a continuing need to ensure that structures provide safe crossings when revenues are unavailable for replacement or repairs. Consequently, we are faced with an urgent need for a better understanding of the condition of each bridge crossing, that is, better visual bridge inspection tools and supplemental tools for quickly and reliably evaluating bridge conditions while in the field, such as “ambient measurement data,” 1 which can be obtained during inspections. Additionally, we need reliable structural health methodologies. These technologies should provide the owner with a real-time response that is based on a manageable number of sensors.
Sensor data should flag areas of potential concern. However, there are often too many sensors, and several are incorrect. Thus, the following items are presented for consideration: (1) identify economical and reliable methodologies to better evaluate the structure’s as-is condition through bridge inspections; (2) provide a plan for sensor placement as part of the design for new structures; (3) identify sensor placements during bridge repairs; (4) develop methodologies for using available sensor data to identify cracks and crack propagation; and (5) provide software and methodologies for determining the optimal number of sensors needed for a given bridge.
This study will only address the following three items: (1) for a given bridge, how can the optimal number of sensors and their locations be selected; (2) based on this sensor layout, possible damage can be identified, and we will illustrate “damage detection” for a given number of sensors; and (3) it is important to understand that the methodology described in this study can be used for numerous types of bridges.
In structural health monitoring, the engineer installs various types of sensors to establish a real-time monitoring system for evaluating structural safety.1–4 To evaluate structurally safe behavior, a numerical model is typically used to describe the “as-is” condition of the structure, which can be considered as a virtual model of the structure. The numerical model is prepared from the as-built construction drawings, which represent the “as-built” condition. It is expected that this model cannot be used to accurately describe the structural response for various loads because the structural properties will likely change over time. Subsequently, the “as-built” model needs to be updated based on the latest measurements.
There are two types of model updating methods that can be used to define an error function and assess the quality of agreement between the analytical and measured data: (1) manual model updating and (2) optimization techniques. A bridge model can be updated manually using static loading based on the measurement strain gage data. 5 Multi-direction model updating 6 is used to manually update the bridge model based on the structural member’s direction. An optimization algorithm may be used to minimize the difference between the analytical and measured data. 7 For example, Newton’s method was used by other research works to identify the change in the structural cross-sectional area for a numerical simple structure 8 and a simple structure laboratory test. 9 Furthermore, a Nelder–Mead simplex algorithm can be used successfully to update bridges’ static and dynamic measurements when gradient-based optimization algorithms have convergence problems. 10
This study presents several examples that can be used for updating the structural response using a numerical optimization method. Other researchers have updated the models automatically using Newton’s method and the steepest descent method. 11 Sensors are located on each truss member to measure strain. The numerical models are based on “as-built” conditions to examine their behavior. The cross-sectional areas are selected as design variables to be updated because the most apparent problem for steel structures is that the members’ cross-sectional area may be reduced by corrosion and/or collision. In this study, the updated analytical strains converged to the measured strains. After using a sequence of searching steps, the damaged cross section of each truss was determined.
In this study, an objective function was used to measure the quality of agreement between the analytical and measured data. One practical question that naturally arises is how to select a minimum number of sensor locations from all possibilities so that the data collected can provide adequate information for the identification of structural behavior using a numerical optimization method. 12 Reducing the number of sensors will not only reduce the cost of equipment but also save installation time. Sensor layout optimization is essential for structural health monitoring. The sensor’s number and location should be optimized when planning a structural health monitoring system. A new sensor optimization method is presented in this study to assist the engineer in evaluating the location as well as the number of sensors that should be used to evaluate the structural response. In previous studies, the optimal dynamic sensor placement was studied based on several types of bridges and buildings using dynamic measurements.13–17 However, there are few studies that discuss sensor placement optimization based on static measurement data. This study presents an optimal strain sensor placement method, which includes the optimal strain sensor number and layout for damage detection, and applies it successfully to an actual truss bridge.
Furthermore, this study established a new method for damage detection for a large-scale structure. For a large-scale complicated structure, whose finite element model may have thousands, tens of thousands, or even hundreds of thousands of degrees of freedom (DOFs), an exhaustive search would be extremely time-consuming or nearly impossible. Thus, a systematic and efficient approach is needed to solve a computationally demanding problem. 12 This study applied a numerical optimization method to identify damage for the Klehini River Bridge, an Alaskan highway bridge. 18 This was performed using displacement sensor data to separate the large-scale problem into segments, thus detecting the damage based on one segment instead of the entire bridge. This new method for damage detection can transfer a large-scale complicated structure into a simple segment, which is solved successfully using the numerical optimization method.
This study on designing a static strain sensor layout for automatic model updating was successfully applied to an actual bridge. Using the recommended numerical method to optimize the number of sensors and their layout during the planning stage to develop a structural health monitoring system, the equipment and labor costs related to the installation can be reduced. This application can evaluate large-scale bridge safety conditions using a limited number of static sensors.
The numerical optimization method has been used for model parameter identification by other researchers. 8 , 9 Compared with previous studies, the goals of this study are to (1) determine the minimal number and layout of the sensors to perform damage detection; (2) provide a methodology to design the sensor layout at the beginning of structural health monitoring; and (3) illustrate the application of this method for damage detection on an actual large highway truss bridge.
Numerical optimization method for model parameter identification
This section presents a simple truss model parameter identification based on the numerical optimization method. First, establish an objective function using the stiffness method. The objective function is the difference between the measured and analytical parameters. Second, minimize the objective function and identify the model parameters.
Two-member truss example
Consider a two-dimensional two-member truss (Figure 1). The objective is to present a method for modeling parametric identification using static strains. An example load of 2 kips was applied at location 2 in the downward direction. Initially, an x, y global coordinate system is established for the problem. Each member is defined by an arbitrary local coordinate system (an x-direction establishes the direction of the system forces for each member). Each joint will have 2 DOFs (X, Y) in the global coordinates. Using a numbering system for describing the appropriate DOFs, the global stiffness of the structure was assembled, and the joint displacements and member strains and stresses were solved.

Two-member truss with notation.
Structural stiffness matrix
The overall global structural stiffness matrix was assembled using the global stiffness matrices of each member. 19 This matrix has a dimension of 6 × 6, that is, there are 6 designated DOFs for the truss. E is the elastic modulus. A1 is the cross section of member 1. A2 is the cross section of member 2. Then, we can obtain the expression as follows

Displacement and loads
From the problem, the displacement vector, D, and the vector of external loads force, Q, can be expressed as follows
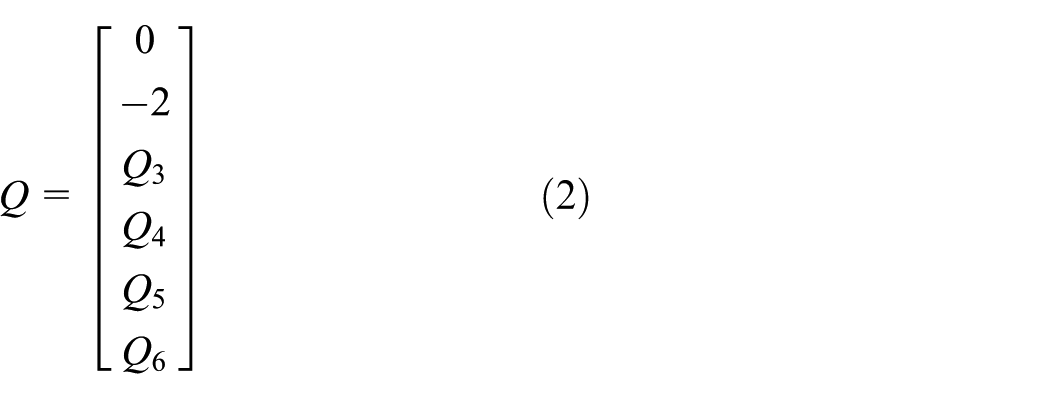

where Q3–Q6 are the unknown reactions; D1 and D2 are the unknown displacements. Because Q = KD, for the truss, we can obtain

From this equation, we can now express displacements D1 and D2 in terms of A1 and A2. The internal member forces are calculated from the global joint displacements based on the internal force equation. This equation establishes the link between the internal member force q with the cross-sectional area A and the global joint displacement D. The internal force q can be given as follows

In equation (5), DNx, DNy, DFx, and DFy are the global joint displacements, and the subscripts N and F stand for the “near” and “far” ends of the member, and this has been down using an arrow written along the member, with the head of the arrow directed toward the far end, and the subscripts x and y are in the global coordinate system (Figure 1).


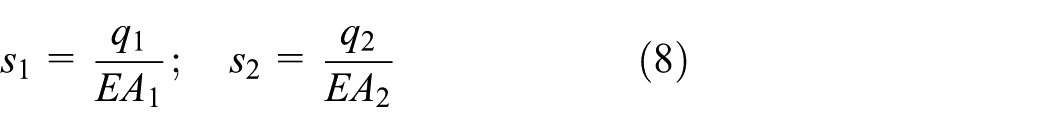
where q1 and q2 are the internal forces of members 1 and 2, respectively. Based on the strain–internal force relationship, we can obtain the analytical strains s1 and s2 as follows
Finally, to consider reducing the error between the measured and analytical strains, we can set the objective function as follows

where f is the difference between the measured strains (T1, T2) and the analytical strains (s1, s2). The measured strains are known values, whereas the analytical strains are unknown values, which contain variables A1 and A2. The analytical strains are equal to the measured strains only if A1 and A2 have the right value of the “as-is” cross-sectional areas. In this condition, minimizing f can determine the “as-is” cross-sectional areas. Then, numerical optimization is used to solve this equation.
Model updating using numerical optimization
Let us assume the two-member truss’s “as-built” condition has cross-sectional areas of A1 = 1 in2 and A2 = 1 in2. Because of corrosion, the “as-is” cross-sectional areas are unknown. The static strain model parameter identification is based on the applied forces and measured strains to determine the change in the structural member’s cross-sectional area. The measured strain at member 1 is −625/(333 × E) and at member 2 is 25/(7 × E).
The initial estimate is A1 = 1 in2 and A2 = 1 in2. A numerical optimization is used to determine the “as-is” cross-sectional areas of A1 and A2 by minimizing the function of f. A backtracking line search is used to find the step length. Furthermore, both Newton’s and the steepest descent method are used to find the directions.
Backtracking line search
The backtracking line search algorithm selects a step length appropriately. In this procedure, the initial step length is selected to be 1. An acceptable step length can be found after a finite number of trials. The backtracking approach ensures that either the selected step length is a certain fixed value or short enough to satisfy the sufficient decreasing condition; however, it cannot be too short or too large. 11
Newton’s method
pk is the search direction used to ensure the optimization function converges. Newton’s iteration can be given as follows 11

Table 1 provides the detailed calculation results of each step. Figure 2 plots A1 and A2 as functions of the iteration. The horizontal axis denotes the iteration steps, whereas the vertical axis denotes the values of A1 and A2.
Newton’s method with the backtracking line search.


Function of the iteration for Newton’s method.
Steepest descent method
The steepest descent method is another approach used for determining the search direction. The search direction pk at every step can be given as follows 11

The step length can be selected in a variety of ways. However, it is excruciatingly slow in this problem. It takes 154,890 steps to reach the objective value of 3.9723 × 10⁻¹³.
Figure 3 illustrates the plots of A1 and A2, which are the cross-sectional areas of members 1 and 2, respectively, as a function of the iteration. The horizontal axis denotes the iteration steps, whereas the vertical axis denotes the values of A1 and A2. The blue line represents the cross section of A1, whereas the green line represents the cross section of A2.
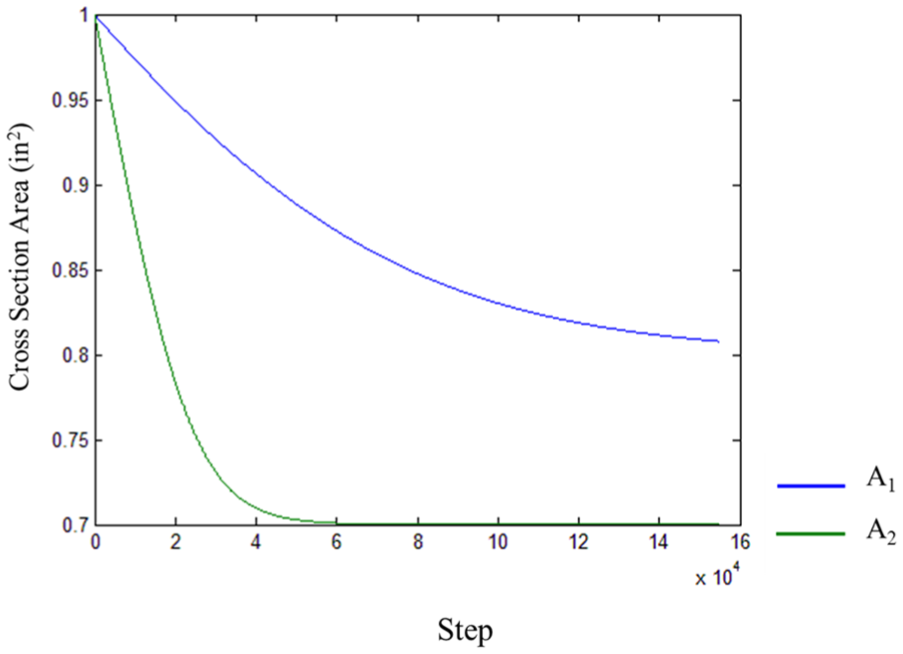
Function of the iteration for the steepest decent method.
Optimal sensor placement based on numerical optimization
The previous example used a strain sensor on each truss member. In actual applications, the sensor placement should be divided into three aspects. 20 First, what is the least number of sensors required to be installed in a structure for successful load testing? Second, where should the sensors be installed? Finally, the effectiveness of the different sensor placement methods should be evaluated. This study presents the process of sensor placement optimization and answers these questions.
The same objective function f is used for determining the optimal sensor number and locations. The objective function is the difference between the measured and analytical strains. This is problematic because the measured values of strain are required, which may not be available before installing the sensors and measuring the strain values. Typically, the optimal sensor location should be known before performing the instrumentation. Therefore, to solve this problem, an optimal sensor placement is tested for the known damages. The optimal sensor layout can detect actual damage only if it has the capability of detecting a given damage in the calculation.
First, calculate the “measurement strains” using the given damaged areas. Second, establish the objective function based on the sensor layout. Third, set the initial estimate of the damaged areas using the “as-built” condition. Finally, determine the given damaged areas using Newton’s method. In conclusion, the sensor layout is sensitive enough to detect damage in an actual application only if it can find the given damages by calculation. The sensor placements should start with the least number of sensors and include each potential location in each member. Furthermore, the number and location of sensors should be added until the objection function converges.
Eight-member truss
The cross-sectional area of “as-built” condition for an eight-member truss section is 10 in2. The structural layout is depicted in Figure 4. Let us consider that existing damage is located in members 1 and 5, which can be quantified based on the numerical optimization method. To test the sensitivity of damage detection, the “measured strain” is calculated using the given damaged areas. This study is used to determine the minimal number and optimal strain sensor layout that can be successfully used to conduct accurate model updating.

Eight-member truss with notation.
Sensor number and layout optimization
The sensor placement issue is important in cases where the properties of a structure, described in terms of a continuous function, need to be identified using discrete sensor information. Thus, sensor placement optimization is a type of combinatorial optimization problem that can be generalized as “given a set of n locations, find m locations, where m < n, which may provide the best possible performance.” The number of all distinct sensor configurations involving m sensors can be given by the expression 12 as follows

Thus, we can first start with
Sensor layout with numerical optimization.

Sensor number influence on the speed of numerical optimization
The sensor placement optimization can determine the minimal sensor number and the optimized layout. Figures 5 and 6 illustrate the eight-member model parameter identification using Newton’s method in two (Figure 5) and eight (Figure 6) sensor conditions. The two-sensor layout objective function is f = (T1 − s1)2 +(T5 − s5)2, and the eight-sensor layout objective function is
Two-sensor model parameter identification: (a) two-sensor layout and (b) function of the iteration.

Eight-sensor model parameter identification: (a) eight-sensor layout and (b) function of the iteration.
Based on the results illustrated in Figures 5 and 6, the study proves that increasing the number of sensors will not enhance the speed of the model parameter identification. Both the two-sensor layout and the eight-sensor layout require six steps to identify the “as-is” cross section at locations 1 and 5. The sensor’s number should be optimized at the beginning of the structural health monitoring project. Redundant sensors only increase the cost of project. Hence, there are optimal number of sensors and layouts for certain problems.
Numerical optimization for damage detection
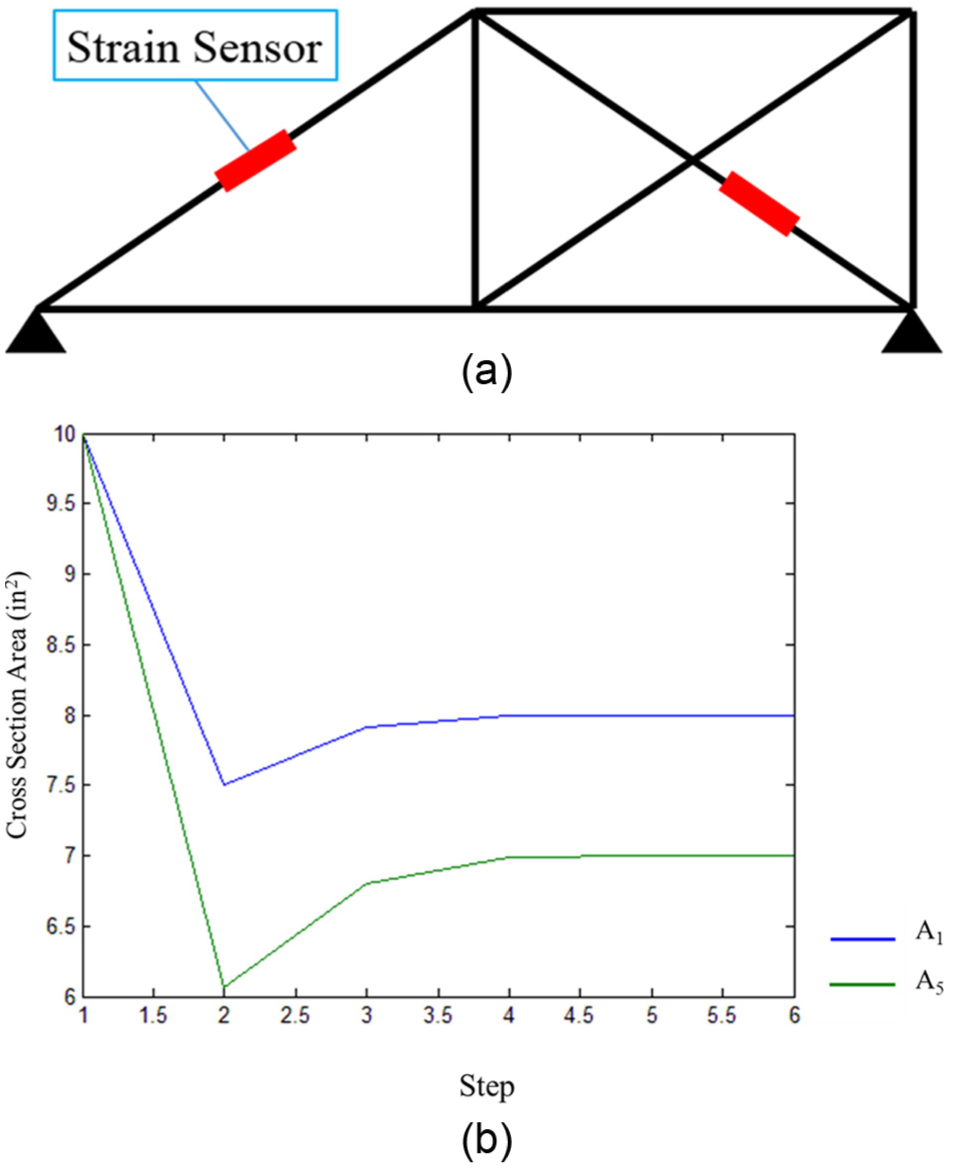
Furthermore, the numerical optimization method can be applied for damage detection. It can distinguish damaged sections from non-damaged sections. Figure 7 illustrates a truss structure with 13 members, and the “as-built” cross-sectional area i is 10 in2. Let us consider that damages exist in members 1–5. Strain sensors are placed on these locations. The “as-is” cross-sectional area of members 1, 2, 3, 4, and 5 is unknown and can be given as A1, A2, A3, A4, and A5, respectively.

Truss structure sensor layout.
The analytical strains at these five locations can be expressed using the stiffness method as s1, s2, s3, s4, and s5. The objective function is

Function of the iteration for damage detection.
Numerical optimization model updating for a large-scale structure
The numerical optimization of large-scale structures is challenging due to several difficulties. For example, the stiffness matrix will become larger with increasing DOFs, thus resulting in a longer time to calculate the displacement. Second, the objective function will be complicated, and it will be hard for the numerical optimization function to converge.
To solve this type of problem, this study first used displacement sensors to separate the structure into segments and performed damage detection based on each segment. The size of the stiffness matrix is controlled by the boundary condition. Normally, the bridge boundary conditions are controlled by abutments and piers. To reduce the size of the bridge stiffness matrix, installation displacement sensors can set additional boundary conditions for the bridge, which separates the bridge into small segments. Damage detection can be studied based on one segment. Using this method, the large-scale damage detection problem can be reduced into a simple problem.
Klehini River Bridge
The Klehini River Bridge is located at Porcupine crossing road accessed at milepost 26.3 of the Haines Highway. The bridge structure consists of a two-span riveted steel parker truss (Figure 9). The length of this bridge is 74 m (243 ft). The superstructure consists of various box sections with inverted channel sections riveted to two steel plates. A timber deck is supported by a series of timber girders connected to transverse I-beams. Both spans rest on a central concrete abutment and side banks.

Klehini River Bridge.
The Alaska Department of Transportation & Public Facilities (ADOT&PF)21,22 inspections reported the current damage in several structural members, including torn gusset plates, cracking at rivet holes, damaged or missing lateral bracing, and damaged sway bracing. An example of one damaged member (Figure 10) and its location is shown in Figure 11. The location of damage can be identified based on field inspection, and the new method can qualify the area of damage successfully.

Crack on truss member L0-L1.

Location of the damaged member.
Model parameter identification for the Klehini River Bridge
The Klehini River Bridge has a large number of trusses and DOFs; therefore, it is impractical to build a stiffness matrix for the entire bridge to conduct damage detection because of convergence and calculation time issues.
To identify the “as-is” cross-sectional area of the L0-L1 damaged section, this study used displacement sensors located at U2 and L2 to separate the structure into a smaller section (Figure 12), thus reducing the large-scale problem into a simple problem.

Separated structure using displacement sensors.
There are six members in the separated structure (Figure 13): member 1 (L0-U1), member 2 (L0-L1), member 3 (L1-U1), member 4 (U1-U2), member 5 (U1-L2), and member 6 (L1-L2), whose “as-built” cross-sectional areas are 12, 8, 7, 12, 6, and 8 in2, respectively. The damage existed in member L0-L1; thus, a strain sensor was located on the problem member.

Separated structure.
The applied Q1 is 1000 kips, and Q2 is 1000 kips. The displacements at D5, D6, D7, and D8 are 1.3962, −2.3543, 1.3402, and −2.0268 in, respectively. The “as-is” cross section at member 2 is unknown, which is A2. The displacements D1, D2, D3, and D4 can be determined using the stiffness method. The relationship between the separated structural stiffness and applied loads and displacements can be expressed using stiffness method 19 as follows
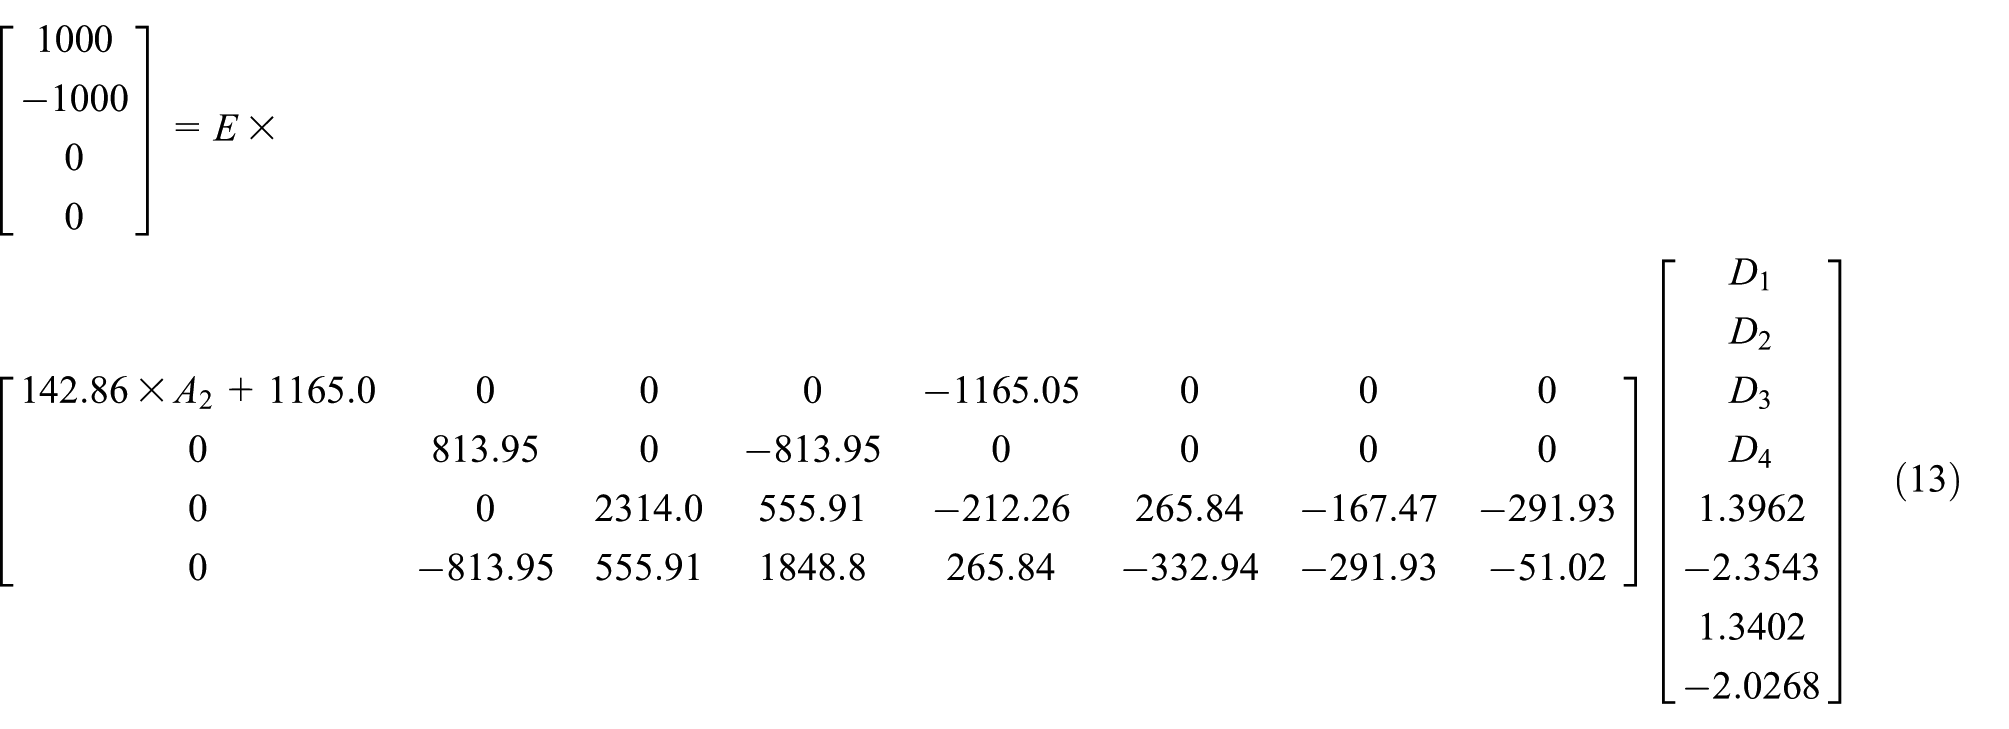
The analytical strain at member 2 (s2) is determined using the calculated D1–D4 values. The measured strain at member 2 is calculated based on the known global truss bridge stiffness and determined to be 0.0062. The objective function is f = (T2 − s2)2. The extreme minimal result of function f was calculated using Newton’s method. The original estimate of the cross section of member 2 is 8 in2. The “as-is”A2 was 6 in2 after six steps of calculation (Figure 14).

Member 2 cross-sectional area identification using Newton’s method.
This study performs damage detection based on one separated structure. The location of damage can be identified based on field inspections; however, the severity of the damage cannot be quantified. The new method identified the area of damage successfully. The remaining damages exist in other segments, and they can be quantified using the same method, which consists of using displacement sensors to separate the bridge into segments and performing damage detection based on each separated section. For example, in Figure 12, imaginary displacement sensors are placed at locations U2′ and L2′, which can separate the structure into another two segments (sub-structuring). The first segment’s boundary conditions are the displacement measurements at U2, L2, U2′, and L2′. Furthermore, the second segment’s boundary conditions are the abutment support at L0′ and the displacement measurements at U2′ and L2′.
Conclusion
In this study, both simple structures and the Klehini River Bridge were successfully updated using the optimal static measurement method. The established objective function is the difference between the measured and analytical strain results, which can be used to detect the change in the structural cross-sectional areas.
An optimal number of sensors and their layout exist for a certain model parameter identification problem. The four examples illustrate that the number of measurements must be greater than or equal to the number of unknown parameters as a necessary condition for a solution to exist, which has been proven by previous researchers using a different method. 8 Including the redundant strain measurements in the objective function cannot enhance the speed of optimization. The strain sensor placement should be evaluated prior to selecting a structural health monitoring system. This is needed to reduce equipment costs, reduce installation (labor) costs, and provide a more logical method for evaluating the experimental response.
Static measurements may be used to perform model parameter identification, detect damage, and locate the position of problem. The numerical optimization calculation time becomes extremely long as the number of DOFs increases, and the number of members to be identified is required. Therefore, displacement sensors can be used to reduce a separate large-scale structure into a simple problem. Hence, the large-scale problem has been successfully transferred to a simple problem.
The numerical optimization is a great tool for structural health monitoring. In practical engineering, load tests are always performed to evaluate structural safety conditions, and various types of sensors are installed on structures to evaluate whether the measured parameters are in the safety range. However, only a limited number of members are checked, and the safety conditions for the other members are calculated using the structural mathematical model. Checking the static measurement parameter identification and optimizing the sensor layout in the beginning stages can be used to evaluate the structural health monitoring system capability of the bridge. Using optimal static measurements, this approach can be used to identify the bridge “as-is” condition and help evaluate the structural safety.
This study applies the optimal strain measurement method to simple trusses and an existing highway truss bridge. The sectional area is the primary parameter affecting the strain. Other parameters may exist, including change in joint characteristics, support condition for girder bridges, and concrete cracking. A few of these more difficult conditions will be studied in the next phase of the research.
Footnotes
Academic Editor: Daniele Zonta
Declaration of conflicting interests
The author(s) declared no potential conflicts of interest with respect to the research, authorship, and/or publication of this article.
Funding
The author(s) received no financial support for the research, authorship, and/or publication of this article.