
Abstract
Maintaining adequate dry weight and fluid volume balance is an important issue for dialysis patients. Malnutrition and sodium intake are the primary factors that cause fluid volume imbalance and changes in body weights. Inadequate dry weight control results in higher levels of blood pressures and is related to various complications, such as volume overload, hypertension, congestive symptoms, and cardiovascular diseases. Moreover, inadequate fluid removal provokes hypotension during dialysis treatment. Thus, we propose an early warning tool based on fuzzy color reason analysis in predialysis healthcare for hypervolemia screening. The anthropometric method is a rapid, non-invasive, and simple technique for estimating the total body water. In this study, Watson standard formula is employed to estimate cross-sectional standard of total body water with the patient characteristics, including gender, age, height, and weight. In contrast to the experienced anthropometric formulas, Watson formula has less than 2% of margin errors and provides a criterion as a reference manner to estimate the total body water in patient’s normal dry weight. In addition, inadequate dry weight and total body water controls will lead to higher blood pressures. The systolic blood pressure is also an indicator to evaluate pre-hypertension of 120–139 mmHg and hypertension of greater than or equal to 140 mmHg. Therefore, the levels of two indicators, total body water and systolic blood pressure, are parameterized with fuzzy membership grades to describe the normal and the specific ranges of undervolemia and hypervolemia. A color reason analysis utilizes a hue–saturation–value color model to design a color perceptual manner for separating normal condition from hypervolemia or undervolemia. Normalized hue angle and saturation value provide a promising visual representation with color codes to realize the patients’ diagnosis. Dialysis patients with hypertension demonstrated that the proposed model can be used in clinical applications. In addition, a healthcare chair is carried out to measure blood pressure and weight in predialysis. The proposed assistant tool integrates an electronic pressure monitor and an electronic weight monitor, and fuzzy color reason analysis is also intended to be established in an intelligent vehicle via a WiFi wireless local area network for cloud computing.
Keywords
Introduction
The state of body water is an important factor in routine hemodialysis (HD) treatment and postdialysis healthcare. The so-called hypervolemia/fluid overload is a medical condition manifested as excess body water in the blood, leading to increase in body sodium content and a consequent increase in extracellular body water. In dialysis patients, this condition causes certain complications, such as hypertension,1–3 increase in body weight (BW), and peripheral edema in the legs and arms. Sodium plays an important role in regulating the total amount of water in the human body. Extremely high levels of sodium cause congestive heart failure and cardiovascular system instability during dialysis treatment. Inadequate dry weight results in a higher level of blood pressures, while prolonged symptoms lead to restructuring of the heart function and induction of heart failure and arrhythmias.4,5 Therefore, maintaining dry weight, adequate water volume control, blood pressure control, and reducing sodium concentration is important in postdialysis healthcare for dialysis patients. This study proposes a strategy to prevent hypervolemia and maintain envolemia/dry weight.
In clinical examinations, hypertension for adult HD patients is defined as 1-week predialysis systolic blood pressure (SBP) of greater than 150 mmHg and diastolic blood pressure of greater than 85 mmHg and requires antihypertensive drugs for blood pressure control.6,7 The echocardiographic technique has been used to observe the congestive symptoms of dilatation of various compartments in the left atria (LA) and hypertrophy of left ventricle (LV).3,8,9 Color Doppler echocardiography with B-/M-mode operations can reveal the LA/LV systolic and diastolic functions, including mitral valve injection velocity and pulmonary venous flow, left/right ventricle tissue, LV mass, and LA volume.9,10 Certain parameters are measured to identify the heart function, such as LA diameter, LV end-diastolic and end-systolic diameters, posterior wall thickness, and interventricular septum. Although this technique is a promising solution in routine examinations, it is difficult to perform in the healthcare or home environment of HD patients.
In addition, portable measurement techniques, such as relative plasma volume monitors3,11 and bioimpedance spectroscopy,1,9 have been used to assess the response to hypervolemia and to further maintain the dry weight. Relative plasma volume monitoring is a photo-optical method to non-invasively measure absolute hematocrit in the arterial end of the dialyzer, while the percentage of blood volume change (plasma refill rate vs removal fluid) during dialysis is being computed. High refill rate and a flat slope indicate hypervolemia, whereas a lower plasma refill rate and a steeper slope indicate lower LV mass, better ventricular function, and intradialytic hypotension. Hence, less antihypertensive drug requirements can be achieved. Multifrequency bioimpedance spectroscopy 12 is also a non-invasive technique using a pair of electrodes placed on the wrist and ankle. The slopes of normovolemia and hypervolemia characterize the variation in extracellular water (ECW) with BWs. However, ECW and BW measurements need to be acquired at the beginning of each treatment, which are used to determine the slopes of normovolemia. The aforementioned clinical examinations are simple methods but lack the sensitivity and specificity to identify hypervolemia.
The anthropometric method is also a simple technique to determine the total body water (TBW). It can be easily implemented using a mathematical model with dialysis indices, such as height (H, cm), weight (W, kg), body mass index (BMI), age (A, years), sex (S, male/female), and diabetes (D). Experienced formulas2,12–15 can be obtained for estimating TBW using big data (experimental data) processes, such as the Watson formula, Hume formula, Sahlgrenska formula, and Chumlea formula. Among these formulas, the Watson formula has been widely used to estimate TBW in dialysis patients. It is routinely used to estimate the TBW for evaluating body composition in different populations, including gender, ages, heights, and weights. Its mathematical model with a linear regression coefficient for weights systematically estimates the body water, while providing narrow margins of substantial error (approximate average or close-to-average weights) and a promising reference method. Watson formula has less than 2% of margin errors 13 to estimate the TBW in patient’s normal dry weight, as normality TBW is a reference for sustained examinations. Therefore, the ratio of estimated TBW and normality TBW provides a criterion to identify the changes in fluid volume balance. In addition, blood pressure measurement is an important factor for all aspects of cardiovascular diseases and diabetes in dialysis patients. Predialysis and postdialysis blood pressure should be “less than 140 or 90 mmHg” and “less than 130 or 80 mmHg,” respectively. Among patients undergoing HD treatment, SBP variability is a strong predictor than diastolic blood pressure of age, cardiovascular diseases, and diabetes. Hypertension is also dependent on BW and fluid volume imbalance. Acute weight gain and weight loss result in elevated blood pressure and orthostatic hypotension, respectively.
In this study, two key indicators, TBW and SBP, are parameterized using fuzzy membership functions (MFs) to describe the specific ranges with membership grades. Based on the anthropometric method, the Watson formulas for male/female are used to estimate the TBW with the patient characteristics, ages, heights, and weights. The definition of TBW ratio is used to indicate the TBW changes in the patient’s average normality level, with ratios greater than 1 or less than 1 representing the fluid volume imbalance. Indicator SBP is employed to screening the levels of blood pressure conditions, while the range of 120–139 mmHg for pre-hypertension and greater than or equal to 140 mmHg or higher for hypertension in adult patients. Then, fuzzy color reason analysis (CRA) is employed to automatically separate the normal condition from prehypervolemia/hypervolemia and undervolemia. The proposed screening model is designed as a classifier to deal with fuzzy inference problems and multi-criteria decision-making with hue–saturation–value (HSV) color model.16–19 Fuzzification operations can map TBW and SBP indications into the specific membership grades using Gaussian and sigmoidal MFs. CRA is employed to map membership grades into rule-weighted outputs for decision-making. A fuzzy CRA utilizes hue angle and saturation value to identify the three levels with describing perceptual color relationships for normal, prehypervolemia, and hypervolemia screening. In contrast to the other artificial intelligent models, such as artificial neural networks, these methods can also be designed as a decision-making manner for classification applications. 18 Optimization methods, such as least-square algorithm, gradient descent algorithm, and swarm-intelligence algorithm, need to adjust the model parameters to enhance the estimation accuracy. Large number of training data also affects the training process and classification efficiency. However, determination of the multi-layer network’s structure, large number of experimental data, and the update of parameters with iterative computations are three concerns that limit the mechanism’s inclusion in a portable embedded system. The proposed fuzzy CRA application software can be easily implemented in a tablet PC or in smart mobile devices and be integrated with the electronic pressure and weight monitors in a healthcare chair. Sensing units with a WiFi wireless local area network (WLAN) mode (IEEE 802.11 Standards) can transmit physiological parameters to a mobile device.20–25 Hence, smart mobile devices can receive the reliability and personalized physiological indications in indoor environment or HD room.
Methodology
Anthropometric formulas: TBW estimation
TBW estimation is important information in an individual dialysis patient for evaluating the degree of fatness. In clinical measurements, a healthcare chair-based body weightometer and a blood pressure monitor are used to take physiological measurements. The weight is relative to one’s height and is therefore used to determine the BMI, TBW in predialysis stage, and interdialytic weight gain in postdialysis stage. Blood pressure is an important factor that might affect physiological functions, and maintaining a higher SBP of less than 150 mmHg to control hypertension and predialysis blood pressure range of 140–90 mmHg have been suggested for adults. The objective of this study was to rapidly estimate the accuracy of TBW in predialysis stage. A chair or a wheelchair equipped with various commercial sensors20–22 and wireless communication23–25 has been integrated into a reliable sensing system in clinical applications, remote physiological signal monitoring, and home healthcare. Hence, critical signals, such as electrocardiography signal, photoplethysmogram signal, and blood pressure, can provide health information in health management or evaluation of treatment efficacy. In this study, we intended to design an intelligent healthcare chair to take personalized physiological measurements in predialysis, including BW and blood pressure monitors, as seen in Figure 1. The sensing unit with a WiFi WLAN mode (IEEE 802.11 Standards 25 ) could transmit the data to a mobile device in the indoor range of less than 30 m. The received signal strength indicators were about greater than −70 dBm, 20 which envisaged deployment conditions in the indoor environment (HD room: 20 m × 30 m). Hence, the electronic sensing units in its communication applications provide the reliable short wireless transmission distance.

An intelligent healthcare chair for physiological measurements in predialysis healthcare.
Given the patients’ characteristics: S (male = 1/female = 0), A (years), H (cm), and W (kg), the two formats of Watson formula in adult subjects were used to calculate TBW:2,12
TBW in males (S = 1)

TBW in females (S = 0)

The other anthropometric formulas for estimating TBW are shown in Remark.12,15
Remark
Experienced anthropometric formulas
Hume formulas
TBW in males (S = 1)

TBW in females (S = 0)

Sahlgrenska formulas
TBW in males (S = 1)

TBW in females (S = 0)

These criteria provided a reliable standard as a reference manner to estimate the body fluid composition in normal dry weight, as shown by the TBW (L) versus BW (kg) in Figure 2. It appeared that TBW had a positive correlation with male gender, weight, and furosemide use and a negative correlation with age. BMI was also negatively correlated with age, while it was positively correlated with furosemide use. 12 TBW had an independent positive association with height and weight for female gender. In addition, patients having higher BW were more likely associated with ambulatory blood pressure on a daily basis (24 h). Hypertension is dependent on fluid volume imbalance. For adult patients, SBPs gave the screening level for evaluating pre-hypertension or hypertension, while the range was 120–139 mmHg and the highest value was greater than or equal to 140 mmHg or higher, respectively. Hence, both TBW and SBPs could be indicators to evaluate the body fluid composition dependent on hypertension or higher blood pressures.

Total body water (L) versus body weight (Kg) for males/females using Watson formula.
Fuzzy CRA
According to Figure 3(a) and (b), two indicators, TBW and SBP, were parameterized with Gaussian, Z sigmoidal, and S sigmoidal MFs, varying between values 0 and 1, as shown in Figure 3. The ratio, TBW/TBWnor, was used to indicate the changes in fluid volume balance. The parameter, TBWnor, is estimated by Watson formula, which is a reference for sustained examinations in normal dry weight. The nephrologists prescribe the normal dry weight for each patient with no extra fluid and a normal blood pressure. Hence, the TBW ratio, TBWrat, was parameterized in the specific ranges, including undervolemia, µ1, normal, µ2, and hypervolemia, µ3, as follows

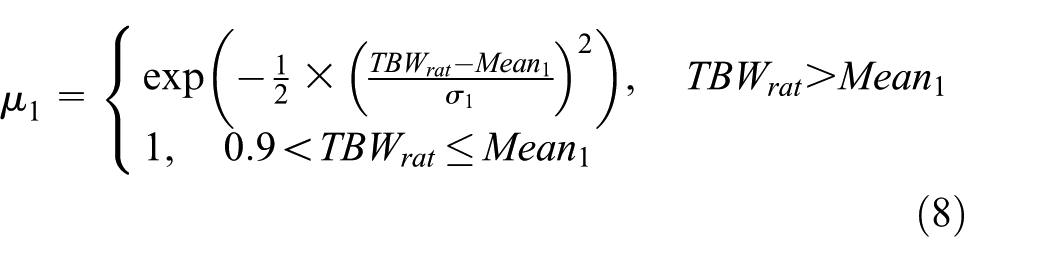


where standard deviations,

Membership functions: (a) MFs for parameterizing TBW ratios, (b) MFs for parameterizing blood pressures, and (c) gray grades versus membership grades.
As shown in Figure 3(b), the blood pressures weighted between 0 and 1 as MFs for representing the normal and hypertension ranges as follows


The membership grades of TBW are weighted by µ4 and µ5 as follows

Then, the weighted values are converted to gray grade, ρi, i = 1, 2, 3, by nonlinear transformation, as described earlier18,24

where parameter, ξ, is the recognition coefficient to adjust gray-grade intensity with interval (0, ∞), which is used to enhance contrast (ξ = 5.0 in this study). The gray-grade transformation is a Gaussian function, as shown in Figure 3(c). Intensity adjustment is used to enhance contrast and provides better contrast to separate testing data in two classes. The minimum and maximum gray grades can be determined as follows
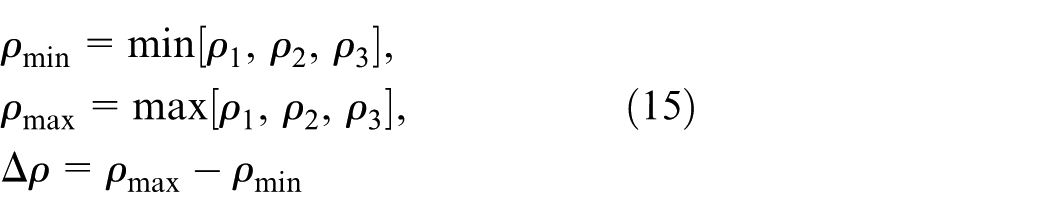
where ρmin ≠ ρmax and ρmax ≠ 0. The primary color grades and parameter, Δρ, have capability of self-regulation by the membership grades. According to the HSV color model, 19 the CRA-based classifier18,19 is defined mathematically by transformations between the RGB color space and the HSV color space. Gray grades are converted to three primary color grades, r (red), g (green), and b (blue) as follows

where r, g, and b∈ [0, ξ] are the r, g, and b coordinates in the RGB color space, respectively. Primary color grades are employed to separate the normal condition from hypervolemia or undervolemia, as seen in Figure 4. For an HSV color space, the hue angle, Hue ∈[0°, 360°], is described by numerous specific coordinates of the corresponding color around the wheel and is determined as follows


HSV color space and RGB color transformation.
Index, Hj (Hj = 1, 2, and 3), that refers to the three primary colors is used to identify the TBW condition, while the green series color (60°–180°) is used for undervolemia, blue series color (180°–270°) for normal condition, red series color (270°–300°) for prehypervolemia, and (0°–60° or 300°–360°) is used for hypervolemia, as shown in Figure 4. In addition, the saturation, S, and value, V, are described as pure color saturation and lightness, respectively, which are defined as follows 19

The value of index, H, is generally normalized to lie between 0° and 360°, while “ρmin = ρmax” and “S = 0” have no geometric meaning. These can help the nurses or HD patients to easily visualize the screening results. For hypervolemia screening, index H is conducted to identify the three levels as angle points in Figure 4. Subsequently, index, S, of 0.5–1.0 provides high confidence for confirming the possible level.
Implementation of proposed screening model
The proposed fuzzy CRA-based screening model is shown in Figure 5(a), consisting of fuzzification via gray-grade transformation, maximum–minmum operation, and transformation from RGB color space to HSV space. The value of hue angle, Hj, was normalized and was utilized to identify the four levels as index HC

where the critical thresholds, HC = [60°, 180°, 270°, 300°, 360°]/360° = [1/6, 1/2, 3/4, 5/6, 1], were used to separate the “normal condition” from “hypervolemia” and “undervolemia.” The concept of the fuzzy CRA reason was derived from the fuzzification operations and HSV color model to describe perceptual color relationships for hypervolemia screening. Fuzzification operations can map mathematical input variables into specific gray grades using Gaussian, Z sigmoidal, and S sigmoidal MFs. The MF parameters were static or could be changed dynamically based on different HD patients. Subsequently, HSV color model is employed to map gray grades into perceptual colors for decision-making. The saturation value, S, varied from 0.0 (unsaturated) to 1.0 (fully saturated) to enhance the decision confidences as inequality, S ≥ 0.50. In addition, index, HC, was used to identify the possible level and the choice of recognition coefficient, ξ >> 1; 26 gray grades could be weighted to distinctly separate into different levels, and the decision-making might increasingly become distinguishing for classification of space to enhance the screening accuracy.

The proposed fuzzy CRA screening model: (a) structure of fuzzy CRA based and (b) implementation of screening model in an embedded system.
The proposed screening model could be implemented in an embedded system, as shown in Figure 5(b). Its model uses straightforward mathematical computations to achieve the inference procedures for real-time applications. As seen in Figure 5(b), an embedded system (National InstrumentsTM myRIO-1900, Austin, TX, USA) can be applied to establish a prototype screening algorithm within a short design cycle. We also integrated electronic body weightometer and blood pressure monitor for weight and blood pressure measurements using a healthcare vehicle/chair. The vehicle was equipped with commercial sensors and was designed to carry out wireless communication for unconstrained physiological monitoring. A WiFi (IEEE 802.11 Standard 25 ) WLAN was used for linking mobile devices (smart phones, personal digital assistant, or iPad) and portable computers provide support (laptop), while being operated on a 2.4-GHz industrial, science, and medical frequency bands. It was designed for portable devices with low power consumption and short-range communications in common household and mobile appliances.
The screening model in an embedded system has predialysis healthcare functions, including (1) connectivity measurements from the weight and blood pressure sensing units, (2) built-in WiFi communication to acquire physiological data for remote monitors, (3) easy implementation of fuzzy CRA-based decision-making algorithm in a microprocessor (dual-core ARM Cortex), and (4) remote data acquisition via wired or wireless communication and transmitting data to a tablet PC or a mobile vehicle. The proposed framework can be easily implemented in a portable medical device using LabVIEW graphical programming software (NITM, Austin, TX, USA) and the embedded design device in real-time applications. The proposed prototype model was designed in a graphical programming user interface and conducted in a development platform, as shown in Figure 6. In addition, the remote monitor’s function can be used in telecare applications in public HD room and home-based HD for hypervolemia screening.

The graphical programming user interface.
Experimental results
The proposed hypervolemia screening model has been developed in an embedded system and a WiFi wireless connection. The vehicle has integrated commercial sensors to measure SBP and BW. The fuzzy CRA-based algorithm was conducted in LabVIEW at the PC level. Data transmission units are both wired and wireless communications. The measurement data and information can be obtained and transmitted using remote data acquisition unit with WiFi WLAN that communicates with a tablet PC. For an indoor wireless communication, its framework also created a data dashboard to remotely monitor and to represent HD patients’ personal parameters, including age, male/female, BW, height, and SBP, and screening results. The performance of the proposed methods was tested for screening accuracies on the data set, including normal condition, undervolemia, and hypervolemia groups, with age ranging from 37 to 67 years for the study as detailed below.
Preliminary screening assessment
For a male, A = 50 years, W = 52 kg, H = 160 cm, and BMI = 20.31 kg/m2, current W and SBP were required for measurement in predialysis stage. Hence, the vehicle provided a personalized access to measure health information and compare with subject’s control data. The proposed model used straightforward mathematical operations to assess the numerical computations, while it required less parameter assignment, such as mean values and standard deviations for MFs and recognition coefficient, ξ = 5. The mean values were averaged from personal baseline data, such as changes in weight, ± 2.4 kg, and changes in predialysis-seated SBP, and ± 16 mmHg in hypertensive HD patients. 11 The proposed model has capability of self-regulation of primary color grades, which showed good adaptability for separating normal condition from abnormal condition. The Watson formula was employed to evaluate the TBW.
By increasing the BWs and blood pressures, the hue angle, H, gradually increased from 180°, 270°, 300°, to 360°, while normalized hue angle, HC, increased from 1/2, 3/4, 5/6, to 1, as seen in Figure 7(a). It can be seen that both higher BWs and blood pressures were sensitive to the screening results. The CRA has a flexibility visual manner with color codes, Hj ± 60, j = 1, 2, 3, to realize the patients’ diagnosis. The saturation value, S ≥ 0.5, provided the confidence for confirming the possible level. While index, S, decreased to less than 0.50, the noted critical point was used to decide the level of translation from normal condition to hypervolemia. Therefore, the changes in hue angle remained significant and dependent on gross changes in weights and blood pressures. These parameters could be indicators to evaluate the body fluid composition in prehypertensive and hypertensive HD patients. In addition, by decreasing the BWs and increasing the blood pressures, the hue angles approximated to 120° (normalized hue angle, HC = 1/3) as index, S ≥ 0.5. The undervolemia can also be identified, as seen in Figure 7(b). The proposed screening model has been validated and proved to be a promising method to evaluate the possible levels in clinical settings.
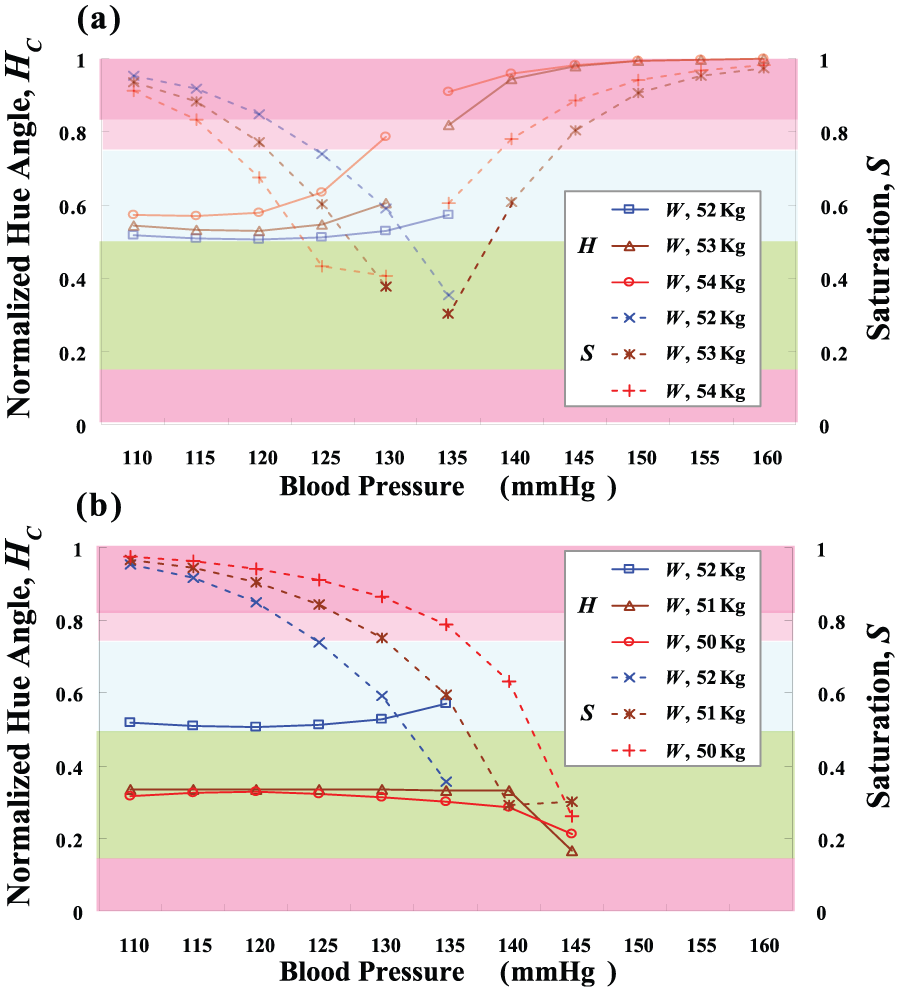
Preliminary testing results: (a) testing results for hypervolemia screening and (b) testing results for undervolemia screening.
Case study in hypertensive HD patients
The experimental data from hypertensive HD patients were used to verify the proposed screening model. Data of 12 participating subjects, aged 37–67 years, were shown in Tables 1 and 2. For these case studies, Watson, Hume, and Sahlgrenska formulas were used to calculate the normality TBWs and estimated TBWs. The normal dry weight was prescribed for each patient by the nephrologists. Then, the TBWrat was parameterized to rapidly indicate the changes in fluid volume balance, as TBWrat > 1, TBWrat ≈ 1, or TBWrat < 1. In fuzzification operations, the membership grades of TBWrat and SBP were converted to gray grades and three primary color grades using the gray-grade intensity adjustment. The CRA utilized HSV color model to map gray grades into color codes, green series color, blue series color, and red series color, for the estimation of patients’ diagnosis. For instance, Subject 7 (male, aged 54.9 years) had hypertension and diabetes, a case in which changes in dry weight of +2.0 kg could result in higher SBPs and fluid volume imbalance. Inadequate control of fluid volume or inability to maintain an appropriate dry weight for chronic HD patients was identified as a key factor to cause excess mortality. These problems could lead to chronic volume overload with hypertension and left ventricular hypertrophy, while subsequently causing cardiovascular symptoms and also increasing the patency rate of complications. In addition, some patients removed extra weights to achieve appropriate dry weight, resulting in uncomfortable symptoms. Therefore, it is important to screen early in predialysis stage (three times a week) and then perform dialysis for volume control or administer antihypertensive drugs. The proposed screening model is detailed according to the following procedure:
Step 1. Given the baseline W, measured W, height, and SBP, TBW and TBWnor were calculated using equation (1), and then TBW = 43.6233 and TBWnor = 42.9509 can be obtained, as seen in Table 1;
Step 2. Calculate the TBW ratio, TBWrat = 1.0157, using equation (7), as seen in Table 2;
Step 3. Compute the membership grades, [µ1, µ2, µ3, µ4, µ5] = [0.7681, 0.9525, 0.8067, 0.1274, 1.0000] using equations (8)–(12);
Step 4. Convert the membership grades to gray grades using equations (13) and (14), then ρ = [ρ1, ρ2, ρ3] = [0.0854, 0.1053, 4.1482], ρ∈ [0, 5];
Step 5. Find the minimum and maximum grades, ρmin = 0.0854 and ρmax = 4.1482, ρmin ≠ ρmax;
Step 6. Convert the gray grades to primary color grades, g = 0.0839, b = 0.1043, and r = 4.2568;
Step 7. If ρmax = ρ3, then find the average hue angle, H3 = 359.7064°, and saturation, S = 0.9794, using equations (19) and (20);
Step 8. Normalize the hue angle using equation (21), then index HC = 0.9992 is employed to identify the level of hypervolemia and index S ≥ 0.5 denoting high confidence, as seen in Table 2.
Experimental results for TBW estimation.

TBW: total body water.
Symbols (1) and (4) mean Watson formulas; symbols (2) and (5) mean Hume formulas; symbols (3) and (6) mean Sahlgrenska formulas.
Experimental results for hypertensive HD patients.

HD: hemodialysis; TBW: total body water; CRA: color reason analysis.
Symbol (1) means Watson formula; symbol (2) means Hume formula; symbol (3) means Sahlgrenska formula.
Subject 7 satisfied with an index, HC = 0.9992 (359.7064°) for red series color, and S = 0.9794; thus, this case study can be agreed as a patient with increasing weight that led to “hypervolemia.” In addition, for Subject 9 (male, aged 66.1 years), the inference results indicated “normal condition,” satisfying with an index, HC = 0.5369 (193.2840°) for blue series color. However, the saturation index, S = 0.4485, was less than 0.5, due to the subject having slight decrease in weight and pre-hypertension. This observation led to a suggestion of maintaining the appropriate BMI and dry weight. In contrast to Subject 11 (male, aged 66.9 years), he had changes in weight of −1.7 kg, and the inference results indicated “undervolemia,” satisfying with an index, HC = 0.2950 (106.2000°) for green series color, and saturation index, S = 0.5303. For color code in imaging version, the screening results provided a promising suggestion to gradually control fluid volume and appropriate BMI for HD healthcares. This finding confirmed that the proposed screening model could detect fluid volume imbalance in its early stages in HD patients, six with hypervolemia, two with normal condition, and four with undervolemia. Experimental results for 12 HD subjects are shown in Tables 1 and 2.
Discussion
Cardiovascular disease is the most common cause of mortality in HD patients, and hypertension is also a significant factor for cardiovascular disease pathogenesis. Hypervolemia, hypematremia, and hyperkalemia are important risk factors for their morbidities and mortalities. In previous studies,3,4,5,27,28 the relationship between hypervolemia and malnutrition was regarded to be the key indicator of predisposition to hypertension in HD patients, further preventing the progression of cardiovascular event rate. During dialysis treatment, inadequate fluid removal and blood volume ultrafiltration control or fluid volume imbalance provoked hypotension, associated with clinical symptoms for nursing decreases SBP by greater than 20 mmHg or decreases mean arterial pressure by 10 mmHg. 29
Hence, anthropometric formulas, such as Watson, Hume, Sahlgrenska, and Lee formulas,12–15 provide well-known standard methods to estimate TBW. This method might cause large systematic errors, while TBW varied from the average, obese, and overhydrated patients. In particular, in obese patients, the estimated results led to large errors, in average or close-to-average weights, and the Watson, Hume, and Sahlgrenska formulas provided a promising reference with narrow margins of error. 2 For the prescribed normal dry weight, the estimated results with a total average error of less than 2% for 12 subjects using three formulas are shown in Table 1. The robustness range of normal condition was ±2% of changes in TBW and changes in SBP from 110 to 135 mmHg. That is, the Watson formula has been verified and can be applied to estimate TBW. This indicates that a rapidly safe and simple method can be used from a cross-sectional standard for bedside applications in predialysis stage. In this study, the objective was to establish an intelligent vehicle with a warning tool for predialysis healthcare. For physiologica measurements to screen hypervolemia, these findings can provide a promising suggestion to make changes in drink/food and to control extra BWs.
Conclusion
A strategy to monitor and control the fluid volume status and hypertension is an important clinical issue in HD patients. Dietary sodium restriction and fluid volume control have been performed to improve malnutrition. A promising method that can provide an accurate assessment to achieve and maintain a stable BMI and dry weight is needed. For the prescribed normal dry weight, Watson formulas for male and female subjects have been validated to estimate cross-sectional TBW with an average error of less than 1.2% to indicate the fluid volume imbalance. The proposed fuzzy CRA with the TBWrat and SBP is used to separate the normal condition from hypervolemia or undervolemia. The fuzzy CRA has a flexibility inference mechanism and no iterative computations to update model parameters. The recognition coefficient, ξ, monotonously increases to enhance better contrast in classification applications, while has capability of self-regulation in the primary color grades. Hence, this simple technique can be easily implemented in a tablet PC and an intelligent vehicle via wireless connection, which only requires few patient characteristics, such as S, A, W, and H parameters, as shown by the data in the dashboard in Figure 8. This individualized tool can enhance the priority in data read, cloud computing, and cloud storage for patient demands. In addition, antihypertensive medication is a directed manner to control blood pressure, further preventing the progression of congestive heart failure and improving cardiovascular outcomes. In routine examinations, TBW and blood pressure screenings can be used to evaluate individualized characteristics for drink, food, and pharmacologic controls. We may have a cross-sectional reference to objectively direct dry weight management. In addition, this promising model is an individualized tool for dry weight maintenance in predialysis healthcare.

Fuzzy CRA-based screening tool was implemented both in a tablet PC and an iPad via wired and wireless (WiFi, IEEE 802.11) communication.
Footnotes
Academic Editor: Shinsuke Hara
Declaration of conflicting interests
The author(s) declared no potential conflicts of interest with respect to the research, authorship, and/or publication of this article.
Funding
The author(s) disclosed receipt of the following financial support for the research, authorship, and/or publication of this article: This work was supported in part by the Ministry of Science and Technology, Taiwan, under contract nos MOST 105-2221-E-006-087-MY2 and MOST 105-2218-E-075B-001 during 1 March 2016–31 July 2017 and is also supported in part by the research grant of Kaohsiung Veterans General Hospital, under contract no. VGHKS 105-070 during 1 January 2016–31 December 2016.