
Abstract
Objective
This study aimed to examine whether sleep maintenance efficiency (SME) and total sleep time (TST), measured by wristband devices tracking both movement and heart rate patterns, are associated with systolic blood pressure (SBP) and diastolic blood pressure (DBP).
Methods
This cross-sectional study was conducted using data from 72 individuals who participated in a Japanese municipality's project for improving sleep quality. Fitbit-derived sleep data were linked with health checkup and claims data. Linear regression analyses were conducted with SBP or DBP as the dependent variable, and SME or TST as the independent variable. We constructed simple and multivariable models that adjusted for age, sex, body mass index, smoking, alcohol consumption, exercise habit, restful sleep, and antihypertensive medication use.
Results
SBP significantly decreased with higher SME in the simple model (B = −1.92 mmHg, p = 0.01) and the multivariable model (B = −1.87 mmHg, p = 0.02). When SME was analyzed as quartile groups in the multivariable model, the lowest group had a significantly higher SBP (B = 8.51 mmHg, p = 0.04) than the highest group. This negative association was also observed in sensitivity analyses with bootstrapping that focused on participants without antihypertensive medication use and participants with normotensive SBP. SME showed no association with DBP, and TST showed no association with SBP or DBP.
Conclusion
SME was associated with SBP, whereas TST showed no clear association. Sleep quality assessments using wearable devices may provide useful insights that support the prevention of blood pressure elevation and population health monitoring.
Keywords
Introduction
Hypertension is the main risk factor for cardiovascular disease.1–4 Approximately one-third of all adults aged 30–79 years worldwide have hypertension, and over 70% of these individuals do not adequately control their blood pressure (BP) levels. 5 Therefore, measures to improve the prevention and management of hypertension are needed to reduce the prevalence of cardiovascular disease.
Recent studies have reported that the duration and quality of sleep are associated with the risk of developing hypertension.6,7 Furthermore, there is an increasing emphasis on objective measures that avoid the recall bias inherent in self-reported measures. 8 Objective measures of sleep include total sleep time (TST) and sleep efficiency (SE), 9 which are measured through polysomnography and simple devices such as actigraphs. TST is generally defined as the total duration of sleep measured with recording equipment, while SE is defined as the percentage of TST relative to the time in bed (TIB). 10 Although studies have reported that both TST and SE are associated with hypertension, the current evidence for TST remains equivocal. For example, a US study based on overnight polysomnography found that patients with drug-resistant hypertension had shorter TST and lower SE than individuals with normotension or controlled hypertension. 11 In contrast, a US study of Hispanic/Latino adults using wrist-worn actigraphs found that SE, but not TST, was associated with hypertension prevalence. 12 These findings suggest that sleep quality (as indicated by SE) may be a stronger determinant of hypertension than sleep duration (as indicated by TST).
Due to the high costs, technical expertise, and laboratory settings needed for polysomnography, the association between SE and hypertension has been increasingly studied with simple devices that can be used in the home environment. For example, Oume et al. analyzed older Japanese adults using actigraphs and reported that nighttime BP was higher among those with low SE. 13 Similarly, Hirata et al. found that hypertension was more prevalent among Japanese adults with low SE as measured using a contactless biomotion sleep sensor. 14 These findings suggest that SE measured by simple devices has practical applications in BP management and hypertension prevention. However, the definition of SE (TST/TIB × 100) in both those studies was not strictly objective as TIB is reliant on continuous self-recording by the subjects.13,14 This is because TIB is defined as the period in which a subject is in bed for the purpose of sleeping, but measurement devices cannot ascertain the intention to sleep during that period. As an alternative approach, Ramos et al. defined SE based on TST and wake time after sleep onset (WASO) using the formula TST/(TST + WASO) × 100 and reported that hypertension was more prevalent among individuals with low SE. 12 As this formula accounts for arousals during sleep, this form of SE is also known as sleep maintenance efficiency (SME). 15
Given the results of Ramos et al., 12 SME could represent a device-based measure with potential applications in hypertension prevention. However, when derived from movement-based devices such as actigraphs, SME may be affected by the misclassification of quiet wakefulness with minimal movement as sleep.16,17 To assess the validity of SME as an indicator of hypertension risk, it is necessary to examine its association with BP using devices that incorporate multiple biological signals. For example, Fitbit models equipped with both an accelerometer and an optical heart rate tracker are able to track sleep based on movement and heart rate patterns.18,19 These models have been reported to produce TST and WASO estimates that are comparable to those of polysomnography, 20 both of which are essential for calculating SME. Accordingly, these devices could produce more reliable estimates of SME than movement-based devices. In Japan, some municipal governments have begun using Fitbit devices with the aim of improving sleep quality in their residents. If Fitbit-measured SME is shown to be associated with BP, these municipal projects could potentially contribute to population-level risk assessments for BP elevation. In particular, the detection of such an association could be useful for identifying potential at-risk groups in populations that are relatively normotensive or prehypertensive. However, studies have yet to examine whether Fitbit-measured SME is associated with BP. Therefore, this study was conducted to cross-sectionally examine the associations of systolic BP (SBP) and diastolic BP (DBP) with SME using a dataset linking multi-sensor Fitbit data, health checkup data, and claims data from a Japanese municipality. In addition, we similarly assessed the associations of SBP and DBP with TST, which have shown inconsistencies in previous research.
Methods
Study design and database
This cross-sectional study was conducted using data from the Longevity Improvement & Fair Evidence (LIFE) study, a multiregional resident-level database project developed at Kyushu University (Fukuoka, Japan). 21 In the LIFE study, staff at Kyushu University collected and centrally managed a variety of health-related data for research purposes under individual contracts with participating municipalities in Japan. Depending on the contract with each municipality, the collected data include claims data, health checkup data, and health and welfare data. These different datasets are linked at the resident level through anonymized identification codes.
Our study data included sleep measurements obtained from one municipality's project designed to improve sleep quality in residents. This project was performed during two sessions (November 2023 to December 2023 and January 2024 to March 2024), each of which lasted for approximately 5 weeks. Each participant attended one of these sessions, and sleep measurements were taken using Fitbit Inspire 2 devices (Google LLC, Mountain View, California, USA), one of the Fitbit models that track sleep based on movement and heart rate patterns. 18 Participants were provided with individual feedback based on their Fitbit's sleep measurements at approximately 2 and 5 weeks after session initiation to improve their sleep quality. To control for feedback-driven changes in sleep patterns, we used only data from the first 2 weeks before individual feedback was given. The Fitbit data available for this analysis consisted only of the following sleep parameters: sleep onset time, sleep offset time, TST, and time according to sleep stage (light sleep, deep sleep, rapid eye movement sleep, and WASO). TST was calculated as the total time of all sleep stages excluding WASO (Supplementary Figure S1). Although the sleep parameters were determined using both movement and heart rate patterns, the raw data for these variables were not acquired by the participating municipality.
The project recruited individuals who were not currently receiving medical treatment or medication for sleep-related illnesses (diagnoses of insomnia, hypersomnia, parasomnia, other sleep disorders such as irregular sleep–wake rhythm disorder, or psychiatric disorders) and had already undergone specific health checkups in the same fiscal year. Specific health checkups are available for residents enrolled in the National Health Insurance system (see Supplementary Text S1 for details). We linked approximately 2 weeks of sleep measurement data, specific health checkup data in the same fiscal year, and National Health Insurance claims data for all insurance-covered clinical encounters for up to 1 year before the last sleep measurement date. Using this database, we cross-sectionally analyzed the associations between Fitbit-derived sleep measurement data and BP levels measured during specific health checkups while considering previous disorders and medication use.
Study participants
There were initially 79 participants with Fitbit-derived sleep measurement data. Of these, we excluded seven individuals based on the following criteria: (i) sleep measurements for <5 days (n = 5), (ii) missing specific health checkup data (n = 1), and (iii) specific health checkup conducted after the last sleep measurement date (n = 1). Therefore, the study sample comprised 72 participants.
Study variables
We first acquired participant-level TST and WASO measurements from the Fitbit data. Based on these values, we calculated each participant's SME for each sleep measurement day and determined his/her mean SME over the 2-week observation period. SME was calculated as the percentage of TST relative to the duration from sleep onset until sleep offset using the following formula:

From the specific health checkup results, we acquired the following information for each participant: age, sex, body mass index (BMI), SBP, DBP, triglycerides, high-density lipoprotein cholesterol, low-density lipoprotein cholesterol, fasting blood glucose (FBG), glycated hemoglobin A1c, estimated glomerular filtration rate (eGFR), serum creatinine (SC), uric acid (UA), smoking status (no or yes), alcohol consumption (no, sometimes, or daily), exercise habit (yes or no), and restful sleep (yes or no). Specific health checkups are conducted during the daytime at designated health checkup facilities using nationally standardized protocols specified by the Ministry of Health, Labour and Welfare. Therefore, this study used daytime SBP and DBP measurements. During specific health checkups, BP measurements are taken in accordance with the Japanese Society of Hypertension's guidelines. 3 Specifically, two or more BP measurements are taken in the sitting position at intervals of 1–2 min using an automatic upper-arm sphygmomanometer. When the two values differ by less than 5 mmHg, the mean of the two measurements is used. The variables of smoking, alcohol consumption, exercise habit, and restful sleep were ascertained from self-reported questionnaire responses in which participants selected the applicable answers. For restful sleep, each participant answered whether his/her sleep felt adequately restful.
From the claims data, we acquired the following information for each participant: history of antihypertensive drug prescriptions, history of hypnotic drug prescriptions, history of sleep disorders, and history of cardiovascular disease. Antihypertensive drugs were identified using the list provided by Sagara et al., 22 and hypnotic drugs were identified using the list provided by Okuda et al. with the addition of lemborexant. 23 Sleep disorders were identified using the International Classification of Diseases, 10th Revision Code G47, and cardiovascular diseases were identified using codes I00–I09 and I11–I79.
Statistical analysis
First, we performed a descriptive analysis of the participants’ basic characteristics. Continuous variables were expressed as mean values and standard deviation (SD), and categorical variables were expressed as numbers and percentages. To facilitate the interpretation of results, the participants were categorized into four groups according to SME quartiles: Q1 (lowest), Q2 (lower), Q3 (higher), and Q4 (highest). To ensure that none of these groups were biased toward a particular characteristic, we performed one-way analysis of variance on the continuous variables. As BMI, triglycerides, FBG, glycated hemoglobin A1c, eGFR, and UA demonstrated trends toward logarithmic normal distribution, these continuous variables were logarithmically transformed before analysis. Inter-group differences in categorical variables were analyzed using chi-squared tests; however, Fisher's exact test was used if the variable had an expected frequency of <5.
To determine if SME is linearly associated with BP, we performed linear regression analyses with SBP or DBP as the dependent variable, and continuous SME as the independent variable. To investigate whether groups with lower SME had higher BP, we performed linear regression analyses in which SME was analyzed using the quartile groups; the highest group was set as the reference category. In addition to these simple linear regression models (Model 1), we also constructed multivariable linear regression models that adjusted for basic characteristics that showed inter-group differences in the bivariate analyses (Model 2); models that adjusted for age, sex, BMI, smoking, alcohol consumption, exercise habit, and restful sleep (Model 3); and models that adjusted for antihypertensive medication use in addition to the covariates in Model 3 (Model 4). For the multivariable models, we assessed multicollinearity among the independent variables using the adjusted generalized standard error inflation factor (aGSIF). In all models, SBP and DBP were analyzed as continuous variables.
To investigate the associations between TST and BP, we performed the same regression analyses as for SME. In addition to analyzing TST as a continuous variable, we also categorized the participants into four groups according to TST quartiles: Q1 (shortest), Q2 (shorter), Q3 (longer), and Q4 (longest). Given that a J-shaped trend was observed between TST and BP, the longer group was set as the reference category.
We performed sensitivity analyses for SME and TST by repeating the analyses after excluding participants who had been prescribed any antihypertensive drug during the year before the last sleep measurement date.
As our sample primarily comprised individuals with BP within the normal, high-normal, and elevated ranges, 3 we conducted an additional sensitivity analysis excluding those in the hypertensive range to assess whether the associations remained.
Finally, we internally validated the uncertainty in the coefficient estimates for SME and TST using the bootstrap method. 24 We generated 10,000 bootstrap samples from the original dataset and re-estimated the regression parameters for each bootstrap sample. Based on the distribution of these estimates, we calculated bias-corrected and accelerated 95% bootstrap confidence intervals.
All statistical analyses were performed using R version 4.4.2 (R Foundation for Statistical Computing, Vienna, Austria), and statistical significance was set at an alpha level of 0.05.
Results
Participant characteristics
The mean age of the 72 participants was 57.3 years (SD: 8.2 years), and 48 (66.7%) were women. The mean SBP and DBP were 121.3 mmHg (SD: 12.7 mmHg) and 72.0 mmHg (SD: 9.6 mmHg), respectively. The mean SME was 87.4% (SD: 1.9%), and the mean TST was 377.6 min (SD: 55.2 min). The median SME was 87.2% (interquartile range: 86.2–88.7%), and the median TST was 378.1 min (interquartile range: 343.2–404.5 min). Sleep measurement began an average of 43.0 days (SD: 18.2 days) after BP measurement. Sixteen (22.2%) participants had a history of antihypertensive drug prescriptions, and nine (12.5%) had a history of hypnotic drug prescriptions. There were 11 (15.3%) participants with a history of sleep disorders (10 with insomnia and one with sleep apnea). Also, there were 17 (23.6%) participants with a history of cardiovascular disease (one with hypertensive heart disease, two with angina pectoris, one with acute myocardial infarction, four with cardiac arrhythmia, five with heart failure, two with atherosclerosis, and two with peripheral vascular disease).
The characteristics of participants according to SME quartiles are presented in Table 1. Five participants had missing data for FBG in the lower (n = 2), higher (n = 2), and highest (n = 1) groups. Only eGFR showed a significant difference (p = 0.03) among the groups. Therefore, eGFR was included as a covariate in Model 2 to analyze the associations between SME and BP.
Basic characteristics of participants according to sleep maintenance efficiency groups.
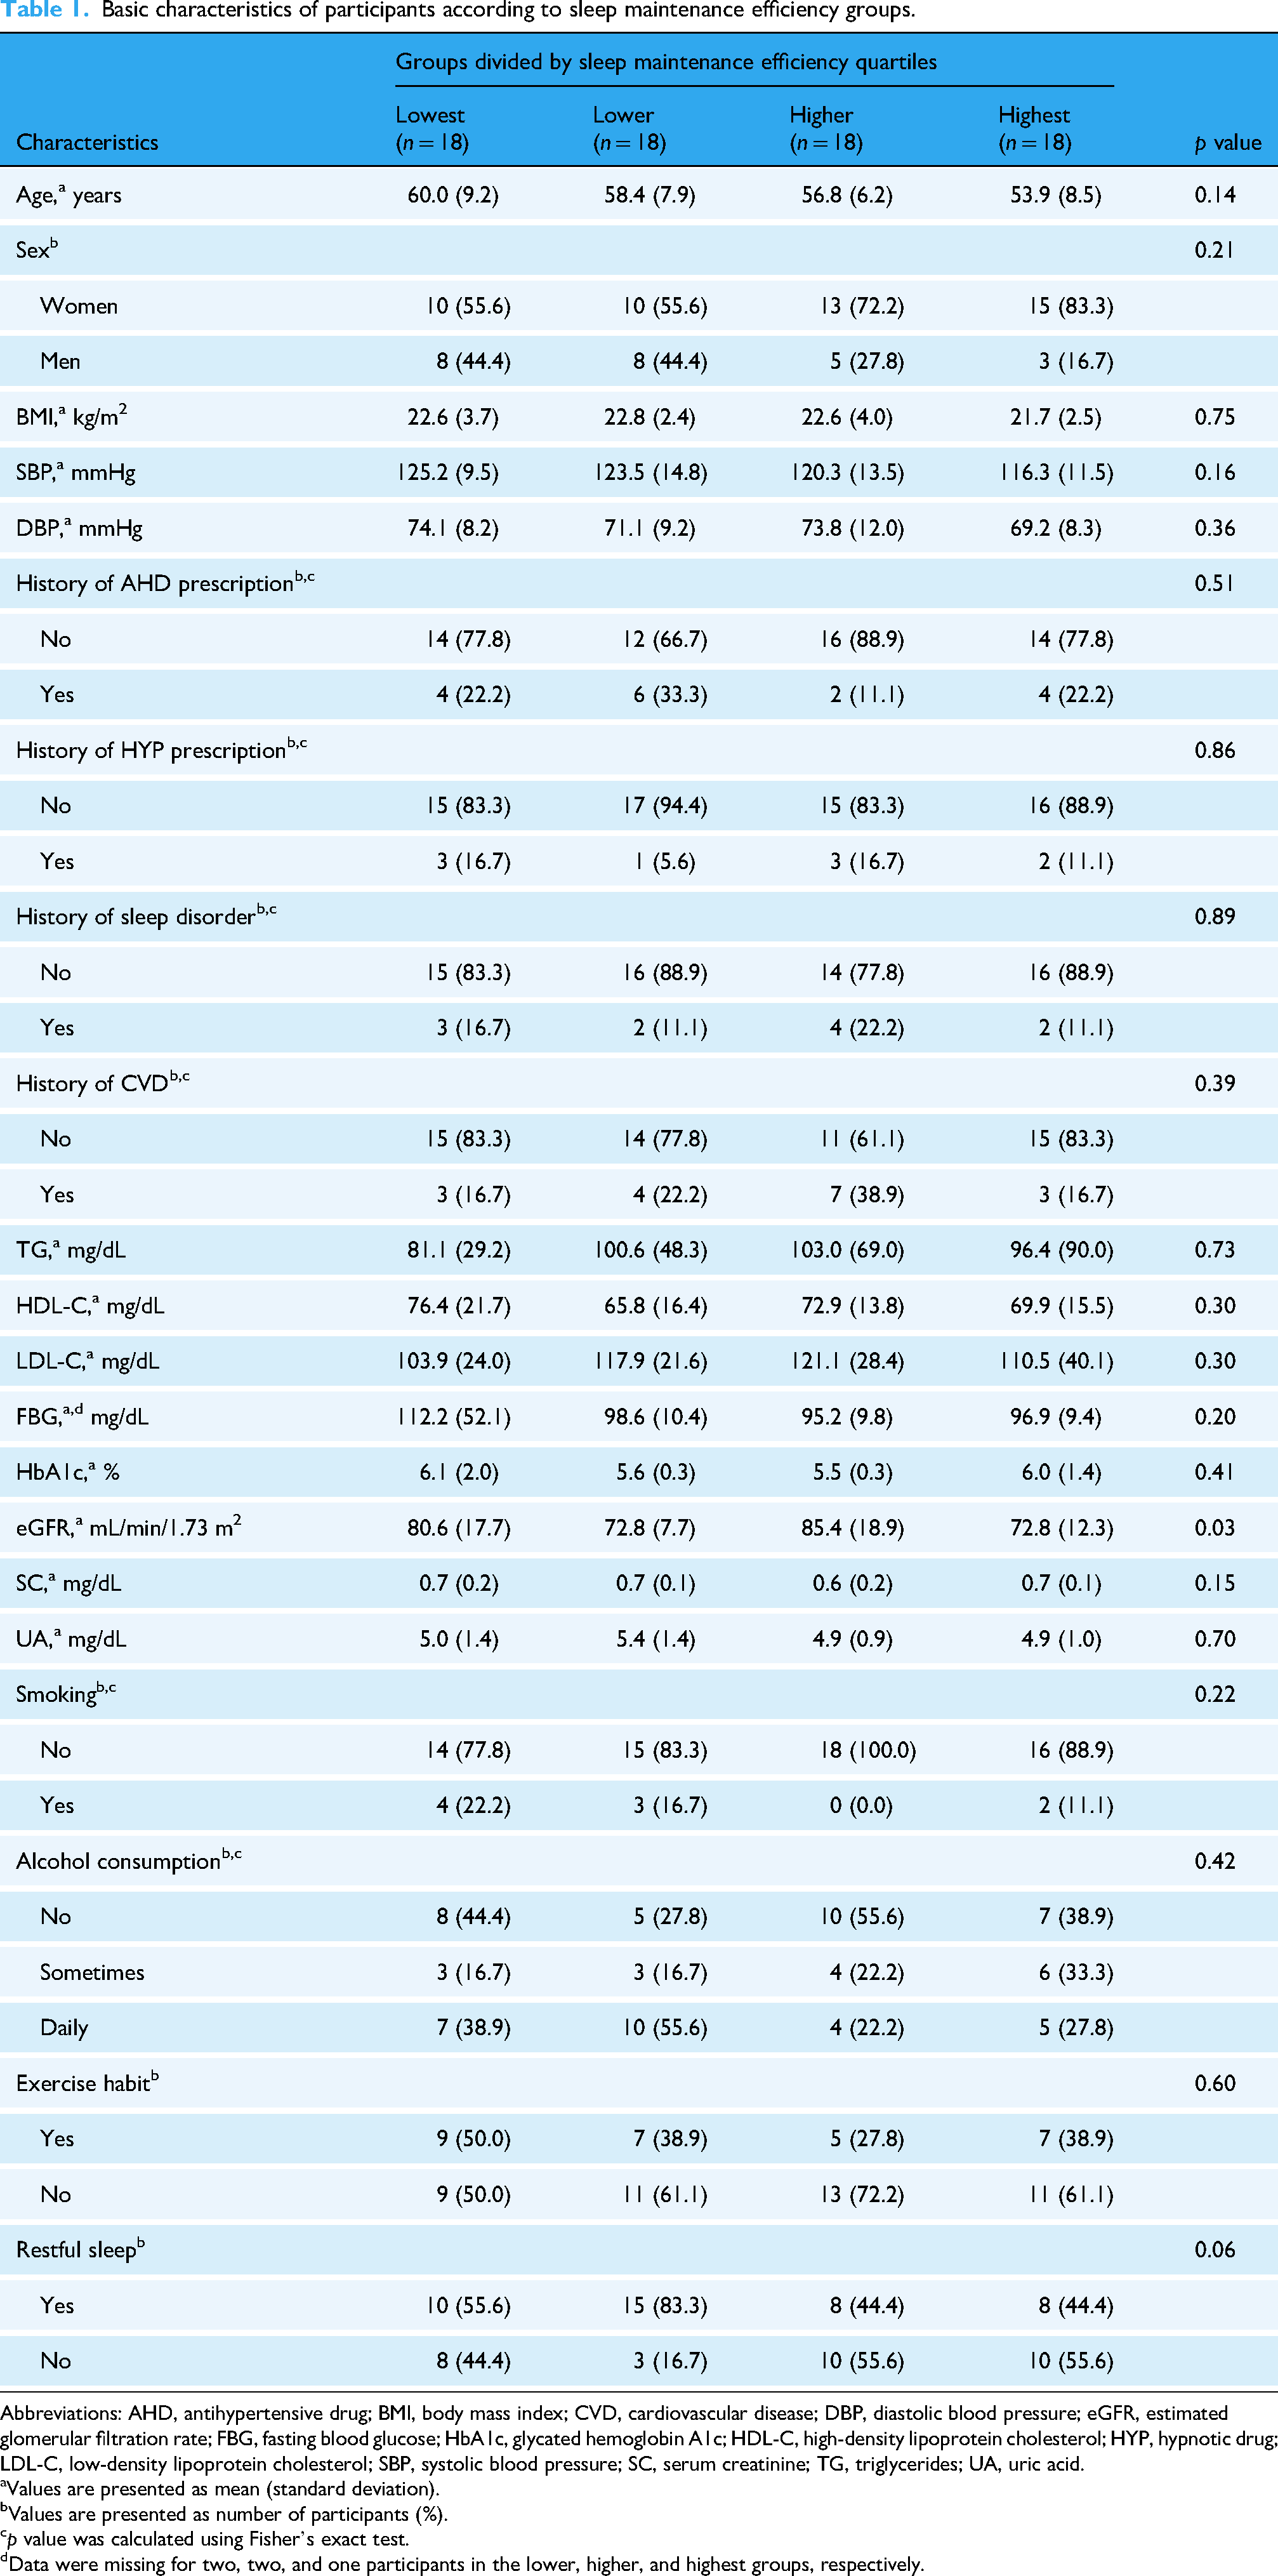
Abbreviations: AHD, antihypertensive drug; BMI, body mass index; CVD, cardiovascular disease; DBP, diastolic blood pressure; eGFR, estimated glomerular filtration rate; FBG, fasting blood glucose; HbA1c, glycated hemoglobin A1c; HDL-C, high-density lipoprotein cholesterol; HYP, hypnotic drug; LDL-C, low-density lipoprotein cholesterol; SBP, systolic blood pressure; SC, serum creatinine; TG, triglycerides; UA, uric acid.
Values are presented as mean (standard deviation).
Values are presented as number of participants (%).
p value was calculated using Fisher's exact test.
Data were missing for two, two, and one participants in the lower, higher, and highest groups, respectively.
The characteristics of participants according to TST quartiles are presented in Table 2. Five participants had missing data for FBG in the shortest (n = 1), shorter (n = 2), longer (n = 1), and longest (n = 1) groups. SC (p = 0.02), UA (p = 0.01), and restful sleep (p = 0.02) showed significant differences among the groups. Therefore, these factors were included as covariates in Model 2 to analyze the associations between TST and BP.
Basic characteristics of participants according to total sleep time groups.

Abbreviations: AHD, antihypertensive drug; BMI, body mass index; CVD, cardiovascular disease; DBP, diastolic blood pressure; eGFR, estimated glomerular filtration rate; FBG, fasting blood glucose; HbA1c, glycated hemoglobin A1c; HDL-C, high-density lipoprotein cholesterol; HYP, hypnotic drug; LDL-C, low-density lipoprotein cholesterol; SBP, systolic blood pressure; SC, serum creatinine; TG, triglycerides; UA, uric acid.
Values are presented as mean (standard deviation).
Values are presented as number of participants (%).
p value was calculated using Fisher's exact test.
Data were missing for one, two, one, and one participants in the shortest, shorter, longer, and longest groups, respectively.
Associations between sleep measures and SBP
Figure 1 shows scatter plots and box plots of the relationships of SME and TST with SBP. SME showed a linear trend in both the scatter plots and box plots, whereas TST showed a J-shaped trend in the box plot (Figure 1(d)). Table 3 summarizes the results of the linear regression analyses, including the bootstrap estimates. In Model 1 with continuous SME as the independent variable, SBP values significantly decreased with higher SME (B = −1.92 mmHg, p = 0.01). In Model 1 with SME quartile groups as the independent variable, the lowest group had a significantly higher SBP (B = 8.89 mmHg, p = 0.04) relative to the highest group. Similar results were shown in all the multivariable models. SBP values significantly decreased with higher SME (Model 2: B = −1.93 mmHg, p = 0.01; Model 3: B = −1.97 mmHg, p = 0.01; Model 4: B = −1.87 mmHg, p = 0.02), and the lowest group showed a significantly higher SBP relative to the highest group (Model 2: B = 9.15 mmHg, p = 0.04; Model 3: B = 8.52 mmHg, p = 0.04; Model 4: B = 8.51 mmHg, p = 0.04). In contrast to SME, TST showed no linear association or inter-group differences for SBP in any of the models. These findings remained unchanged in the bootstrap analysis.

Scatter plots and box plots for systolic blood pressure according to sleep maintenance efficiency as (a) a continuous variable and (b) quartile groups and according to total sleep time as (c) a continuous variable and (d) quartile groups. The crosses in the box plots represent the mean values of systolic blood pressure.
Linear regression results for systolic blood pressure (n = 72).

Values are presented as unstandardized coefficients (mmHg) followed by 95% confidence intervals in square brackets and bias-corrected and accelerated 95% bootstrap confidence intervals in round brackets. Bolded confidence intervals indicate that the coefficients are statistically significant (α = 0.05). Both SME and TST were analyzed as continuous and categorical variables in Models 1, 2, 3, and 4. Model 1 was unadjusted. Model 2 for SME was adjusted for eGFR, and Model 2 for TST was adjusted for SC, UA, and restful sleep. Model 3 was adjusted for age, sex, BMI, smoking, alcohol consumption, exercise habit, and restful sleep. Model 4 was adjusted for antihypertensive medication use in addition to the covariates in Model 3. Abbreviations: BMI, body mass index; eGFR, estimated glomerular filtration rate; SC, serum creatinine; SME, sleep maintenance efficiency; TST, total sleep time; UA, uric acid.
Supplementary Table S1 shows the results of the sensitivity analysis that excluded participants who had been prescribed any antihypertensive drug within the previous year. A significant association between SME and SBP (B = −1.94 mmHg, p = 0.04) was observed only in Model 3 with continuous SME. However, in the bootstrap analysis, a significant association between SME and SBP was found in all models, consistent with the results that included participants prescribed antihypertensive drugs. TST was not associated with SBP in any of the models, nor did the bootstrap estimates show an association.
Supplementary Table S2 shows the results of the sensitivity analysis that excluded participants with SBP ≥ 140 mmHg. For continuous SME, the negative association with SBP was significant in Models 1–3, but not significant in Model 4 (B = −1.38 mmHg, p = 0.06). For SME quartile groups, the inter-group differences were significant in Models 1 and 2, but not significant in Model 3 (B = 7.41 mmHg, p = 0.06) and Model 4 (B = 7.28 mmHg, p = 0.06). However, the bootstrap analysis detected a significant association between SME and SBP in all models, which was consistent with the results that included participants with SBP ≥ 140 mmHg.
The maximum aGSIF was 1.39 across all multivariable models for SBP in the original dataset, suggesting that multicollinearity was not a concern.
Associations between sleep measures and DBP
The results of the linear regression analyses are summarized in Table 4. Neither SME nor TST showed a linear association or inter-group differences for DBP across all models. These results remained unchanged in the bootstrap analysis. Supplementary Figure S2 shows scatter plots and box plots of the relationships of SME and TST with DBP.
Linear regression results for diastolic blood pressure (n = 72).
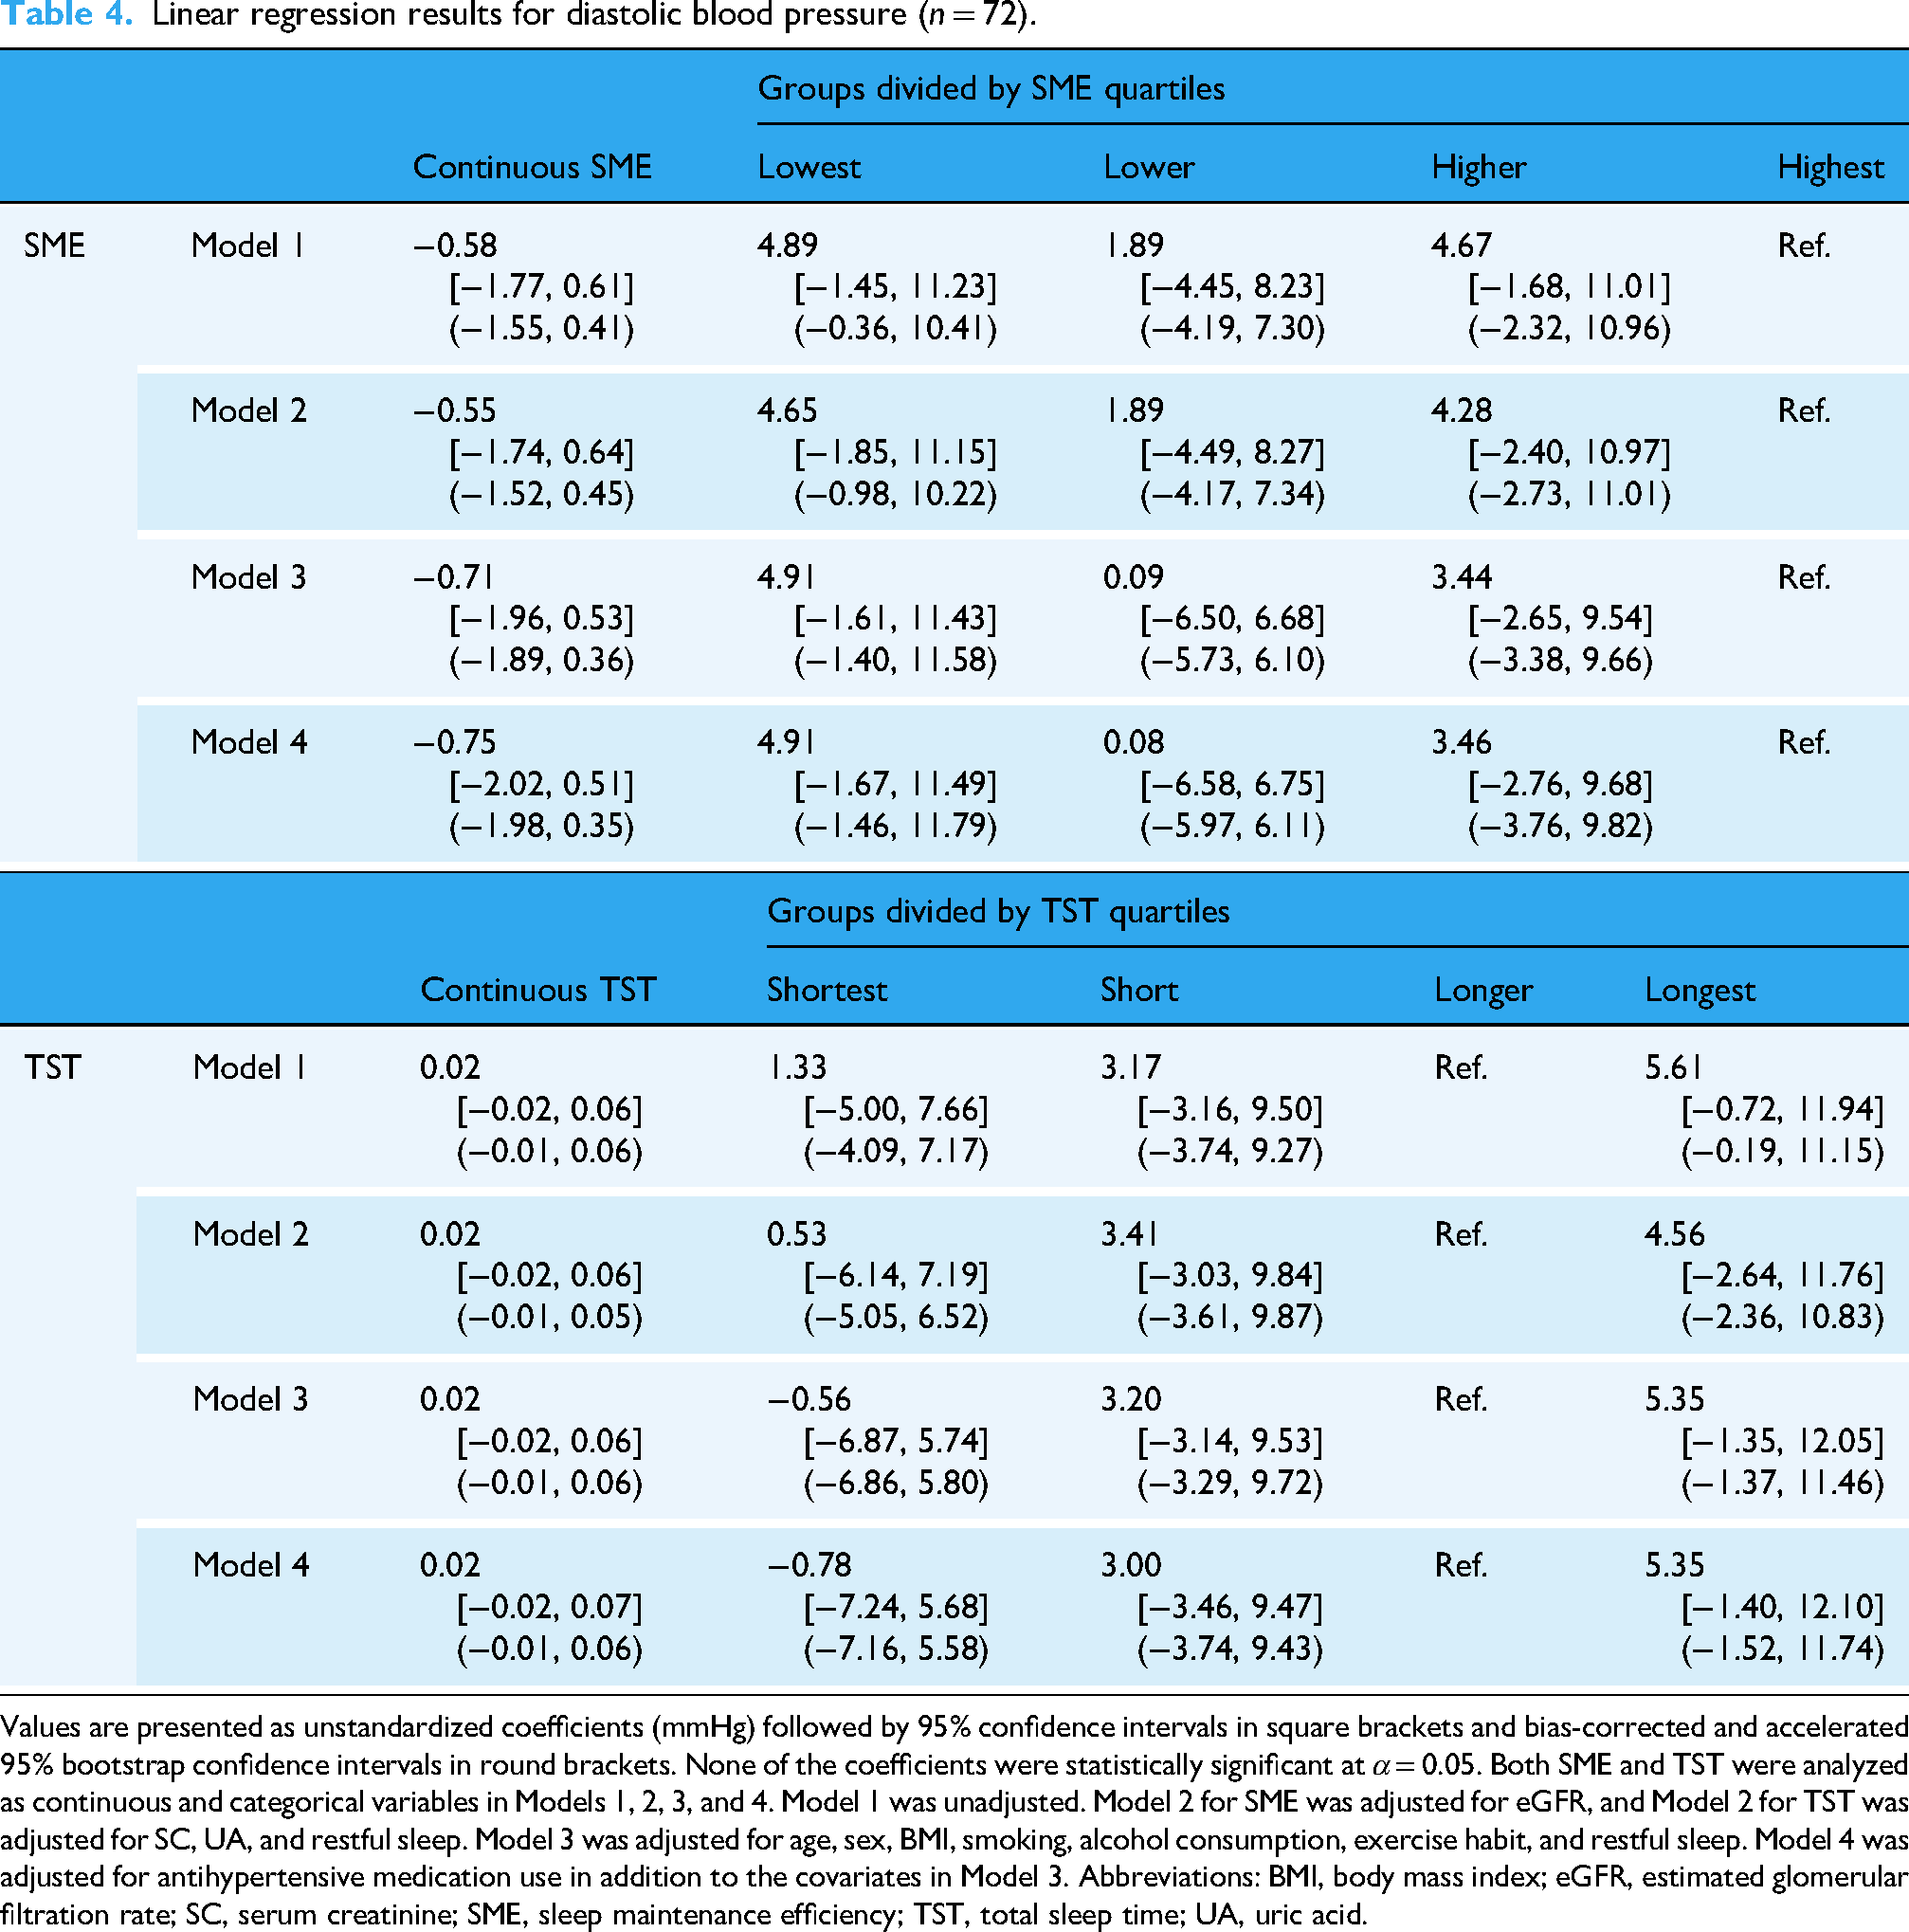
Values are presented as unstandardized coefficients (mmHg) followed by 95% confidence intervals in square brackets and bias-corrected and accelerated 95% bootstrap confidence intervals in round brackets. None of the coefficients were statistically significant at α = 0.05. Both SME and TST were analyzed as continuous and categorical variables in Models 1, 2, 3, and 4. Model 1 was unadjusted. Model 2 for SME was adjusted for eGFR, and Model 2 for TST was adjusted for SC, UA, and restful sleep. Model 3 was adjusted for age, sex, BMI, smoking, alcohol consumption, exercise habit, and restful sleep. Model 4 was adjusted for antihypertensive medication use in addition to the covariates in Model 3. Abbreviations: BMI, body mass index; eGFR, estimated glomerular filtration rate; SC, serum creatinine; SME, sleep maintenance efficiency; TST, total sleep time; UA, uric acid.
Similarly, the sensitivity and bootstrap analyses (Supplementary Table S3) found no associations between these sleep measures and DBP in any of the models.
The maximum aGSIF was 1.39 across all multivariable models for DBP in the original dataset, suggesting that multicollinearity was not a concern.
Discussion
This study examined the associations between SME and BP in a Japanese population using a database that linked Fitbit-derived data, specific health checkup data, and claims data. The simple regression analysis showed that SBP values significantly decreased with higher SME despite the wide dispersion of SBP values, particularly in the middle range of SME (Figure 1(a)). These results suggest that SME is one of the multiple factors associated with SBP. Importantly, the association between SBP and SME remained significant even after adjusting for age, sex, BMI, smoking, alcohol consumption, exercise habit, restful sleep, and antihypertensive medication use. Furthermore, the results of the multivariable regression analyses remained unchanged in the bootstrap analysis and were replicated in a sensitivity analysis that excluded individuals with a history of antihypertensive drug prescriptions. These findings suggest that SME, as an objective measure of sleep quality, is associated with SBP independently of these physical characteristics, lifestyle habits, subjective sleep quality, and antihypertensive treatment.
On the other hand, SME showed no significant association with DBP. A possible explanation is that SME may be more closely associated with SBP than DBP through underlying physiological mechanisms. Frequent arousals from sleep have been reported to increase daytime sympathetic nervous system activity (sympathetic tone). 25 When considering that SME is reflective of the degree of sleep arousals, it is possible that the elevation in sympathetic tone due to low SME led to an increase in SBP. In an analysis of electroencephalogram-measured sleep quality, Iwagami et al. reported that the impact of low sleep quality was more apparent for daytime SBP than DBP. 26 Our findings are consistent with these studies, suggesting that sympathetic activation could be involved in the association between sleep quality and BP.
In our study, the association between SME and SBP was also demonstrated in the simple regression analysis with SME quartile groups as the independent variable. The lowest-SME group (125.2 mmHg) had a higher SBP than the highest-SME group (116.3 mmHg). As the difference of 8.9 mmHg is modest, this finding should be interpreted with caution. However, we consider that this difference still has clinical relevance, given that a 10-mmHg increase in SBP was associated with an approximately 30% higher risk of cardiovascular disease in China 27 and that a 4-mmHg reduction in SBP was estimated to prevent 10,000 stroke deaths and 5000 coronary artery disease deaths annually in Japan. 3 Moreover, apart from the highest-SME group, the other groups had BP levels that would be classified as “high-normal BP” according to the Japanese Society of Hypertension's Guidelines for the Management of Hypertension (JSH 2019). 3 BP levels in the high-normal range have been associated with an increased risk of developing hypertension,28,29 major cardiovascular and non-cardiovascular chronic diseases, 27 and cardiovascular mortality. 30 According to Vasan et al., individuals aged 35–64 years with BP in the 120–129/80–84 mmHg range had approximately four times higher odds of progressing to hypertension than those with BP < 120/80 mmHg. 29 Therefore, it may be important for the three lower SME groups to monitor their potential for elevated SBP and to review their lifestyle habits to prevent future BP elevation.
Similarly, the lowest SME group had significantly higher SBP than the highest SME group in all the multivariable models that adjusted for the various participant factors. This indicates that the differences in SBP levels among the SME groups are independent of these factors. Although these findings were not replicated in the sensitivity analysis that excluded participants who had previously used antihypertensive drugs (Model 2: p = 0.051; Model 3: p = 0.053), this may have been influenced by a lack of statistical power due to the small sample size. Importantly, the bootstrap estimates showed a significant association between SME and SBP in the same models. Larger studies are needed to verify if sleep quality should be considered a lifestyle risk factor for hypertension in groups with low SME.
The bivariate analysis in our study showed no significant difference in self-reported restful sleep across the SME groups (p = 0.06). Self-reported measures of sleep quality can reflect psychological aspects that are not captured by device-based measures. 9 Therefore, perceived restful sleep and SME may not always coincide. A recent study observed an association between self-reported restful sleep and incident hypertension, suggesting a link between a broad measure of sleep quality encompassing psychological aspects and hypertension risk. 31 In addition, our study suggests that device-measured sleep quality, specifically SME, is associated with BP.
Our analyses did not detect any associations between TST and BP. This aligns with the actigraphy-based findings of Ramos et al. 12 and the electroencephalography-based findings of Iwagami et al. 26 In contrast, the polysomnography-based study by Friedman et al. 11 and the actigraphy-based study by Oume et al. 13 reported that both SE and TST were associated with BP. Although the underlying cause of this discrepancy is unclear, the relationship between TST and BP may be more complex than that between SME and BP. Indeed, the TST groups in our study demonstrated a J-shaped trend with BP (Figure 1(d)). An exploratory analysis showed that SBP tended to be higher in the group with short TST and low SME, although the interaction between TST and SME was not significant (Supplementary Figure S3). Additional studies are required to explore the complex relationship between TST and BP.
To our knowledge, this is the first study to assess the associations between BP and Fitbit-derived SME. Our study was strengthened by the measurement of sleep data using a simple wearable device that evaluates both movement and heart rate patterns. Another strength was the use of SME, an objective sleep measure that is completely device based. Furthermore, the linkage of these sleep measurement data with specific health checkup data and claims data helped to reduce misleading results arising from potential confounders such as previous diseases and medication use.
However, the study has several limitations. First, this was a cross-sectional study, which does not allow us to determine the causal relationships between the sleep measures and BP. While we discussed these associations in the context of the frequently reported sleep-to-BP pathway, it is important to note that sleep and BP may also interact bidirectionally. 32 Second, our study sample was drawn from a single municipality, and our findings may not be generalizable to other populations. Third, because the accuracy of sleep metrics can differ across devices, 33 our results may not be generalizable to other devices. Fourth, although Fitbit devices can track other biological parameters (e.g. activity indicators, heart rate data, and heart rate variability), these were not collected from participants because the municipality's project focused on sleep measures. Fifth, although we confirmed the participants’ history of sleep disorders and cardiovascular diseases using the claims data, our study sample may include individuals with undiagnosed conditions. For example, obstructive sleep apnea is known to independently affect both sleep quality and BP regulation. 34 Because we did not have data from overnight BP monitoring or clinical screenings for obstructive sleep apnea and other cardiovascular conditions, we could not exclude their potential confounding effects. Sixth, our study sample may include participants with poor-quality sleep in aspects other than interrupted sleep, such as sleep-onset insomnia or early-morning awakening. Nevertheless, we do not consider it likely that such individuals would have a biased distribution across the SME groups because the participants with a history of hypnotic drug prescriptions were not clustered in any specific group (Table 1). Seventh, BP was assessed from a single-point measurement in a health checkup setting during the daytime. Such measurements could be influenced by factors such as the white-coat effect, physical activity, and circadian rhythms.3,35 Due to the lack of nocturnal and ambulatory BP data, these measurements may not be representative of each participant's average daily BP levels. Eighth, our study sample consisted of relatively normotensive individuals (overall mean BP: 121.3/72.0 mmHg), which may not be sufficient to demonstrate the relationship between SME and hypertension. Therefore, the clinical relevance of our findings is limited and should not be overinterpreted as evidence for the clinical management of hypertensive patients. Despite this limitation, the association between SME and SBP remained consistent across the bootstrap analyses, including those performed after excluding participants with SBP in the hypertensive range. Previous studies have reported that nonideal sleep health increases the risk of developing hypertension among the general population in Japan 31 and that SME is related to hypertension prevalence. 12 Consistent with these reports, our findings further indicate that even within the normotensive range, individuals with lower SME have higher BP. This graded relationship, although exploratory, suggests that device-measured SME may have potential as an early indicator of BP elevation risk among individuals who are currently within the normotensive range. Further longitudinal analyses are needed to examine whether prolonged exposure to low SME contributes to the development of hypertension over time across the normal, high-normal, and elevated BP levels.
Conclusions
SME, a measure of sleep quality determined from multi-sensor Fitbit-derived data, was found to be negatively associated with SBP. This negative association was also observed in sensitivity analyses with bootstrapping that focused on individuals without antihypertensive medication use and individuals with SBP in the normotensive range. In contrast, TST, a measure of sleep duration, showed no significant association with SBP or DBP. Assessments of sleep quality using wearable devices may provide useful insights that support the prevention of BP elevation and population health monitoring. Future prospective studies are warranted to establish causal relationships and to clarify the impact of sleep duration on hypertension risk.
Supplemental Material
sj-pdf-1-dhj-10.1177_20552076261420875 - Supplemental material for Sleep maintenance efficiency measured by multi-sensor wristband devices and its association with blood pressure: The LIFE study
Supplemental material, sj-pdf-1-dhj-10.1177_20552076261420875 for Sleep maintenance efficiency measured by multi-sensor wristband devices and its association with blood pressure: The LIFE study by Yubin Sung, Kenichi Goto, Yurina Akeno, Megumi Maeda and Haruhisa Fukuda in DIGITAL HEALTH
Footnotes
Acknowledgements
This study was supported by the Japan Agency for Medical Research and Development and by the Japan Science and Technology Agency.
Ethical approval
This study was approved by the Kyushu University Institutional Review Board for Clinical Research (Approval Number: 22114-08).
Consent to participate
The Kyushu University Institutional Review Board for Clinical Research approved opt-out consent and waived the requirement for written informed consent.
Consent for publication
Not applicable.
Author contributions
Funding
The authors disclosed receipt of the following financial support for the research, authorship, and/or publication of this article: KG and HF were supported by the Japan Agency for Medical Research and Development (AMED) under Grant Number JP22ek0210174. HF was supported by the Japan Science and Technology (JST) Agency Fusion Oriented REsearch for disruptive Science and Technology (FOREST) Program under Grant Number JPMJFR205J.
Declaration of conflicting interests
The authors declared no potential conflicts of interest with respect to the research, authorship, and/or publication of this article.
Data availability
The data used in this study were acquired under agreements between Kyushu University and the participating municipality, which stipulate that the data can be used only by authorized research institutions and cannot be shared with third parties.
Guarantor
Kenichi Goto, MD, PhD
Use of AI tools
ChatGPT (OpenAI) was used solely for language editing. All AI-assisted edits were manually reviewed by the authors to ensure factual accuracy and to check for plagiarism. No new scientific content, data analysis, tables, figures, or references were generated by any AI tools.
Supplemental material
Supplemental material for this article is available online.
References
Supplementary Material
Please find the following supplemental material available below.
For Open Access articles published under a Creative Commons License, all supplemental material carries the same license as the article it is associated with.
For non-Open Access articles published, all supplemental material carries a non-exclusive license, and permission requests for re-use of supplemental material or any part of supplemental material shall be sent directly to the copyright owner as specified in the copyright notice associated with the article.