
Abstract
The wireless sensor network represents distributed environment that consists of sensors and actuators to monitor and control real-world objects and devices. Web services and service-oriented architecture are fundamental elements to provide on-demand applications. The integration of business processes with wireless sensor network and service-oriented architecture will result in a better alignment of enterprise applications. This article uses multiple-domain matrix extensions called the business process model and notation–multiple-domain matrix to analyze structures of and relations among processes modeled in the business process model and notation with wireless sensor network elements and services. By applying an organization-activity multiple-domain matrix partitioning algorithm, different organizations and coupled activities with cyclic relations are identified to provide process structure information in a matrix perspective, which promote business process analysis and optimization. The partitioning analysis results can be used to form an initial software architecture which includes subsystems or packages so that the architecture-centric software engineering practice can be applied to help the development of wireless sensor network applications. Two process examples of wireless sensor network applications were used and analyzed for illustration and validation purposes.
Keywords
Introduction
Various organizations have different business processes to cope with commercial tasks and project problems. Applying sensors and actuator in enterprise application to enable further process automation can improve work performance and reduce project cost. Service-oriented computing (SOC) has become an important trend in software engineering field, exploiting both Web services and service-oriented architecture (SOA) as fundamental elements to provide on-demand applications. Recent research of wireless sensor network (WSN) has focused on making sensors as Web services accessible in a loosely coupled manner in SOAs. Each sensor node in a WSN provides one or more services which can be addressed by service tasks of business processes. The WSN applications can be considered as distributed workflows or business processes such that the services offered by the sensor nodes can be used to build on-demand enterprise applications.
Using a process definition language and process modeling tool to describe business processes allows an enterprise to focus on the structure of the processes and relations among elements in the processes. The business process model and notation (BPMN) provides standard process modeling notations and can be transformed into XML process execution languages such as XML process definition language (XPDL) and business process execution language for Web services (BPEL4WS). By analyzing the structure of the processes and relations among process elements, the processes can be improved and optimized, increasing process execution performance. Therefore, this study focused on the structure of and relations among business processes that can be used to analyze and group related process activities for process improvement and optimization.
The multiple-domain matrix (MDM) and design structure matrix (DSM) are often used to analyze and optimize the structure of a system design process. However, the DSM cannot handle the complex flow among elements such as parallel split, synchronization, exclusive choice, multiple choice, and synchronizing merge. Furthermore, a conventional DSM analysis method cannot handle complex processes modeled using BPMN.
To analyze the structure of and relations among processes, this study extended the MDM for describing elements and relations among business processes modeled using BPMN notations. According to ubiquitous business process model and notation (uBPMN) in Yousfi et al. 1 and WSN task in Tranquillini et al., 2 we provide activity DSM representation of WSN elements for modeling and analyzing business processes of WSN applications. The extensions of the MDM, called the BPMN-MDM, were verified using workflow patterns3,4 modeled in the BPMN. These workflow patterns serve as basic process elements to construct processes. Therefore, the BPMN-MDM can be used to identify the elements of processes modeled in the BPMN and capture the relations among those elements for further process analysis.
This article proposes an organization-activity MDM partitioning algorithm to analyze the processes modeled in the BPMN. Using the proposed partitioning algorithm, the activities and organizations of business processes can be analyzed, planned, and optimized.
We describe background information in section “Background work,” detail the main features of this work in section “MDM extensions using BPMN and WSN elements,” verify the BPMN-MDM extensions using workflow patterns in section “Verification of BPMN-MDM using workflow patterns,” show an example demonstrating the proposed approach in section “Process analysis of WSN applications,” discuss the related work in section “Related work,” and finally summarize the benefits and present the conclusion in section “Conclusion.”
Background work
In this section, we introduce background information about studies that considerably affect this study, particularly, studies on process modeling and definition, the MDM and DSM, and process analysis and optimization.
Process modeling standards
The languages used to describe business processes include Web services flow language (WSFL), 5 XLANG, 6 and business process modeling language. 7 Based on the integration of WSFL and XLANG, IBM and Microsoft have developed BPEL4WS, 8 which define a set of standards for business processes. Because BPEL4WS lack descriptions of members of business processes, IBM and SAP proposed the WS-BPEL extension for people in 2005. 9 BPEL4WS version 2.0 was released in 2007; 10 it is an XML execution language based on Web service for business process management. It is suitable for programmers, but it is difficult for business people and analysts to understand because they prefer to visualize processes in a flowchart format. Therefore, the BPMN was developed to provide a bridge between business process visualization and execution.
BPMN, developed by OMG who released BPMN v2.0 in 2011, 11 provides visual business process notation, which serves as a bridge between process design and execution. Thus, XML languages, such as BPEL4WS and XPDL, 12 used to execute business processes can be modeled and visualized using business-oriented notations.
BPMN standardizes business process models and symbols, provides the ability to describe complex business processes, and can be transformed into business process execution languages. BPMN can be used to define process, collaboration, and choreography diagrams. The graphical elements are categorized into two groups. The first group comprises basic modeling elements, which are used to define the basic look and feel of business processes. Most business processes can be modeled using basic modeling elements. The second group comprises extended modeling elements, which extend the basic modeling elements to help support advanced process modeling. Basic modeling elements are divided into five categories:
Flow objects. Flow objects are the main graphic elements used to define the behavior of business processes. There are three process objects: event, activity, and gateway.
Data object. Four elements render the process data: data objects, data inputs, data outputs, and data stores.
Connecting objects. The four connecting objects, namely, sequence flows, message flows, associations, and data associations, connect process objects and other information.
Swimlanes. The pool and lane elements are used for grouping model elements.
Artifacts. Artifacts are used to provide additional information. Two standard artifacts exist, namely, group and text annotation. In addition, the BPMN provides an extension mechanism that allows users to extend artifacts.
Open Geospatial Consortium’s sensor Web enablement reference model
The sensor Web enablement (SWE) reference model established by Open Geospatial Consortium (OGC) provides a suite of specifications related to sensors, sensor data models, and sensor Web services.13,14 The purpose of OGC’s SWE reference model is to resolve the inconsistency problems of different sensor network standards on sensor type, communication link, system discovery, and message accessing. It provides standard data format and unified service interfaces for the developers to develop sensor network services.
The aim of SWE Web services is to enable sensors to be accessible and controllable through the standard Web interface. SWE Web services include four types: sensor observation service (SOS) for accessing real-time or derived sensor observations, sensor planning service (SPS) for assigning tasks to sensors, sensor alert service (SAS) for publishing and subscribing to alerts from sensors, and Web notification service (WNS) for delivering messages using asynchronous communication tools such as email, short message service (SMS), and fax. The purpose of SOS is to provide an interoperable way to query and manage sensor data from defined Web service interface. It defines means to register new sensors, remove existing ones and operations to insert new sensor observations. The SPS defines Web service interface for providing information about the capabilities of a sensor and managing sensor planning requests.
DSM and MDM
The DSM proposed by Steward15,16 is used to analyze and optimize the structure of a system design process. The DSM17,18,24 has been widely used in engineering industries, including semiconductor, automotive, space, telecommunications, and electronics industries. The DSM comprises a directed graph that describes relations among thousands of elements for the design, management, or optimization of complex system design, organization member assignment, or activity scheduling. The relations among DSM elements can be binary (i.e. 0 and 1) or numerical and provide more detailed information such as the evaluation of the activity importance and probability of rework. 19
The domain mapping matrix (DMM) and MDM were proposed on the basis of the DSM. The DMM identifies relations among elements in different domains. Because the number of elements may be different in different domains, the DMM is represented as a rectangular N × M matrix, where N and M are the number of elements in the first and second domains, respectively. Danilovic and Browning 20 proposed a DMM to render the relations of product architecture and organization members. They used the DMM to complement the DSM for managing complex product development projects.
The MDM 21 was used to model a complex system that contains elements in different domains. The MDM is a square matrix, which can be regarded as a higher level of abstraction of the DSM. The DSM or MDM analysis methods include partitioning, clustering, banding, and simulation. As shown in Figure 1, the MDM includes three domains of which elements are represented by a circle, triangle, and square. The relations among the elements in the same domain are recorded in three DSM areas of the MDM. The relations among elements of different areas are recorded in six DMM areas on the upper and lower triangles of the MDM. Clustering and partitioning 23 are the main analysis methods of matrix representation. The aim of partitioning is to remove the feedback elements of the matrix to reduce the rework of activities. If an element in the block is changed, other elements within the block must be first analyzed to understand the major effect of the change. Cho and Eppinger 24 proposed an approach for managing complex design projects based on process model simulation and analysis techniques. They used a DSM to capture the information flow between tasks. The proposed model uses sequential, parallel, and overlapping task information, including the most favorable time, most possible time, and the least favorable time of each task to simulate the project total working time for project planning and control.
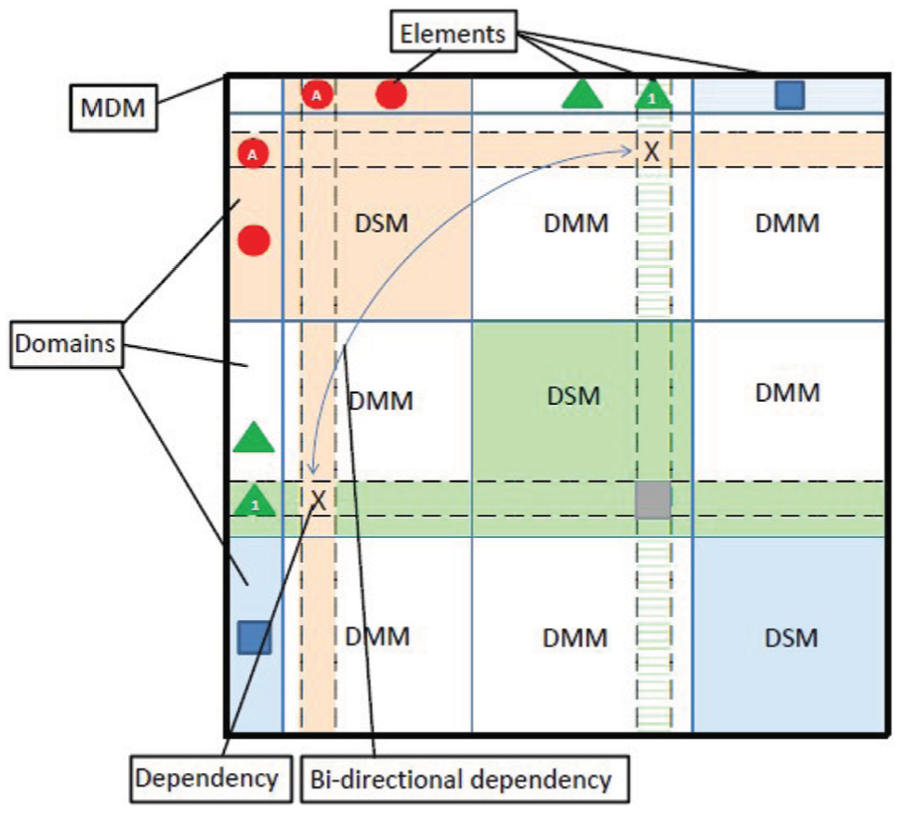
Multiple-domain matrix. 21
Our previous studies22,25 have used the DSM to evaluate and build relations among goals and use cases. The partition results can be used to analyze the affected work product and required effort during requirement change. There are four steps for analyzing the relations among goals and use cases: (1) identifying the relation from a goal to a use case, (2) identifying the relation among use cases, (3) evaluating the relation from a use case to a goal, and (4) analyzing the relation among goals.
Process modeling and analysis
Bahrami 26 proposed an integrated management system, which includes project management, business processes, and workflow techniques to support the execution of the workflow management system. Its aim is to develop a set of tools to semi-automatically modularize workflows on the basis of time planning tools for the execution of the workflow management system. There are three methods that generate the workflow: simple task, which is a workflow task corresponding to a scheduled activity; hierarchical task, which contains subtasks that have not appeared before and can be mapped to a scheduled activity; and process component, which contains subtasks that have appeared before.
Our previous studies proposed an integrated approach, which includes Process2WBS and WBS2Process to help project managers develop a project plan based on organizational standard processes. 27 The activity-based DSM is extended to model the logic of an XPDL route activity. A route activity implements complex routing logic for transfer constraints. Its inputs combine XOR and AND split conditions, and its outputs combine XOR and AND join conditions, which cannot be processed using the DSM. In Process2WBS, the DSM is used to transform organizational processes into a work breakdown structure (WBS), and project plans are transformed into project definition processes; hence, the project can follow the process to appropriately use human and organizational resources.
In recent years, many studies have focused on process optimization.28–31 Abdelsalam et al. 32 used a simulation-based model to calculate the total project development time for solving a scheduling problem with limited project resources. This model uses the DSM to represent the information exchanged among project tasks. The DSM uses a numerical value to describe the information, which includes the probability of rework, impact of rework, and learning degree. The project development time can be reduced by reorganizing the work. Browning and Eppinger 33 proposed a simulation method based on the DSM to analyze iterative processes for calculating the duration of development tasks. Based on Browning’s work, Abdelsalam and Bao 34 proposed a simulation-based optimization method for determining the most favorable sequence of product development activities in the project. Their experimental results showed that the rearranged project tasks can reduce the development time of iterative projects.
Simitsis et al. 35 proposed an extract–transform–load (ETL) system for the logic optimization methods. ETL software is used to retrieve information from various sources. The information is then reorganized, customized, and inserted into a data warehouse. They treated each ETL workflow as one state and generated a state space from the correct state transition set. On the basis of the state space, a heuristic algorithm was proposed to reduce the execution cost of the ETL workflow.
MDM extensions using BPMN and WSN elements
The DSM cannot handle the complex flow among elements such as parallel split, synchronization, exclusive choice, multiple choice, and synchronizing merge, which are the basic and extended model elements in the BPMN. For example, a gateway is used to control the divergence and convergence of sequence flows in a process. Thus, we extended the MDM by defining two types of DSM elements, namely, the activity DSM and organization DSM, to describe each BPMN notation. The extensions of the MDM, called BPMN-MDM, can be used to represent processes modeled in the BPMN. To analyze the structure of and relations among processes, the BPMN-MDM is used to describe elements of and relations among business processes modeled using the BPMN. The relations among elements of business processes are captured using the BPMN-MDM and analyzed to understand the sequence of and coupled relations among process activities and organization members. Figure 2 shows the MDM that can be used to identify the relations among business process elements. The MDM in Figure 2 includes an activity DSM, an organization DSM, an organization-to-activity DMM, and an activity-to-organization DMM. The activity DSM captures the relations among activity, event, gateway, data object, and flow in the processes. The organization DSM identifies the relations among lane, pool, and group, which are related to organization elements. The organization-to-activity DMM and activity-to-organization DMM identify the relations among activity-related and organization-related elements. Our extension, the BPMN-MDM, was verified using workflow patterns and can be used to analyze the relations among process elements and organization elements.

MDM for business process modeling.
Because of space limitations, the mapping tables of basic BPMN notations to BPMN-MDM elements are shown in Figures 3 and 4. The activity DSM of the MDM identifies activity-related BPMN elements and relations. Figure 1 shows five types of BPMN notations mapped to the elements of the activity DSM. These five BPMN elements, event, activity, gateway, data object, and flow, are used to model business processes. The basic format Name: Element Dimension.Type Dimension is used to describe these elements. Here, Name is used to describe the name of the element, Element Dimension is used to identify the object of the element, and Type Dimension is used to specify the type of the element. For a subprocess activity, [ElementIDs] is used to specify the elements included in it. For gateway and flow elements, [Condition] is used to specify the conditions or constraints which should be satisfied by the elements.

Activity DSM representations of BPMN notations.

Organizational DSM representations of BPMN notations.
Figure 4 shows the organization DSM representation of BPMN notations related to the organization. The three BPMN elements, group, lane, and pool, are used to describe the organization or member information of business processes. The same format Name: Element Dimension.Type Dimension: [ElementIDs] is used to specify these elements, where [ElementIDs] indicates the elements contained or owned by the organization or member.
BPMN-MDM extensions can be used to identify the activities of and relations among business processes modeled in the BPMN for analyzing, clustering, partitioning, and optimizing processes.
According to uBPMN notations in Yousfi et al.1,36 and WSN task in Tranquillini et al., 2 we provide activity DSM representation of WSN elements in Figure 5 for modeling and analyzing business processes of WSN applications. Figure 5 shows activity DSM representation of WSN elements including Sensor Task, Reader Task, Collector Task, Actuator Task, and Smart Object. The Sensor Task, Reader Task, Collector Task, and Actuator Task are BPMN tasks which are rectangles that have rounded corners. The format Name: Element Dimension.Type Dimension: Type is used to describe these elements. Here, Name is used to describe the name of the element. The Sensor Task, Reader Task, Collector Task, and Actuator Task are represented as Task.SR, Task.RD, Task.CL, and Task.AR, respectively. The Smart Object is represented as DO.SO which stands for a smart object of data objects. The type refers to the category of the sensor, reader, collector, actuator, and smart object. For example, Check CO2: Task.SR: CO2 means that it is a sensor task to check CO2 value using a CO2 sensor.

Activity DSM representations of notations of WSN element.
Verification of BPMN-MDM using workflow patterns
Workflow patterns are used to describe behaviors of business process executions, which include basic control flow patterns, advanced branching and synchronization patterns, structure patterns, multiple instances, state-based patterns, and cancelation patterns.
The BPMN-MDM extensions were verified using 21 workflow patterns identified by Van der Aalst et al. 4 Most behaviors of business processes can be described using these workflow patterns. They serve as basic process elements to construct business processes. Because of space limitations, we used two examples to describe the modeling of the workflow patterns using the BPMN-MDM extensions.
Figure 6 shows the BPMN-MDM representation of parallel split and synchronization workflow patterns. There are four activities, A, B, C, and D, whose Element Dimension is task and Type Dimension is 1 for an abstract task. There are two gateways, G1 and G2, whose Element Dimension is GW for gateway and Type Dimension is 4 for a parallel gateway. The relations among activities and gateways are identified as :F1.S1, which indicates an anonymous flow in which Element Dimension is F1 for a flow element and Type Dimension is 1 for a sequence flow.
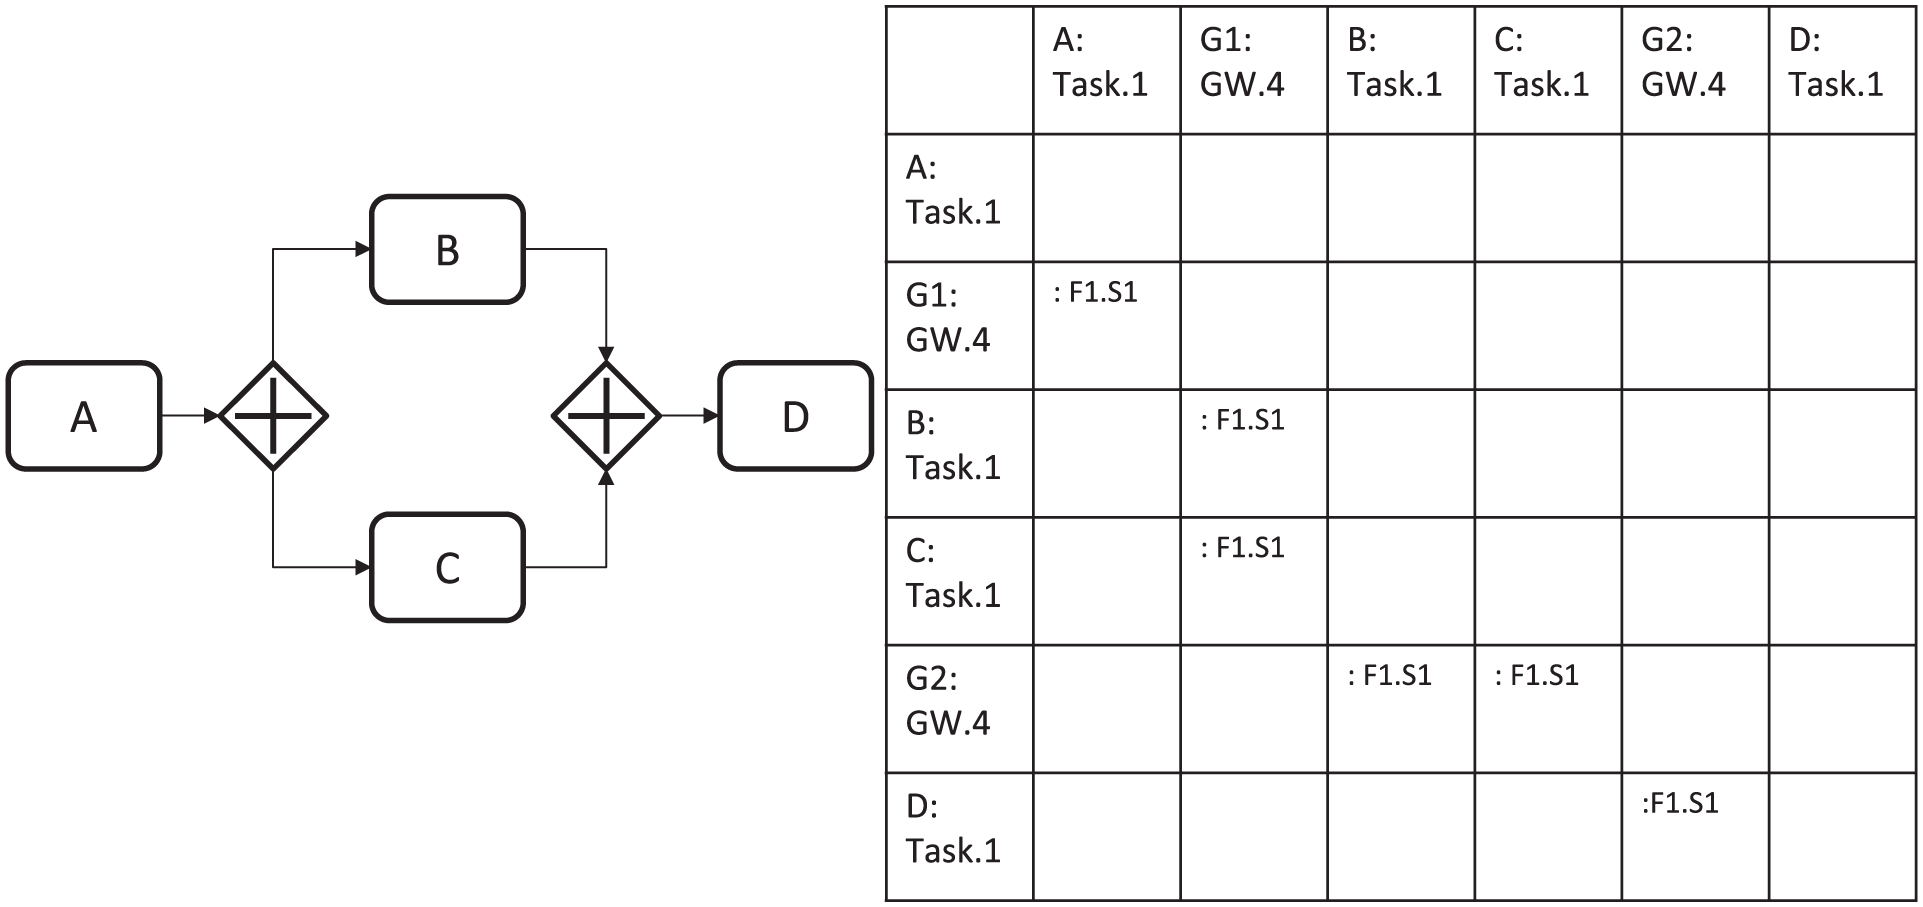
BPMN-MDM representation of parallel split and synchronization workflow patterns.
Figure 7 shows the BPMN-MDM representation of multichoice workflow patterns. There are three activities, X, Y, and Z, whose Element Dimension is task and Type Dimension is 1 for the abstract task. The G3 gateway’s Element Dimension is GW to indicate a gateway and Type Dimension is 3 to indicate an inclusive gateway. The flow between activities and gateways is identified as :F1.S1 to indicate an anonymous sequence flow.
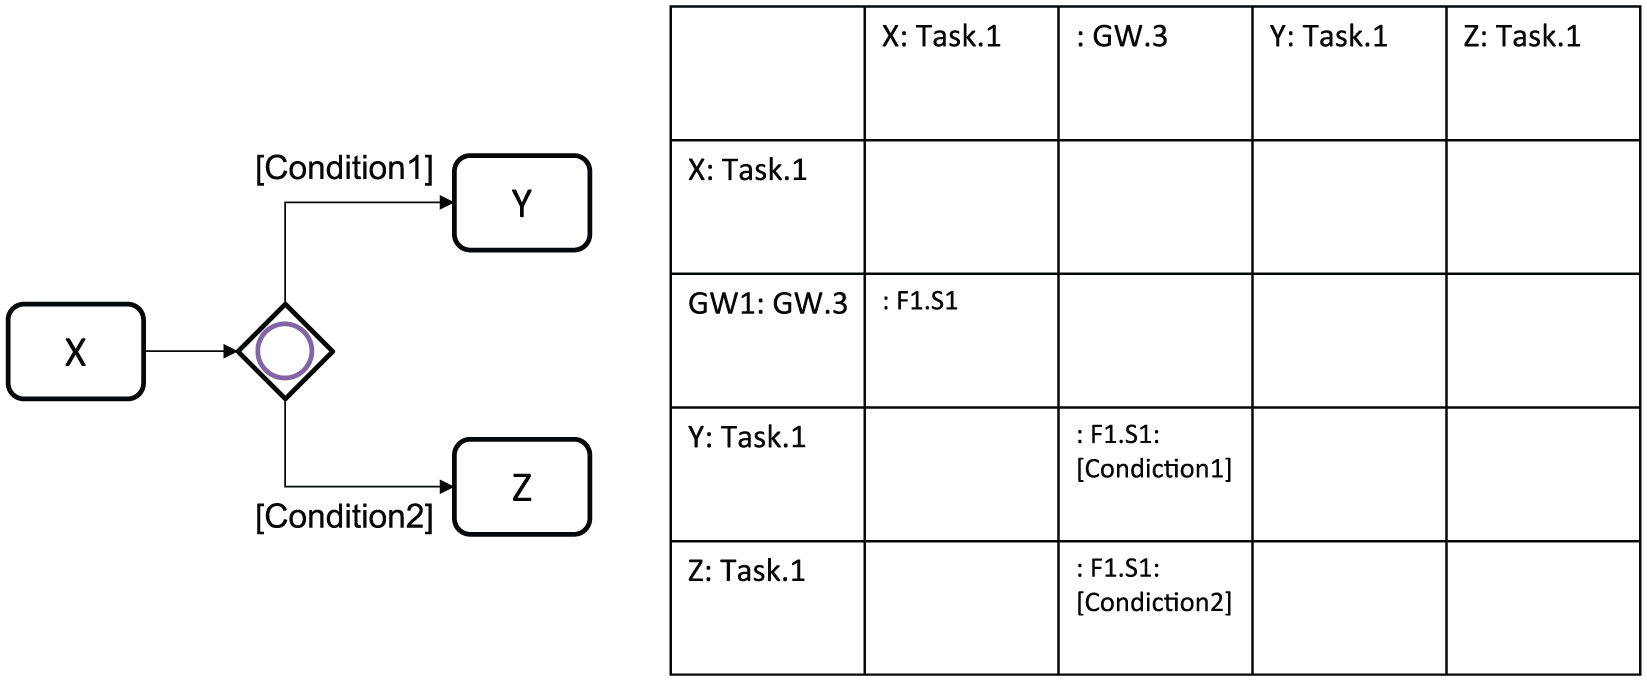
BPMN-MDM representation of multichoice workflow patterns.
Process analysis of WSN applications
The MDM can be used to identify relations among elements in different domains, generate derived relations among elements, and group highly related elements into blocks or clusters. Here, the MDM with the activity DSM and organization DSM is used to identify relations among organization members and activities.
The DSM partitioning algorithm is used to group coupled related elements into blocks. Partitioning organizes a sequence of activities and generates partition blocks that group elements with cyclic relations, which indicate the rework requirements of a process. The feedback links in the DSM can be broken down to reduce loop relations among elements, rework probability, and development time. On the basis of DSM partitioning, we proposed an organization-activity MDM partitioning algorithm to analyze the MDM of business processes modeled in the BPMN, as follows:
Algorithm 1: Organization-Activity MDM Partitioning
Transform the BPMN process model into the MDM with BPMN extensions using the BPMN-MDM mapping table
Convert the cells of flow elements to 1, and the empty cell to 0
Group activities, events, and gateways with their owners to form initial organization blocks Analyze relations in each organization block by applying the DSM partitioning algorithm to form inner activity blocks Find gateway blocks which include a pair of gateways with related activities Analyze the relations among organization blocks to show coupled organization blocks
Analyze the relations among activities, events, data objects, and gateways to form activity blocks by applying the partitioning algorithm
A heating, ventilation, and air conditioning (HVAC) process of the convention center 2 is used as an example to validate our approach. Figure 8 shows the HVAC process of the convention center adopted from Tranquillini et al., 2 and Figure 9 shows the analysis results of the process using Algorithm 1, in which the elements are grouped into two organization blocks including Block 1 Conference Center Information System for WSN-Aware process and Block 2 Conference Center Building for Intra-WSN process. The Inner Blocks 1 and 2 and Inner Blocks 3 and 4 indicate the cyclic relations among elements in Block 1 and Block 2, respectively. Such relations can provide information to reorganize the process or break down some relations for superior process performance. The Gateway Blocks 1 and 2 include a pair of gateways with related activities. The relation from Block 1 to Block 2 shows that the WSN-Aware process sends meeting data including start time, end time, and room information to the Intra-WSN process. The relation from Block 2 to Block 3 shows that the Intra-WSN process calls the service tasks to store ventilation system usage data, charge a user for extra time, or end the meeting. Such information can detect a communication overhead or bottleneck among different blocks.

HVAC process of the convention center adopted from Tranquillini et al. 2

MDM analysis results of the HVAC process of the convention center.
According to our previous research, 24 the partitioning results can be used to form an initial system architecture which includes subsystems or high-level components. Figure 10 shows initial system architecture of the HVAC system. During architecture design phase, the partition blocks are mapped to unified modeling language (UML) subsystem or package notations. In HVAC system example, the two organization blocks will be modeled as UML subsystems which are WSN-Aware subsystem and Intra-WSN subsystem. The inner blocks and gateway blocks are modeled as UML packages in this phase. Using detailed information of the tasks, events, and gateways in each block, software designers can develop detailed design of the services included in each corresponding package. Thus, the architecture-centric software engineering practice is applied to facilitate the development of WSN applications.

Initial system architecture of the HVAC system.
Figure 11 shows the process models of risk analysis and alarm for debris flows (called briefly hereafter DF) based on OGC’s SWE Web services. Two systems are involved in the process: DF risk analysis system (DRAS) and DF alarm system (DAS). The steps in the process include the following: (1) the administrator assigns the region that should be monitored in DAS; (2) DAS sends the region information to DRAS; (3) DRAS calls SPS to allocate tasks to related sensors, including rain gauges, charge-coupled device (CCD) cameras, and geophones, in the assigned region; (4) DRAS calls services of involved sensors in parallel to obtain the sensor data; (5) DRAS calculates the risk degrees of DF based on the obtained sensor data; (6) DRAS sends the consolidated risk data to DAS; (7) DAS calls sensor alarm service and WNS in parallel to notify users who subscribed alarm events via Web interface and to inform key stakeholders through conventional communication tools when the risk degree is higher than a given threshold; and (8) DAS saves the risk data to the database as historical data.

Debris flows risk analysis and alarm process.
Figure 12 shows the analysis results of the DRAS and DAS, in which the elements are grouped into two organization blocks including Block 1 DAS and Block 2 DRAS. Figure 12 shows MDM analysis results of DRAS and DAS. The elements are grouped into two organization blocks including Block 1 DAS and Block 2 DRAS. The relation from Block 1 to Block 2 shows that the DAS sends region data to DRAS. The relation from Block 2 to Block 1 shows that the DRAS sends risk data to DAS. The Gateway Block 1 indicates a pair of inclusive gateways with two service tasks. The Gateway Block 2 indicates a pair of parallel gateways with three sensor tasks. The activities in gateway blocks have large impacts on process performance since there are different types of gateways with conditions to be satisfied.

MDM analysis results of debris flows risk analysis and alarm process.
Figure 13 shows the initial system architecture of the DRAS and DAS. The two organization blocks will be modeled as UML subsystems which are DAS and DRAS. The Gateway Block 1 is modeled as UML Notification and Alarm Package which includes WNS and SAS. The Gateway Block 2 is modeled as Risk Data Sensor Package which includes rain gauge sensor service, CCD image sensor service, and geophone sensor service.

Initial system architecture of debris flows risk analysis and alarm system.
Related work
Glombitza et al. 37 introduced graphical workflow execution language for sensor network (GWELS) to realize SOA programming paradigms for sensor networks. The GWELS offers the workflow elements which are control flows, events, logical connectors, activities and subprocesses, and partner links to model workflow for sensor networks. The authors did not use BPMN as their process modeling language. The GWELS prototype is used to design and transfer workflows into a sensor network application as a sequence of service calls.
Gao et al. 38 extended BPMN v2.0 with sensor and smart device business functions according to the function view of the architecture of information system (ARIS) ARIS architecture and Linked Data principle. They established links from the BPMN v2.0 tasks, subprocesses, and groups to their function view using the resource definition framework (RDF)–based business function model augmented with information from physical devices. Caracaş and Bernauer 39 proposed an approach that business analysts can model business processes using the BPMN editor which integrates a compiler and a simulator for testing and debugging the modeled processes. The process models can be transferred into event-driven code using the compiler with a set of building blocks developed by software developers.
Tranquillini et al. 2 developed a system to model and execute processes with WSNs. They present a WSN-specific extension for BPMN which places the sensors in a separate pool called intra-WSN pool. A process developed BPMN4WSN must have at least two pools which are WSN-aware pool for classical BPMN process and intra-WSN pool to specify WSN logic. The WSN task was introduced as a new activity type that can only be used in the intra-WSN part to express sense, actuate, and aggregate operations. They used a convention center management system called HVAC system to demonstrate their approach. The HVAC system includes a WSN to ensure comfortable levels of temperature, humidity, and CO2 for each meeting room. In our work, the HVAC process of the convention center is analyzed to validate our work. Daniel et al. 40 provided makeSense framework, a unified programming framework and a compilation chain, to generate code from high-level business processes for deployment on WSN nodes.
Yousfi et al.1,36 introduced uBPMN by extends BPMN v2.0 plus additional core modeling elements. To describe specific ubiquity tasks, the uBPMN provides additional graphical elements including Sensor Task, Reader Task, Collector Task, Image Task, Audio Task, and Smart Object. The Sensor Task uses wired, wireless, or smart sensor to sense contextual information. The Reader Task uses a smart reader to read the data from Smart Object such as radio frequency identification (RFID) and near-field communication (NFC). The Collector Task collects data from data object or data store, such as files and databases. The Image Task collects information using a video stream in the business environment. The Audio Task collects information using an audio stream in the business environment. The Smart Object is a kind of BPMN Data Object that represents specific object used to collect data by a sensor, smart reader, micro-phone, or a camera. The authors connected business processes to ubiquitous computing by defining a ubiquitous business process using uBPMN.
We summarize the comparison of these studies with a list of criteria in Table 1. The detailed descriptions of these criteria are as follows:
Approach descriptions: what technique or method proposed or used to support WSN application development?
Process modeling of WSN application: does the approach support process modeling of WSN application?
Process analysis: does the approach support process/workflow analysis?
BPMN support: does the approach support BPMN notations to model business processes?
Software architecture design support: does the approach support design of software architecture for WSN application development?
Comparison of related work.
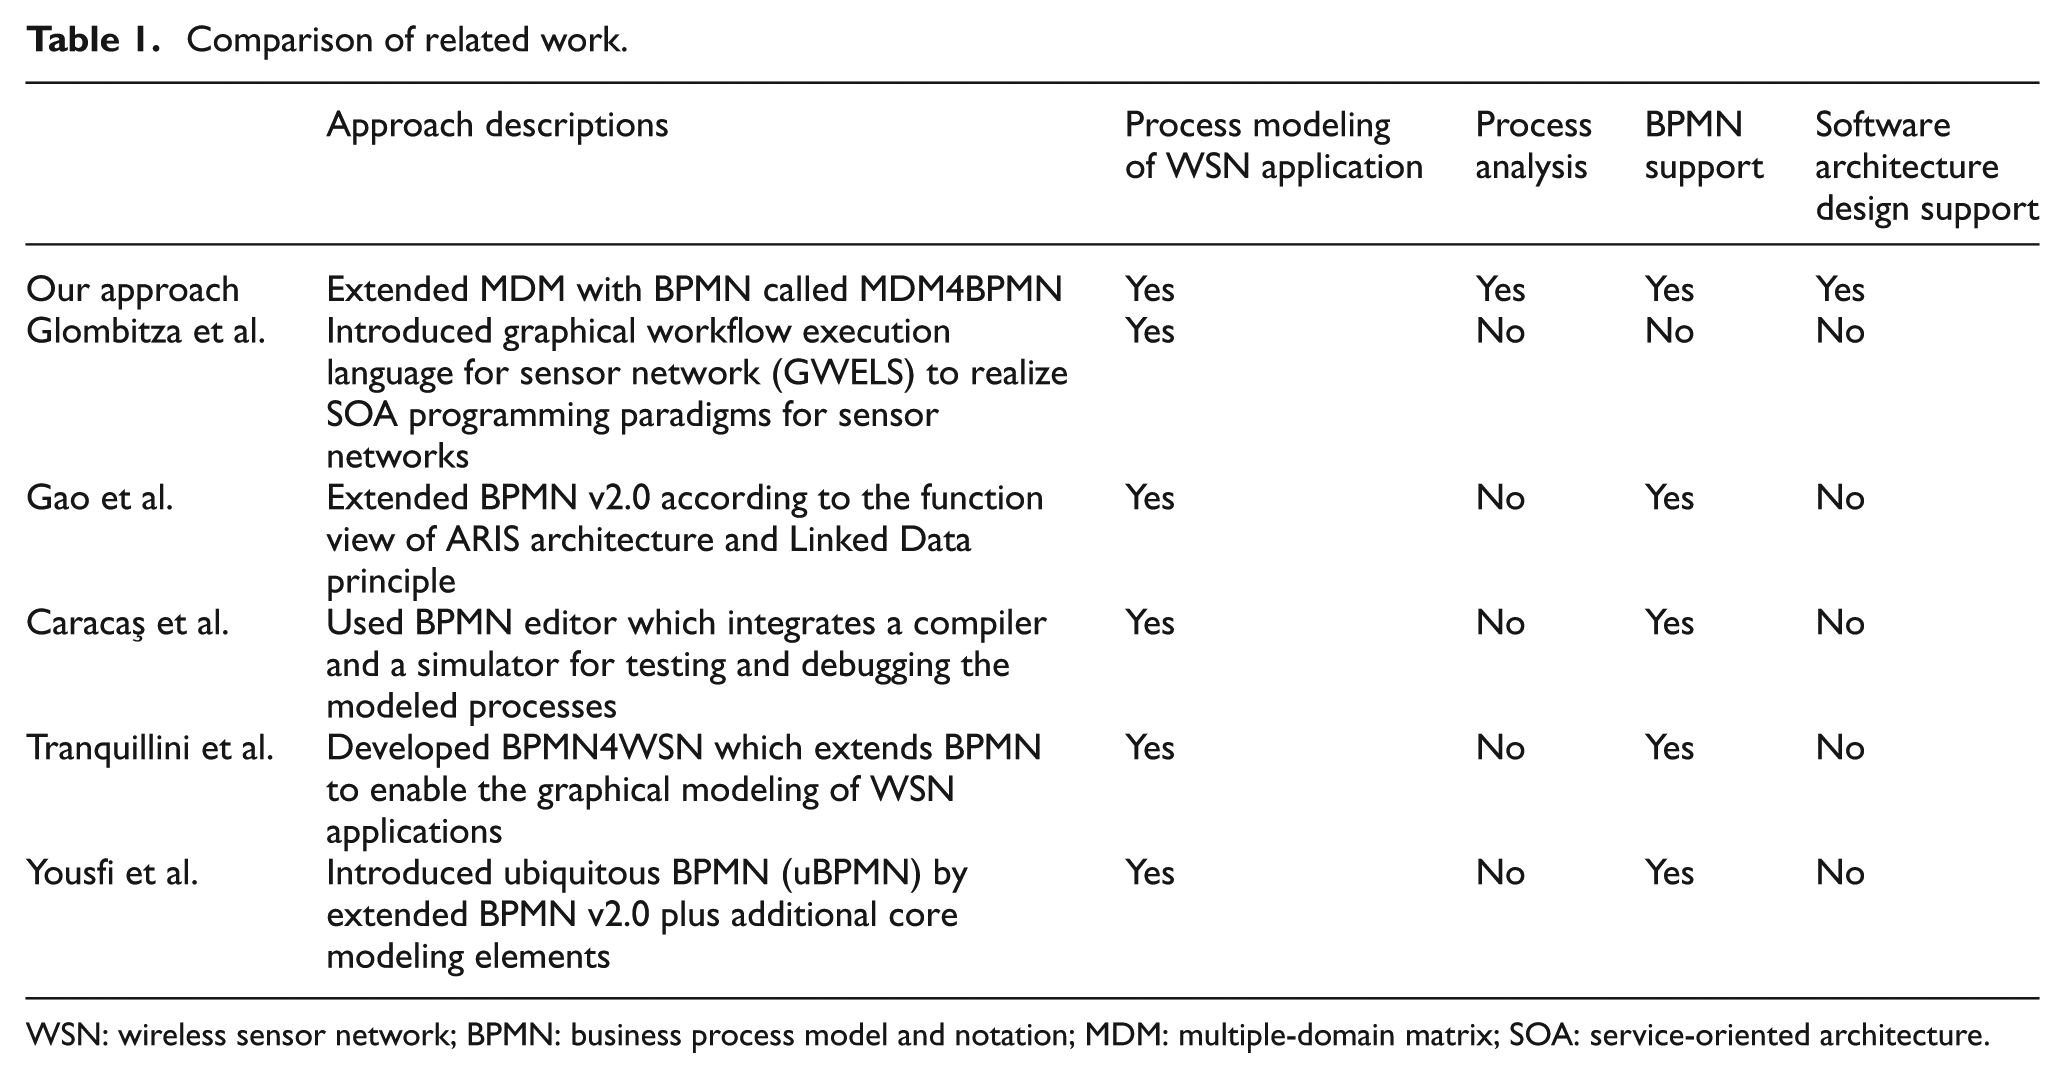
WSN: wireless sensor network; BPMN: business process model and notation; MDM: multiple-domain matrix; SOA: service-oriented architecture.
Conclusion
Effective business process management can reduce development cost, improve work efficiency, and reduce system errors. This article defines extensions of the MDM, called the BPMN-MDM, to analyze structures of and relations among processes modeled in the BPMN with WSN elements.
The BPMN-MDM was verified using workflow patterns, which are basic process elements that model processes and describe behaviors of business process executions. Most business processes can be constructed using these workflow patterns and can be transformed and described in the MDM with the activity DSM and organization DSM using the BPMN-MDM, which verifies the effectiveness of our approach. Therefore, the BPMN-MDM can be used to identify the elements of processes modeled in the BPMN and capture the relations among these elements for further process analysis.
By applying the organization-activity MDM partitioning algorithm on the BPMN business process examples, the organization, inner blocks, and gateway blocks of the MDM were generated. The organization blocks indicate the individual process or organizational members and the activities they are responsible for. The inner blocks of an organization block show that the coupled activity elements belong to the organization member. The gateway blocks include a pair of gateways with related activities. The relationships among organization blocks show the communication needs among organization members, which can be used to identify communication bottleneck or overhead.
The partitioning results can be used to form an initial software architecture which includes subsystems or packages. The organization block will be modeled as UML subsystems. The inner blocks and gateway blocks will be modeled as UML packages. Using detailed information of the tasks, events, and gateways in each block, software designers can develop detailed design of the software system. Thus, the architecture-centric software engineering practice can be applied to help the development of WSN applications.
Two business process examples were used and analyzed using the BPMN-MDM for illustration and validation purposes. Thus, the business process modeled in the BPMN can be transformed into the MDM using the BPMN-MDM, and DSM analysis method can be applied to sequence, partition, simulate, or optimize business processes. The BPMN-MDM, which includes information and characteristics of processes modeled in the BPMN, can serve as the basis to devise new methods and algorithms for process analysis, improvement, optimization, and execution.
Our future work involves developing process optimization methods based on BPMN information of processes identified in the MDM using the BPMN-MDM. The analysis results can be transformed back to processes using process execution languages that can be executed using a workflow engine.
Footnotes
Academic Editor: Jaime Lloret
Declaration of conflicting interests
The author(s) declared no potential conflicts of interest with respect to the research, authorship, and/or publication of this article.
Funding
The author(s) disclosed receipt of the following financial support for the research, authorship, and/or publication of this article: This study is conducted under the grant MOST 104-2221-E-017-014—which is subsidized by the Ministry of Science and Technology