
Abstract
Wireless networks are regarded as a promising candidate for condition monitoring systems of large-scale wind turbines due to the design flexibility, easy deployment, and reduced installation cost. This article investigates different data aggregation approaches of wireless-based architectures for the internal monitoring of a large-scale wind turbine. The main objective is to construct a wireless internal network inside the wind turbine nacelle, for collecting sensing data from different parts and transmitting the data to a remote control center through a wireless external network that serves the turbine towers of the wind farm. The proposed wireless network architectures consist of wireless sensor nodes, coordinator nodes, and a front-end device. The designs of the wireless-based architectures involve choices of physical components, sensor types, sampling rate, and data rate. Wi-Fi is a promising technology that is considered for the wind turbine internal network in this work. Through simulations, the network performance is evaluated with regard to end-to-end delay for different data aggregation approaches of wireless-based architectures.
Introduction
The installed capacity of wind energy is growing very fast compared with other sources of renewable energy. 1 This progress in the wind power industry has enabled wind turbines (WTs) to become more mature, with higher capacities, larger rotor diameters, and taller towers. However, recent studies have shown that as WTs become larger, the failure rate becomes higher, and thus, more maintenance is needed. 2 There are different condition monitoring solutions that are used for monitoring WTs such as supervisory control and data acquisition (SCADA), condition monitoring systems (CMS), and structure health monitoring (SHM). These solutions have been used for real-time monitoring and control of WTs in order to increase the availability, decrease downtime, and reduce operation and maintenance costs. 3 The SCADA system is designed to provide data about the operating condition of WTs. It provides the average signal value of approximately 5–10 min from sensors such as temperature, vibration, power, and current. Compared to CMS, SCADA systems consider deploying small number of sensor nodes (SNs) with a lower sampling rate. Furthermore, SCADA does not collect all the necessary information for condition monitoring purposes. 1 The CMS is designed to provide data about the health of the WT with sampling rates in the kHz range. It consists of SNs and a data acquisition system. The main functions of CMS include data acquisition, data transmission, and data processing. 4 There are different monitoring techniques used in WTs such as vibration analysis, acoustic analysis, ultrasonic testing, oil analysis, strain measurement, and thermography. 2 Regardless the technique used by WTs, the CMS capacity depends on number of SNs, types of sensors, and data processing techniques.
The communication network of a wind farm (WF) can be divided into two parts: the WT internal network and the WF external network. Both wired-based and wireless-based solutions may be considered for either the internal or external network. For a wired-based solution, Ferguson et al. 5 and Swiszcz et al. 6 carried out the design of a data acquisition and CMS for a WT internal network. The CMS was installed on an operating WT (Vestas V47). The CMS consists of two main units: the data acquisition unit in the nacelle and the data storage unit in the tower. Cables are used to connect between different sensor types and the data acquisition unit. The critical parameters monitored by the WT internal network were vibration, rotor speed, current, voltage, temperature, wind speed, wind direction, humidity, and pressure. In Goraj et al., 7 a communication network design for an offshore WF was given that had an Ethernet-based architecture. The authors described the design requirements and network topology for a large-scale WF (the Great Gabbard wind project) in the United Kingdom. In Park et al., 8 a novel CMS was developed and installed at the Yeongheung WF, South Korea, for three WTs supplied by different manufacturers. The communication network for the CMS also has an Ethernet-based architecture. The CMS has been installed in a WT nacelle and operated successfully.
For a wireless-based solution, Meng et al. 9 presented the design of a wireless-based SCADA system for a WF. In Zheng et al., 10 the authors studied the feasibility of applying the broadband wireless technology using WiMAX (Worldwide Interoperability for Microwave Access) for monitoring WFs. The network topology is based on a wireless mesh configuration. The communication network consists of a communication controller at each WT, wireless mesh nodes in the WF, and a remote monitoring station at the control center. In Song et al., 11 the authors designed a remote monitoring system for WTs, where the internal network consisted of a ZigBee-based wireless sensor network and was connected to the control center by a general packet radio services (GPRS) module. In Hsu and Wu, 12 the authors implemented a data transmission interface for remote monitoring and control of a small-scale WT based on ZigBee wireless sensor network. After long-term practical running, the system proved to be successful and stable. The deployment of ZigBee supports data rate up to 250 kbps and lower power consumption. Also, it supports different network topologies (star, ring, and mesh) which could provide coverage range of 10–100 m. 13 In Kang et al., 14 we report that we have recently designed and implemented a condition monitoring and control system for a small-scale WT. It consists of data collection units, a control unit, and a coordinator. The data collection units are installed to collect sensing data from different sensors such as temperature, humidity, pressure, wind direction, wind speed, and vibration. ZigBee-based wireless is used to communicate between a coordinator and data collection units.
One of the recent developments in CMS for WTs is to design a smart, wireless, and energy-efficient sensor network where wired-based solutions cannot be installed. 1 Wireless technology could provide the vital solution to minimize deployment difficulties and cost and is more flexible than wired networks. In this work, Wi-Fi is a promising candidate considered for the WT internal network. The deployment of wireless local area network (WLAN) provides high-speed point-to-point and point-to-multipoint communication. Also, it offers easy installation, more flexibility, and less cost. The selection of Wi-Fi for a WT communication network is based on Nilsson. 15 The author designed and implemented a lifetime monitoring system for a real WT, where the monitoring modules in the hub and the nacelle were connected through WLAN (IEEE 802.11b/g). The field tests of the prototype installation in the WT worked successfully despite of the harsh environment. Also, the prototype tests showed that the communication was stable and reliable.
The main contribution of this work is a design for wireless-based architectures for the internal condition monitoring of a large-scale WT that is based on the International Electrotechnical Commission (IEC) 61400-25-6 standard. The proposed network model consists of wireless SNs, coordinator nodes (CNs), and a front-end (FE) device. Appropriate choices for physical components, sensor types, sampling rate, and data rate have been considered in order to meet the requirements for aggregating sensing data wirelessly from a WT internal network. We conducted network modeling and simulation using OPNET Modeler.
Communication network for WT
IEC 61400-25 standard
A WF is composed of three main components: WTs, the electrical system, and the meteorological system. IEC 61400-25 is a standard for the monitoring and control of the WF. It is an extension of the IEC 61850 standard that used for communication networks in electric substations. According to the IEC 61400-25-6 16 (logical node (LN) classes and Data classes for Condition Monitoring), WT condition monitoring is defined as the process of observing WT components or structures for a period of time to detect early signs of failures. There are different elements of WT condition monitoring involving vibration, oil debris, temperature, strain gauges, and acoustics. Figure 1 shows the scope of the IEC 61400-25-6 standard, which consists of two main parts: local condition monitoring and central condition monitoring. The local condition monitoring part is located in the WT, while central condition monitoring part is in the control center.

Condition monitoring and control of WTs based on IEC 61400-25-6.
Conventional condition monitoring system of WT
The conventional local CMS inside a WT consists of SNs, a data acquisition unit, and a local computer. There are many SNs placed at different parts to measure the critical parameters such as temperature, vibration, wind speed, and wind direction. The SNs periodically generate monitoring data that are forwarded from data acquisition units to the wind turbine controller (WTC) for temporary storage. The CMS is located in the turbine nacelle and connected to the main WTC. The WTC is able to manage a variety of open and proprietary communication protocols such as Fieldbus and industrial Ethernet. In addition, the WTC exchanges control information for pitch control to change the blade angle and the yaw drivers based on wind direction and speed. Figure 2 shows the conventional wired-based communication network architecture for the CMS inside a WT. The WTC is located at the base of the tower, which is connected to an Ethernet switch for WF networking. Furthermore, it exchanges data between the WT and the control center. 17
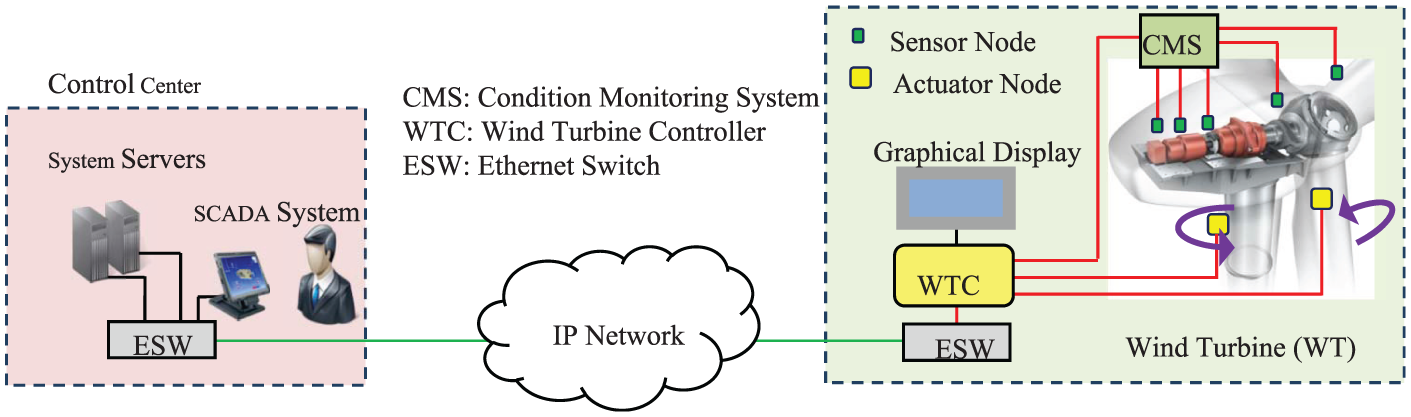
Conventional wired-based communication network architecture for CMS inside WT.
We consider the IEC 61400-25 standard to define the WT LNs including WROT, WTEM, WGEN, WTRF, WNAC, WYAW, WTOW, and WMET, as given in Table 1. The SNs of a WT could be classified into different categories such as mechanical measurements (rotor speed, pitch angle, oil level, temperature, displacement, vibration, and torque); electrical measurements (voltage, current, power, power factor (PF), and frequency); meteorological data (wind speed, wind direction, temperature, humidity, and pressure); and status information. Table 2 shows the detailed types of data and attributes of the rotor. In this work, we define the sensor types and number of SNs for the WT based on the IEC 61400-25-2 standard.
Logical nodes of a wind turbine.
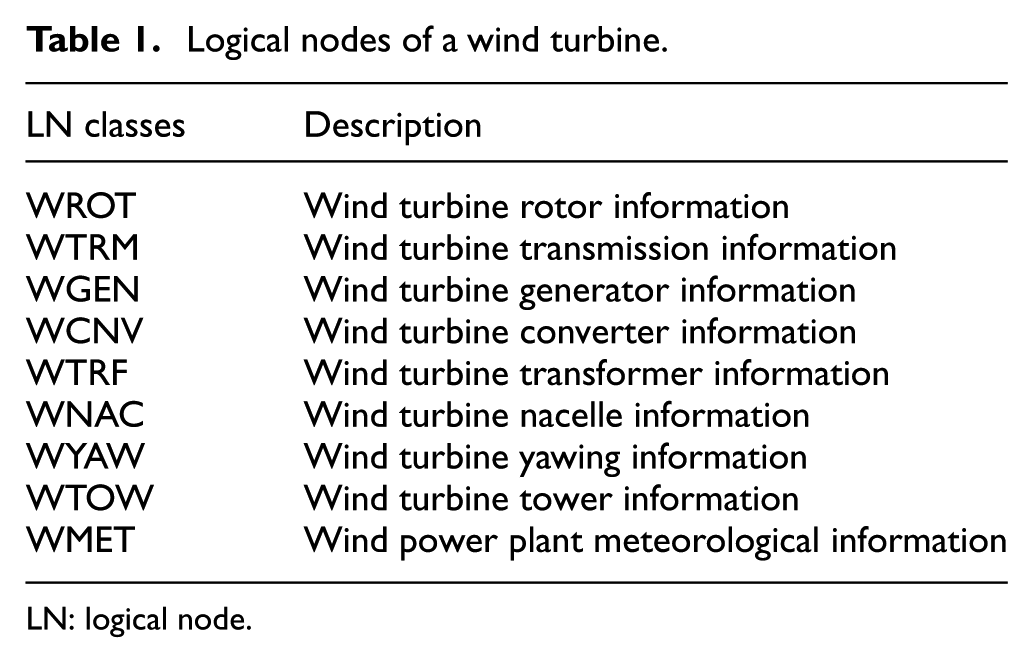
LN: logical node.
Types of data and attributes of the rotor (WROT).

Proposed wireless-based architectures for WT
Wireless network architecture
The proposed wireless-based architecture for WF consists of two levels: WT internal network and WF external network, as shown in Figure 3. There are three main parts of a WT: nacelle, tower, and foundation. The CMS is located in the WT nacelle for collecting sensing data from different parts. The WT internal network consists of many SNs. The SNs are connected to different WT parts such as the gearbox, generator, and transformer. The internal network covers a small network size, where the main function of this level is local monitoring inside the WT. A wireless FE device is located in the nacelle for collecting and processing the WT monitoring data. Furthermore, it communicates with the control center through a wireless external network. The WT internal network could be implemented using conventional wired technology (Ethernet) or wireless technology (Wi-Fi, ZigBee, and Bluetooth).

Proposed wireless-based communication network architecture for WF.
The main function of WF external network level is remote monitoring of the WF. It enables the control center to exchange monitoring data and control information remotely with WTs. The WF external network requires longer range communication between WTs and the control center, compared to the distances over which the internal network operates. The function of the control center is to store monitoring data which are categorized and stored in servers. In the proposed wireless-based solution, a base station is located at the control center. The base station enables the exchange of uplink monitoring data (from WTs to the control center) and downlink control data (from the control center to WTs). There are two types of data transmission for the WF external network, namely, direct transmission (single hop) and multi-hop transmission (multiple hops). In direct transmission configuration, WTs transmit data directly to the base station of the control center (point-to-multipoint topology). This configuration is suitable for WFs with a small number of WTs. However, with a large number of WTs, the link between WTs and the base station may become congested. In the multi-hop transmission configuration, WTs transmit data to the base station of the control center using multiple hops. In uplink and downlink, intermediate nodes called relay nodes are operated as aggregators and relays, which are used to connect WTs and the control center. The multi-hop transmission reduces the number of direct links from WTs to the base station and provides additional coverage compared to a single-hop transmission. 10
Network model and data aggregation approach
Figure 4 shows a schematic diagram illustrating a WT as a cyber-physical system. It consists of two parts: the physical level and the network level. Based on the IEC 61400-25-6 standard, the WT physical level consists of nine LNs: rotor (WROT), transmission (WTRM), generator (WGEN), converter (WCNV), transformer (WTRF), nacelle (WNAC), yaw (WYAW), tower (WTOW), and meteorological (WMET), as shown in equation (1)


Schematic diagram illustrating WT as a cyber-physical system.
The network level comprises three different types of nodes: SNs, CNs, and an FE device. The main function of SN is sensing, while the function of CN is data aggregation from wireless SNs through single hop or multi-hops. The FE device aggregates data from CNs. Also, it communicates with the control center through a wireless external network. Each WT part is considered to be represented by an LN, as shown in Figure 4, whose nodes involve different types of SNs.
An SN SN i can be identified by the physical location (LN), sensor type (ST), and sensor identifier (SID) using equation (2)

There are several types of SNs inside WT such as temperature (Tmp), speed (Spd), pressure (Pres), torque (Torq), voltage (V), current (A), and PF. The types of sensors ST(SN i ) can be defined as in equation (3)

In order to identify SN i , each sensor has a unique identifier (SID), where T is the total number of sensors, as given in equation (4)

We define the sampling rate and number of channels in order to calculate the data size generated from each SN. The sample size is assumed 2 bytes (16 bits) based on Wijetunge et al. 18 Data rate of the application layer can be calculated according to equation (5)

where Nc and fs represent the number of channels and sampling frequency, respectively.
We considered different configurations for aggregating sensing data wirelessly from the WT internal network. The four approaches for data aggregations inside the WT are those based on the physical components, the sensor types, the sampling frequency, and the data rate. Data aggregation aims to collect and forward sensing data from different SNs toward the FE device. The physical SNs are installed inside the WT. We used the concept of virtual nodes (VNs) to organize the physical SNs into multiple groups, as shown in Figure 5.

Mapping of physical sensor devices to the logical network counterpart.
Case 1: data aggregation based on physical components
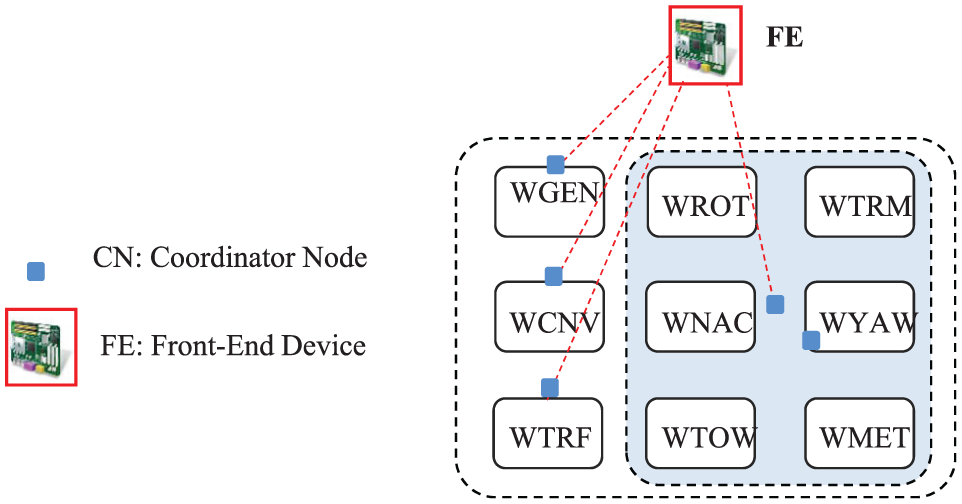
There are nine LNs representing nine parts of the WT based on the IEC 61400-25-6 standard. Each LN consists of one CN and many SNs. There is a direct communication between the SNs and the CN for collecting sensing data. In addition, there is a direct communication between the nine CNs and the FE unit, as shown in Figure 6.

Data aggregation based on the physical components.
Case 2: data aggregation based on data rate
A WT consists of three LNs and one VN. The three LNs represent heavy data traffic inside WT, which are WGEN, WCNV, and WTRF. The VN represents the aggregation among six LNs with light data traffic, which are WROT, WTRM, WNAC, WYAW, WTOW, and WMET. Figure 7 shows the data aggregation based on the data rate, where there is a direct communication between the four CNs and the FE unit.
Data aggregation based on the data rate.
Case 3: data aggregation based on sampling rate
The measurements are classified based on the sampling rate into eight VNs as follows: 1 Hz (temperature, power factor, humidity, oil level, and status); 3 Hz (speed, pitch angle, wind direction, and wind speed); 5 Hz (power); 10 Hz (displacement and frequency); 50 Hz (torque); 100 Hz (pressure); 200 Hz (vibration); and 2048 Hz (voltage and current). Also, there is a direct communication between the eight VNs and the FE unit, as shown in Figure 8.

Data aggregation based on the sampling frequency.
Case 4: data aggregation based on sensor type
There are different types and number of SNs. The measurements are classified based on sensor types into 17 VNs as follows: temperature (16 SNs), speed (3 SNs), pressure (7 SNs), wind direction (3 SNs), wind speed (3 SNs), pitch angle (6 SNs), vibration (2 SNs), voltage (12 SNs), power (2 SNs), power factor (2 SNs), current (6 SNs), oil level (4 SNs), frequency (1 SN), displacement (2 SNs), torque (1 SN), humidity (3 SNs), and status information (29 SNs). In this case, there is a direct communication between the 17 VNs and the FE unit, as shown in Figure 9. Table 3 compares different data aggregation approaches for the WT internal network, and Table 4 shows the measurement requirements for different SNs inside the WT.
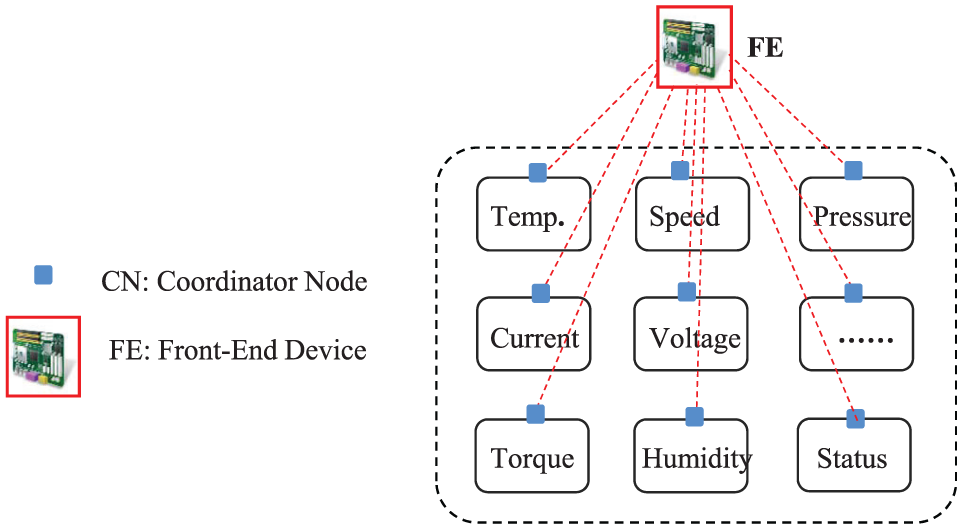
Data aggregation based on the sensor type.
Different configurations of data aggregation for WT internal network.

WT: wind turbine; LN: logical node; VN: virtual node; SN: sensor node; CN: coordinator node.
Measurement requirement for sensor data in WT.

WT: wind turbine; SNs: sensor nodes.
From the practical point of view, data aggregation could be implemented by different wired/wireless technologies. Wired connections can be used to collect measurements from SNs and transmit the data to the FE unit. Also, wireless technology can be used to collect measurements from SNs using a wireless access point (AP). Given wired-based solution as an example, Ferguson et al. 5 carried out the design of a data acquisition and CMS for a WT internal network where wired connections have been used to connect between different sensor types and the data acquisition unit. The parameters were divided into two groups based on the sampling rate: low speed (50 Hz) and high speed (20 kHz). The same concept has been used in Case 3 of our work for data aggregation based on the sampling rate.
Network modeling and simulation
Assumptions
A set of real WT dimensions was used to build our network model. The dimensions are related to an offshore WT (HQ 5500) prototype that was installed on Jeju Island (South Korea) in February 2014. The WT capacity is 5.5 MW, which is the biggest turbine size installed in South Korea. The hub height is 100 m and the rotor diameter is 140 m. The network configuration in OPNET considers a field of 200 m × 200 m. The tower height is 100 m, the nacelle dimension is 12 m × 4 m, and the rotor diameter is 140 m. 19 Simulation assumptions are given in Table 5.
Simulation assumption.

IEC technical committee (TC 88) has published the standard IEC 61400-25, which comprises six parts. Part 4 (IEC 61400-25-4) presents the conceptual architecture of multiple mapping for the communication profile, as shown in Figure 10. Both physical and link layers are out the scope of the standard. The Transmission Control Protocol/Internet Protocol (TCP/IP) is the basic protocol supported by all mapping profiles. 20 Different communication network technologies (wired/wireless) could be considered. The focus of this research work is on IEEE 802.11 (Wi-Fi) using the OPNET simulation.

Illustration of protocol stack: (a) communication profiles based on IEC 61400-25-4 and (b) protocol stack of FTP.
A WT is an autonomous system which can continue to work even if the communication link between the WT and the control center is not available. As explained in section “Communication network for WT,” each WT is equipped with a WTC that handles and stores data from SNs. Data packets are received at the WTC at different time intervals such as 100 ms, 1 s, and 10 s. The WTC processes the sensing data for internal control purposes and provides the data to the SCADA system. The measurements are cached and transmitted in bulk with a different frequency. The updated rate is at least once per second, and the maximum transfer rate is based on channel capacity and network technology.21,22
The IEC 61400-25 standard does not provide any specific communication timing requirements for WT communication network. In this work, we considered the communication timing requirements for electric substation automation based on IEEE 1646 standard, as shown in Table 6. 23 The focus of this work is the WT internal network (between SNs and the WTC). The WF external network (the connection between the WT and the control center) is out of scope of this work.
Communication timing requirements for different applications based on IEEE 1646 standard.

Figure 11 shows the internal structure of a wireless SN (wlan_wkstn_adv) used for Wi-Fi-based architectures. The application layer is concerned with SNs’ information such as message type, message size, and data interval. The File Transfer Protocol (FTP) is selected to transfer the data between SNs and the FE unit.

OPNET model of a sensor node based on Wi-Fi.
Wi-Fi-based internal network for WT
Figure 12 shows the Wi-Fi-based architecture of the WT internal network using 102 SNs. Four different scenarios are configured for data aggregation. In OPNET, the network model is implemented using wireless workstations (wlan_wkstn_adv) and APs (wlan_ethernet_slip4_adv). Figure 13 shows the network configuration of Wi-Fi-based architecture for Case (1). The communication network is configured in an infrastructure mode which consists of nine basic service sets (BSSs). The FE unit is connected to nine APs using wired links (Fast Ethernet). The following metrics have been considered for the performance evaluation:
Server FTP Traffic received (bytes/s) represents the average bytes per second forwarded to all FTP applications by the transport layers in the server node.
End-to-end (ETE) delay is the amount of time (in seconds) for data to be delivered from source (SNs) to the destination (FE device) along the communication path.
Wireless local area network (LAN) delay (s) represents the ETE delay of all the packets received by the wireless LAN MACs of all WLAN nodes in the network and forwarded to the higher layer. This delay includes medium access delay at the source MAC, reception of all the fragments individually, and transfers of the frames via AP, if AP functionality is enabled.
Wireless LAN data dropped (bits/s) represents the total size of higher layer data packets (in bits/s) dropped by all the WLAN MACs in the network.

Wi-Fi-based OPNET model of WT internal network (no aggregation—102 sensor nodes).

Wi-Fi-based OPNET model of WT internal network for Case 1: nine LNs.
Traffic received results
The data traffic for the Wi-Fi-based network architecture for Cases 1 and 2 is given as examples, as shown in Tables 7 and 8, respectively. Each SN is assigned a basic service set identifier (BSS-ID) to transmit the traffic profile to the allocated AP. Both the SN and the AP are configured with the same BSS-ID to ensure that the sensor data from different logical/VNs do not interfere with each other. The simulation results showed that the received amount of traffic at the FE unit agrees with our calculation for all cases. The received traffic from different SNs such as current, displacement, frequency, and humidity is shown in Figure 14(a). The initial peak in the curves is due to network initialization (for approximately 12 s). When the network goes into the steady state, the received traffic is stable. The total traffic is approximately 225,602 bytes/s, as shown in Figure 14(b).
Data traffic for Wi-Fi-based architecture (Case 1).

WT: wind turbine; SNs: sensor nodes; BSS-ID: basic service set identifier; LNs: logical node.
Data traffic for Wi-Fi-based architecture (Case 2).

WT: wind turbine; SNs: sensor nodes; BSS-ID: basic service set identifier; LNs: logical node; VN: virtual node.

Amount of received traffic for Wi-Fi-based architecture: (a) individual SNs in Case 1 and (b) total traffic received in Case 1.
Delay results
The performance of WT internal network (without data aggregation) is evaluated in view of ETE delay in case of direct data transmission from SNs to the FE device. The SNs are modeled by wireless workstations, and the FE device is modeled by a wireless server. Figure 15 compares the wireless ETE delay of 102 SNs using different data rates of 54, 24, and 11 Mbps. As expected, the higher the data rate, the lower the ETE delay. At 11 Mbps, the maximum ETE delay is approximately 96.151 ms, while it is approximately 40.763 ms at 54 Mbps. At 24 Mbps, the maximum and average ETE delays are 49.409 and 46.621 ms, respectively. Table 9 lists the maximum and average ETE delays for different data rates.

ETE delay of Wi-Fi-based architecture with 102 SNs (no aggregation).
ETE delay for different Wi-Fi-based architectures (no aggregation).

We configured four scenarios for different data aggregations using a data rate of 54 Mbps. The WT internal network comprises nine APs in Case 1, four APs in Case 2, eight APs in Case 3, and 17 APs in Case 4. Figure 16 shows the ETE delay for different Wi-Fi-based architectures. Case 1 achieves the lowest ETE delay compared with other scenarios. The maximum and average ETE delays of Case 1 are 14.834 and 13.694 ms, respectively. Case 3 achieves the highest ETE delay. The maximum and average ETE delays of Case 2 are 26.986 and 24.735 ms, respectively. Figure 17 shows the data dropped in bits per second for WLAN versus the simulation time. For the direct data transmission scenario, a higher data drop rate is due to buffer overflow compared to other aggregation scenarios. If large numbers of SNs are connected directly to an AP or the FE device, the problem of congestion, collisions, and buffer overflow will occur and delay will be increased. Table 10 lists the maximum and average ETE delays for different network configurations. Considering the communication timing requirements of monitoring and control given in Table 6, the network model of Case 1 satisfies the timing requirements with ETE delay of less than 16 ms. No data packets were dropped due to buffer overflow for Cases 1 and 4.

ETE delay of Wi-Fi-based architecture for Cases 1, 2, 3, and 4.
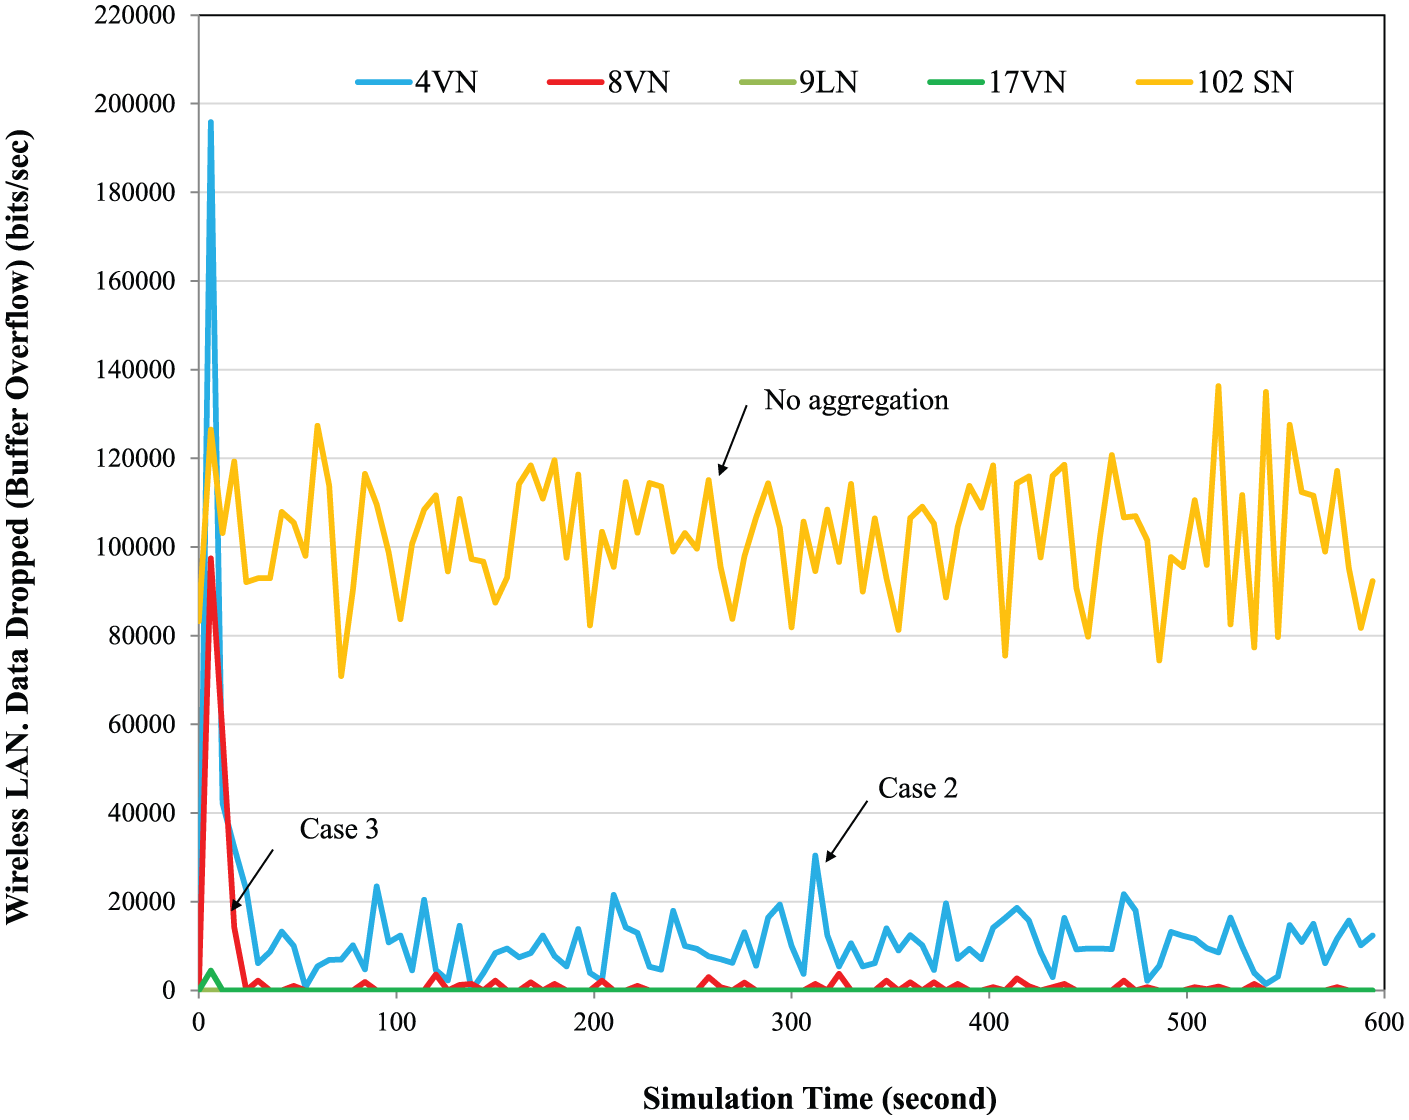
Data dropped due to buffer overflow of Wi-Fi-based architecture for Cases 1, 2, 3, and 4.
ETE delay for different Wi-Fi-based architectures (54 Mbps).
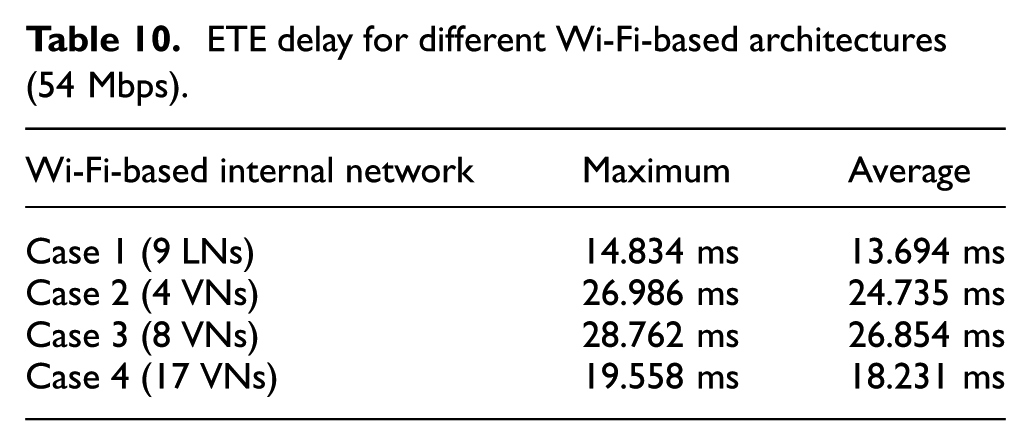
The results in Figure 17 show a high data drop rate due to buffer overflow for the direct data transmission (no aggregation scenario) compared to other aggregation scenarios. When there is a buffer overflow, we would expect to see latency increase. In Cases 1 and 4, no data packets were dropped due to buffer overflow. This can be confirmed by comparing the simulation results of Figure 17 with the ETE latencies in Figure 16. Cases 2 and 3 have more data dropped due to buffer overflow which results in a high ETE delay.
Conclusion
In this article, we investigated the design, simulation, and evaluation of different data aggregation approaches of wireless-based architectures for a WT internal network. The proposed wireless network consists of SNs, CNs, and an FE device. Wi-Fi is a promising technology considered in this work. The maximum ETE delay was approximately 96.151 ms for a data rate of 11 Mbps and approximately 40.763 ms for a data rate of 54 Mbps. Four approaches have been considered for data aggregation inside the WT based on physical components, sensor types, sampling rate, and data rate. Case 1 achieves the lowest ETE delay compared with other data aggregation approaches. The maximum and average ETE delays of Case 1 are 14.834 and 13.694 ms, respectively. A significant reduction in ETE delay has been achieved using data aggregation approaches compared with direct wireless data transmission.
Footnotes
Academic Editor: Jose Ignacio Moreno
Declaration of conflicting interests
The author(s) declared no potential conflicts of interest with respect to the research, authorship, and/or publication of this article.
Funding
The author(s) disclosed receipt of the following financial support for the research, authorship, and/or publication of this article: This work was supported by the Brain Korea 21 PLUS and the National Research Foundation of Korea (NRF) grant funded by the Korea government (2010-0028509, 2014-055177). This research was also supported by “Research Base Construction Fund Support Program” funded by Chonbuk National University in 2016.