
Abstract
Due to global warming, governments around the world are focusing on renewable energy as the main source of energy. Gulf countries in particular, are focusing on solar energy due to its abundance and the gulf geolocation that allows the installation of ambitious solar photovoltaic (PV) energy systems and replace conventional power plants. In order to maximize energy extraction from the sun, solar power operators need to constantly monitor key solar PV parameters such as panel temperature, solar irradiation, voltage and current in order to detect abnormalities in the PV system operation and take the necessary actions to keep the PV system performance at its maximum. However, monitoring such parameters on-site is exhausting and expensive. Moreover, remote monitoring for solar PV systems is a more attractive solution once the data collection, processing and transmission become faster and less expensive. This paper describes the design of a low-cost remote monitoring system intended for off-grid solar PV systems. The designed remote monitoring system uses a combination of an Arduino Uno Wi-Fi demilitarized zone (DMZ) communication system with router-configured network sensors calibrated to fulfill the IEC-61,724 standards and it provides meteorological and electrical measurements with an error of 2% or less. There are four primary features of the proposed monitoring system. First, it combines the Arduino Uno Wi-Fi with a DMZ configuration in the router. Second, it complies with the minimum current, voltage, power, and PV-module temperature values set by the IEC-61,724 in such a way that the average error does not exceed the 4% threshold. Third, it provides an accuracy level of 98% for the meteorological and electrical parameters. This level of accuracy exceeds that of commercial data logging equipment. Finally, its total cost is less than $100, which is less than that of available commercial solar PV monitoring systems. Additional features include the ability to select the number of processed measurements per hour and innovative processing, display, and access schemes. These features enable the accessibility of the data from mobile phones and computers within the campus for teaching and experimentation purposes.
Keywords
Introduction
In the harsh weather conditions of Saudi Arabia, solar panel component failures can reduce the reliability and energy production of solar photovoltaic (PV) systems, thus increasing maintenance and repair costs. Hence, effective condition monitoring with data archiving and analysis is crucial for maintaining the effective operations and high-energy production of future PV monitoring systems.
Meanwhile, Solar cells equipped with batteries and power management systems were used to provide electricity for disaster monitoring systems, for structure health monitoring, for aquaculture monitoring and underground mining area monitoring. 1 Such systems were placed in remote and inaccessible areas and therefore monitoring such solar cells and batteries becomes important to ensure the continuous power supply to the monitoring systems.
With the increasing adoption of PV systems for grid-connected and off-grid applications in Saudi Arabia, solar PV owners and operators should equip their facilities with remote monitoring systems. This becomes of paramount importance if the facilities are geographically widespread and in remote areas such as deserts and mountainous areas. However, a thorough search for dedicated monitoring systems for solar PV installations in Saudi Arabia indicates that such monitoring systems exist at the time being only for wind and solar resource assessment in select Saudi universities and renewable energy research institutions. These systems are equipped with a range of sensors to measure radiation, wind speed and direction, humidity, rainfall, shadowing, and other relevant indices. For instance, the 10-Megawatt solar PV facilities owned by ARAMCO and the Saudi Electric Company 2 are well equipped for energy management and monitoring.
Furthermore, KSA has ambitious solar energy projects of 20 MW and 40 MW in 2023 and 2030, respectively, and anticipates that control, communication, and monitoring technologies affect the full operation of these megawatt projects. 3
In Ref. 4, the authors built a cost-effective data acquisition system to collect operational PV system information. The main feature is that the system estimates solar irradiance by directly measuring the PV panel’s short circuit current, thereby eliminating the use of expensive tools. Furthermore, LabVIEW software processes and stores the key parameters, including voltage, current, and ambient and module temperatures on a dedicated computer. Meanwhile, Ref. [5] pioneered the development of an unprecedented scheme for the on-site measurement of PV monitoring systems. The developed system permits the collection, presentation, and analysis of operational information. A new data logger in Ref. [6] has been designed for remote areas in developing countries using the Arduino open-source electronic platform. Along similar lines, Ref. 7 designed a system for data monitoring and indirect PV system control using the LabVIEW graphical user interface facility based on the IBM PC compatible Windows 2000 environment and the TCP/IP protocol-based add-on card. The limitations of such a monitoring system include personnel expenses, location restrictions, and used in unmanned plant generation systems.
Arduino-based low-cost open-source instruments including wireless ZigBee connectivity have been proposed by Ref. [8] in a system in which the DHT22 is used for temperature and humidity monitoring via direct support provided by the Arduino IDE technology. The real-time monitoring of PV parameters can only be accomplished using a few XBees, a commonly recognized power supply, and passive electronic components are presented in the work of Ref. [9]. These data are used as a reference to assess the PV system’s efficiency and energy-saving capabilities. Along similar lines, Ref. [10] initiated the application of the Reliance SCADA and the Arduino Uno on a small solar PV system to monitor voltage, battery status, and efficiency. The system was built by employing low-cost sensors including an Arduino Uno-based microcontroller and software provided by Reliance SCADA. The microcontroller gathers sensor information and connects with a laptop via a USB cable. Furthermore, the Modbus library is uploaded to Arduino to communicate between the Arduino and the SCADA system via the Modbus RTU protocol. On the other hand, an Internet PV surveillance system has been proposed by Ref. [11]. In this system, the ZigBee system integrates the surveillance scheme. Parameters such as irradiation, temperature, PV output, and grid inverter output are tracked online for short-term and long-term performance analysis. The ZigBee-based system was tested on a small-scale grid-connected PV system of 1250 Wp. The results proved that the developed monitoring system performed as expected. Another alternative is proposed to monitor the PV panel using a global system for mobile (GSM) technology. 12 The monitoring system PLC. modules evaluate the individual voltage and power for each PV panel in this system. With the aid of GSM technology, operators can view the status of each PV panel via mobile phones. If any abnormal operation condition arises in any panel, the operator will receive a message with the relevant data.
Internet Of Things (IoT) has been used in renewable energy systems monitoring and control. In one, 13 the main criteria are switching between two energy sources without interruption through a website using the ESP8266 Wi-Fi module to control the energy sources. This system is cost-effective, and it enables the user to control the sources of energy manually and remotely using a smartphone or personal computer. However, no cost was given in the paper. Other studies reviewed the importance and the applications of IoT in controlling and monitoring hybrid renewable energy systems.14–16
Meanwhile, other research activities focus on modeling and improving the performance of hybrid energy systems. 17 In this study, three control algorithms were designed and compared in terms of efficient and effective energy of three different hybrid energy-generating systems. Meanwhile, the authors claim that the most effective controller method needs to be accomplished by applying advanced controllers such as Fuzzy Logic, Fuzzy Proportional, Integral, Derivative (PID), Neuro-Fuzzy, and Neuro-Fuzzy PID. instead of microprocessor-based controllers on hybrid energy generating systems.
A recent study reported in Ref. [18] indicates that research trends of solar PV monitoring systems in the last decade grew significantly. From 2010 to 2020, the number of research papers has increased from 2 to 75, respectively. In 2020, there was a substantial increase from 2017 to 2020, highlighting the importance of such monitoring systems. This study stated that the main issues and challenges of monitoring are data handling and security, signal interference—energy efficiency, and data transmission range. Such research activities include the study by Jamil et al. to design an Arduino-based performance monitoring system for land and floating solar PV plants. The central controller is an Arduino Nano which measures PV parameters, including voltage, current, and output power. 19 Vargas et al. 20 also implemented a low-cost data logger system for monitoring remote PV systems using Arduino Uno. The proposed design complies with the International Electro-Technical Commission’s criteria (IEC). The Arduino-based low-cost data logger could operate in remote regions with economical maintenance expenses. To circumvent Arduino Uno’s restrictions, the author proposed adding a 12C bus to the PCB, a Real-Time Clock (RTC), two external ADCs, SD flash memory, a visual interface, and a power consumption module to make the system IEC-compliant. The system, however, does not offer wireless monitoring of the collected data.
Based on the above discussion and to enhance the online PV monitoring systems, the present paper focuses on designing an affordable measurement system for a small-scale solar PV system with a focus on its design, implementation, and troubleshooting capabilities. The system can collect operational data such as voltages and currents, temperature (ambient and module), radiation, humidity, and power. Another important feature of the device is the ease with which the performance data can be accessed through a mobile phone and computer. Unlike conventional data acquisition systems, the designed controller code can be easily modified. The user can display the instantaneous values of the system input and output parameters using either a computer or a mobile phone. The DMZ configuration is used to limit the access to the monitored data to the network university/enterprise only, allowing therefore only valid employees to access the data while protecting it from external cyber-attacks. A small-size prototype was built and tested on campus to implement and test the proposed hardware and software configurations.
The remainder of this manuscript is arranged as follows. The next section provides an overview of a PV monitoring system. Next, A The next section detailed description of the proposed remote measurement system is presented After that, authors describe the experimental tests, analysis, and discussion. Finally, the last section includes the conclusions, design limitations, and recommendations.
Overview of photovoltaic monitoring systems
In present-day PV monitoring systems, the four main subsystems shown in Figure 1 require careful integration. The first subsystem is the sensor network. A wide range of sensors exists that can measure various variables in real-time. The second subsystem is the signal-conditioning unit. This unit performs signal amplification and sensor measurement filtering for further processing. The third subsystem transmits the outputs of the signal-conditioning unit to the fourth subsystem, which is the data storage and display device. This device is either a personal computer or a mobile device used for the real-time display of the processed data based on the operator’s internal analysis and external commands. General block diagram of a photovoltaic monitoring system.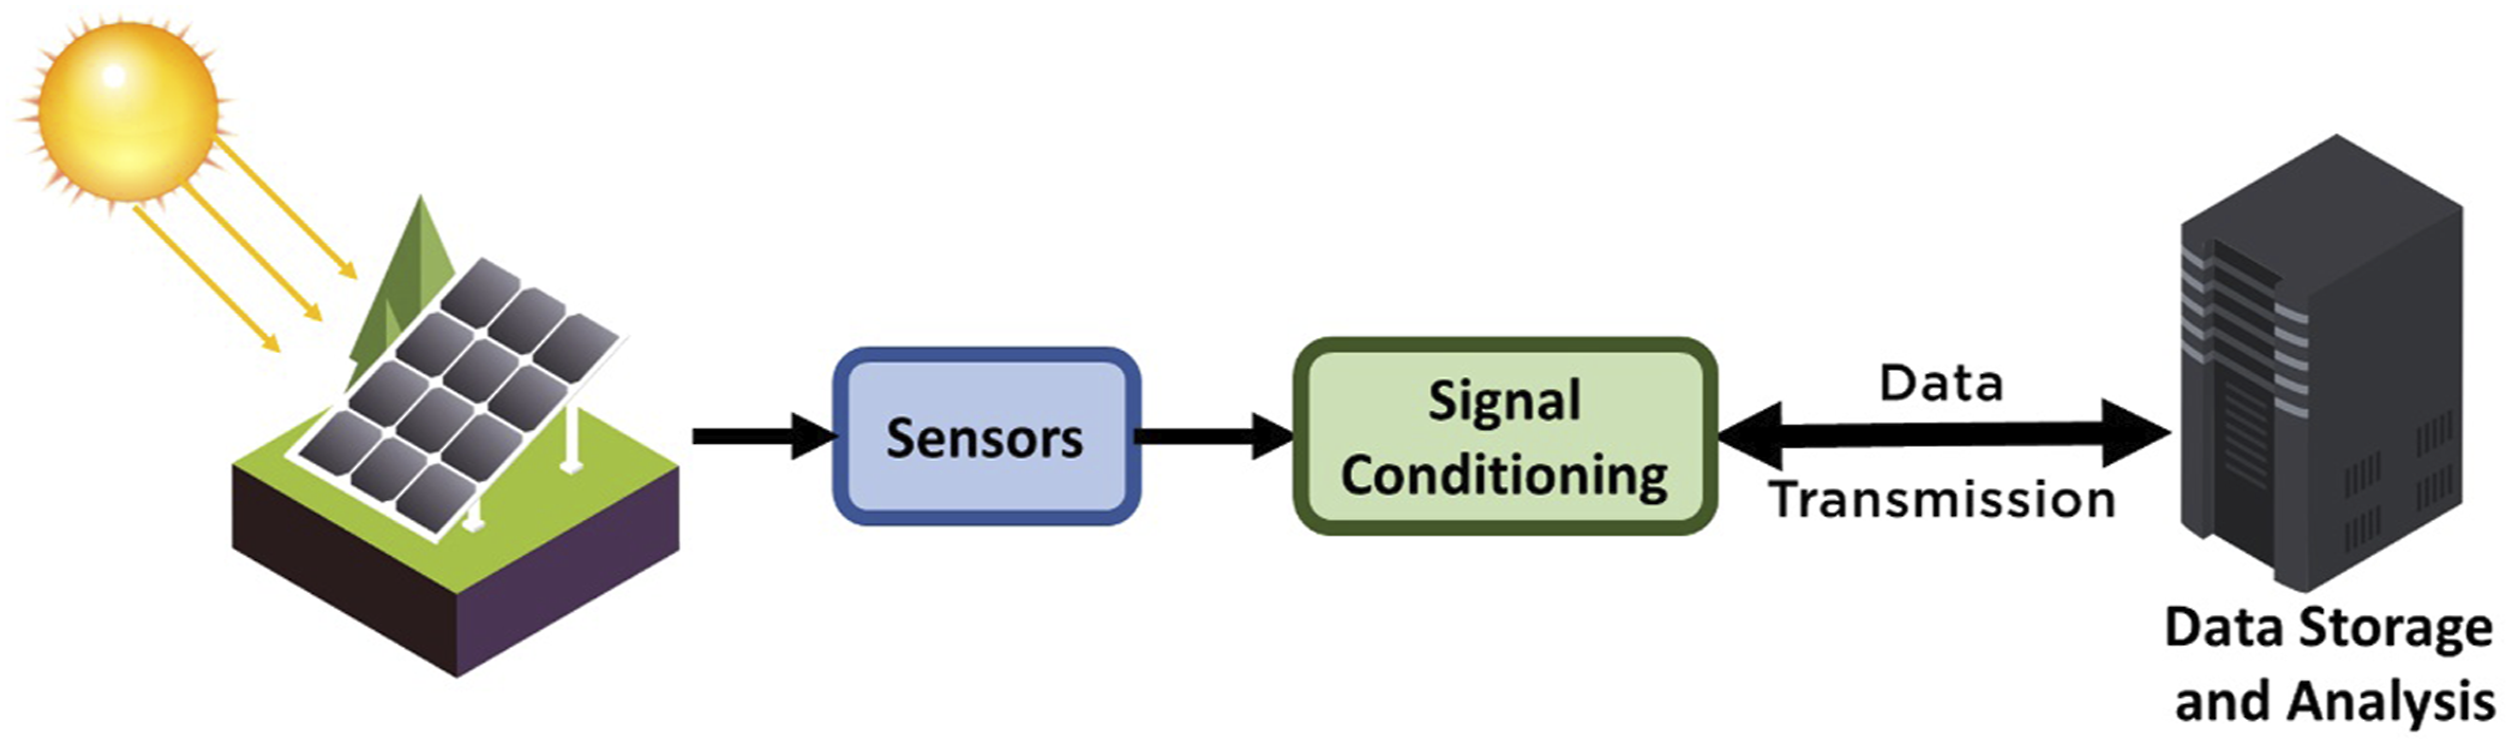
According to the IEC-61,724,
21
six groups of parameters need to be monitored for both on-grid and off-grid solar PV systems. a. Group 1 – Meteorology: This group includes total irradiance, ambient temperature, airspeed, and direction. b. Group 2 – PV Arrays: This group includes the output voltage, the output current, the output power, and the module temperature. c. Group 3 - Energy Storage: This group includes the operating voltage, the storage current, and the discharging current. d. Group 4 – Load: This group includes load voltage, current, and power. e. Group 5 – Utility Grid: This group includes utility voltage, current, and current from the grid. f. Group 6 – Supporting Supply: This group includes output voltage, current, and power.
Description of the proposed remote measurement system
Monitoring system structure
The proposed Arduino-based remote measurement structure for a single-phase off-grid system is shown in Figure 2; it consists of four main elements. These elements include the Arduino Mega microcontroller board, the Arduino Uno Wi-Fi board, the sensors, and the display. Hardware design of the monitoring system.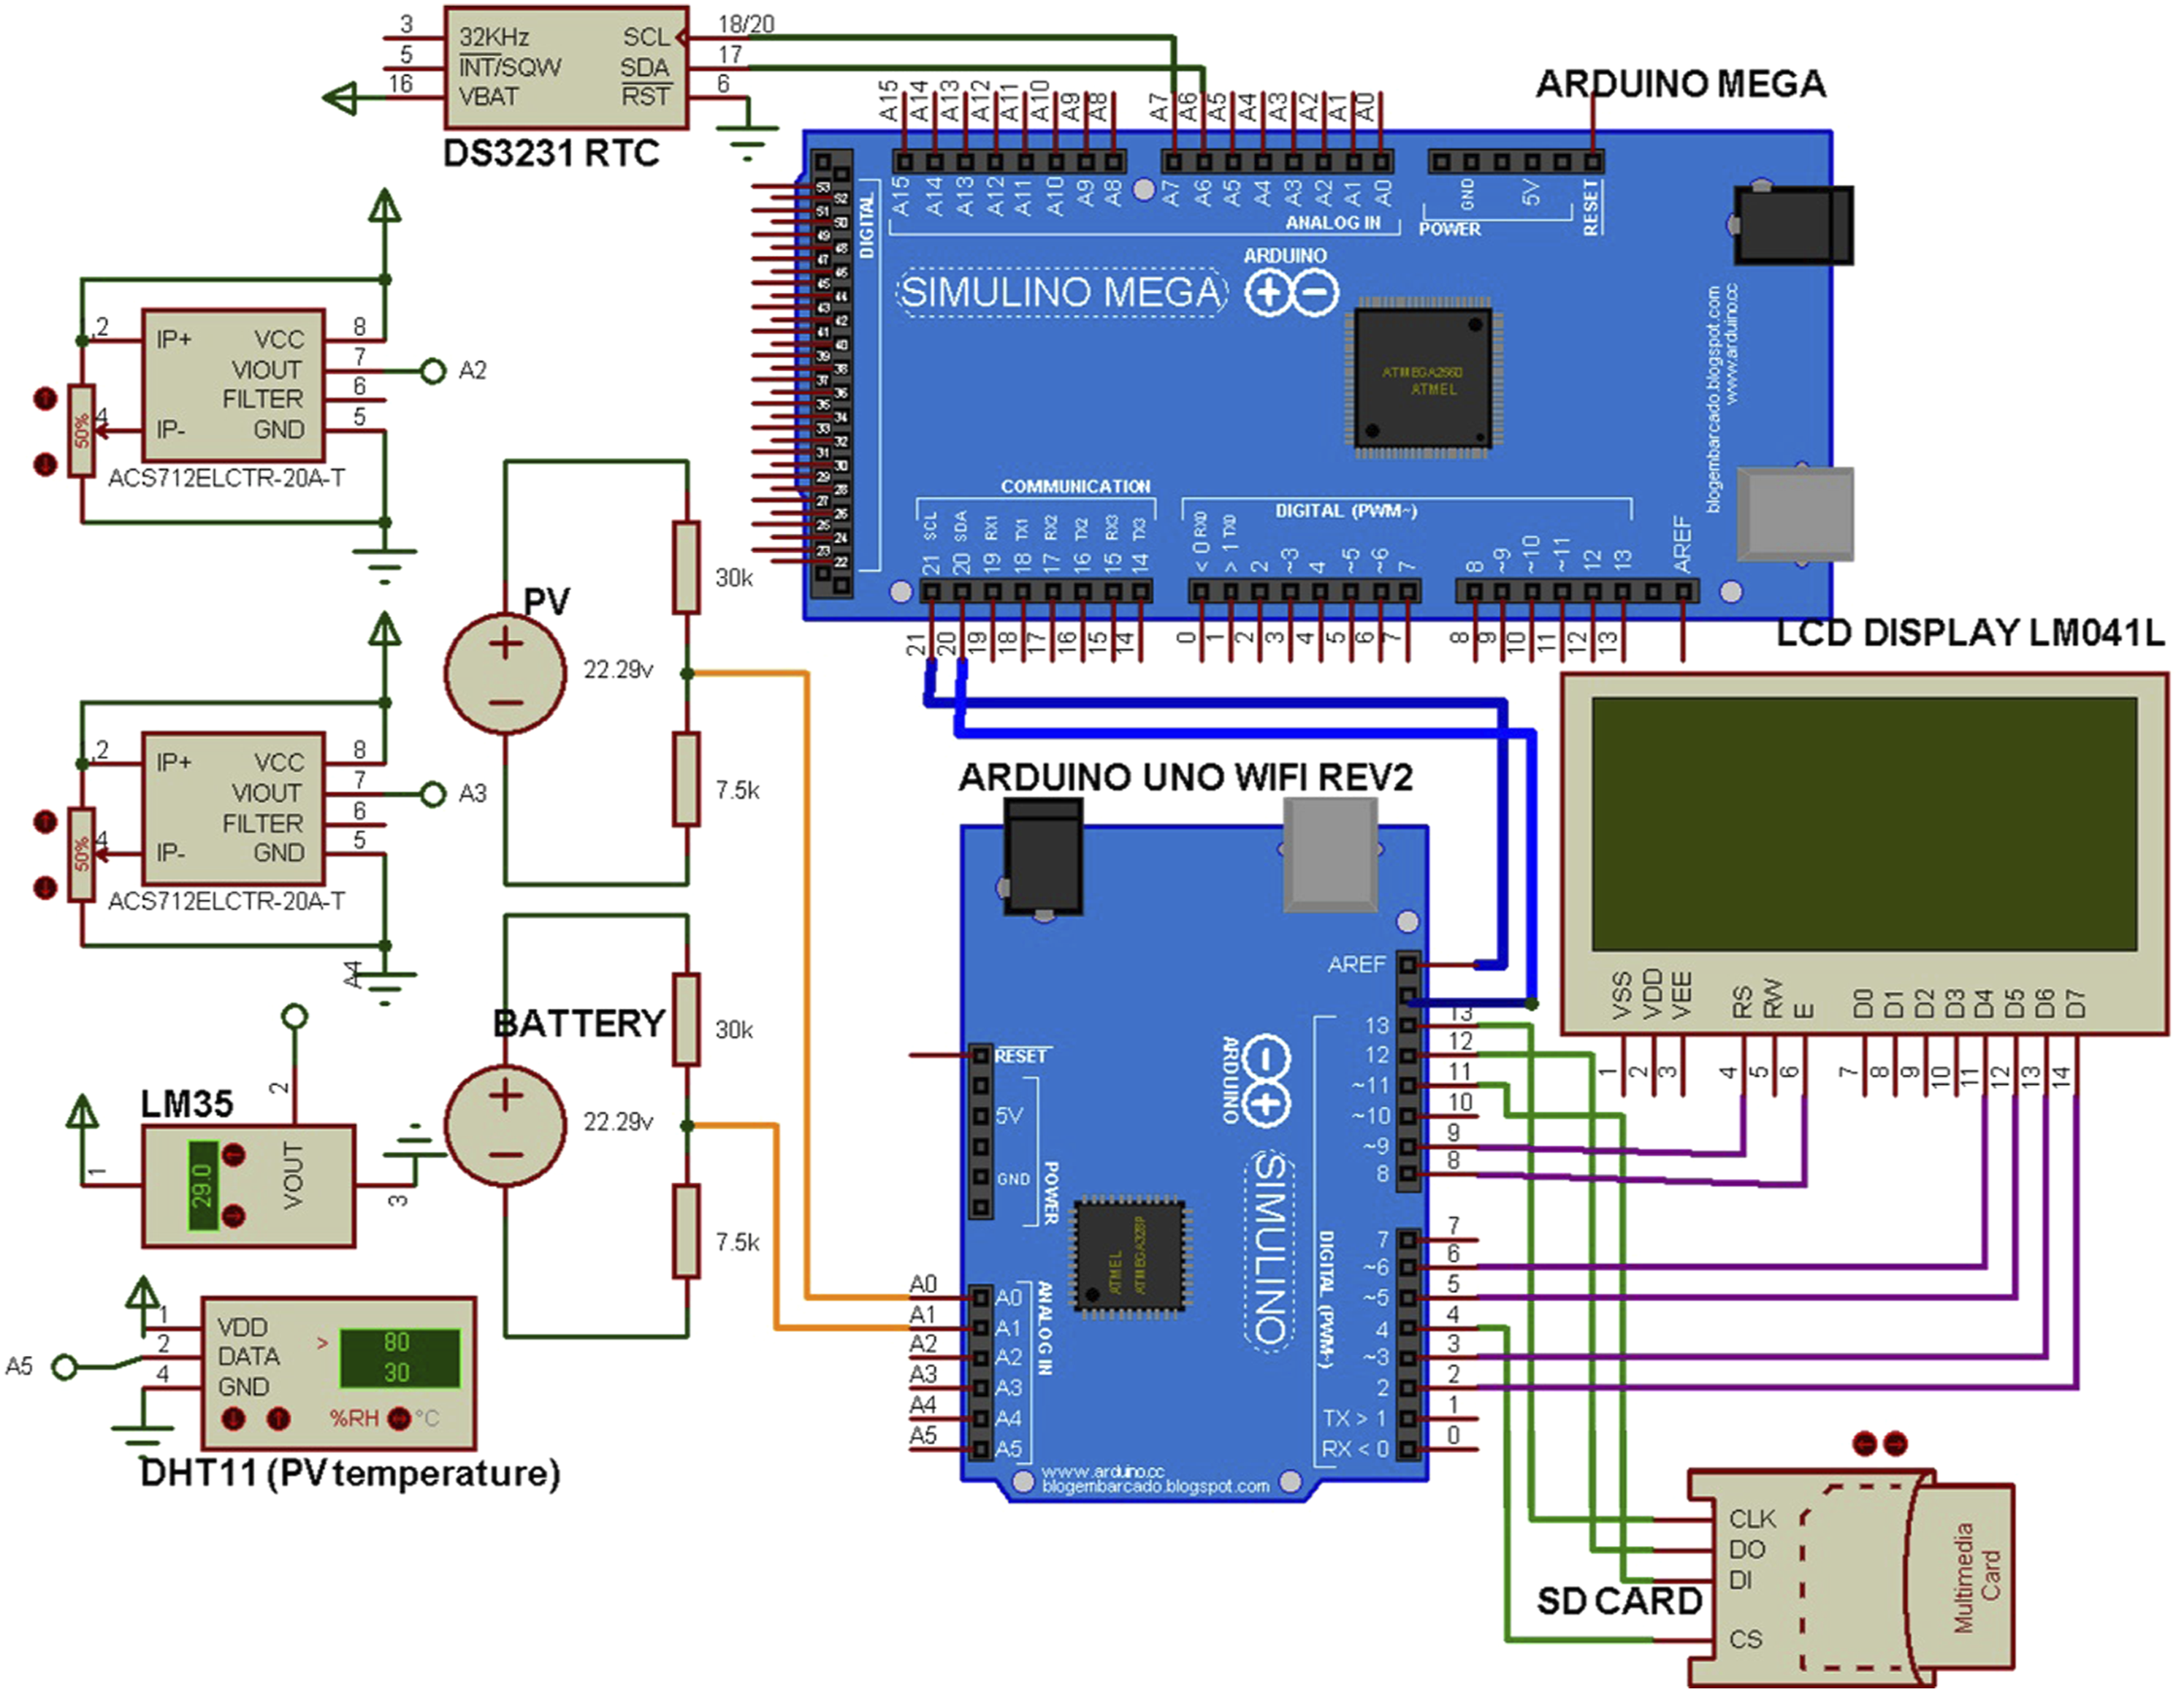
As per design requirements, the monitoring system reads the PV voltage and current to calculate the power. It also measures the solar panel temperature as well as the ambient temperature and humidity. Figure 3 displays the monitoring operation flowchart. As the battery is being charged, the monitoring system measures the battery voltage as well as the current and compute power. The monitored and computed data are stored as a CSV file on the SD card at a time interval specified by the operator. In this case, the data logging frequency was set at 8 s. The RTC module tracks the measurement time and date for 24 h. A full day of data storage requires 500 KB, and a 4 GB SD card can store data for a period of up to 18 years. Operation flowchart of the photovoltaic monitoring system.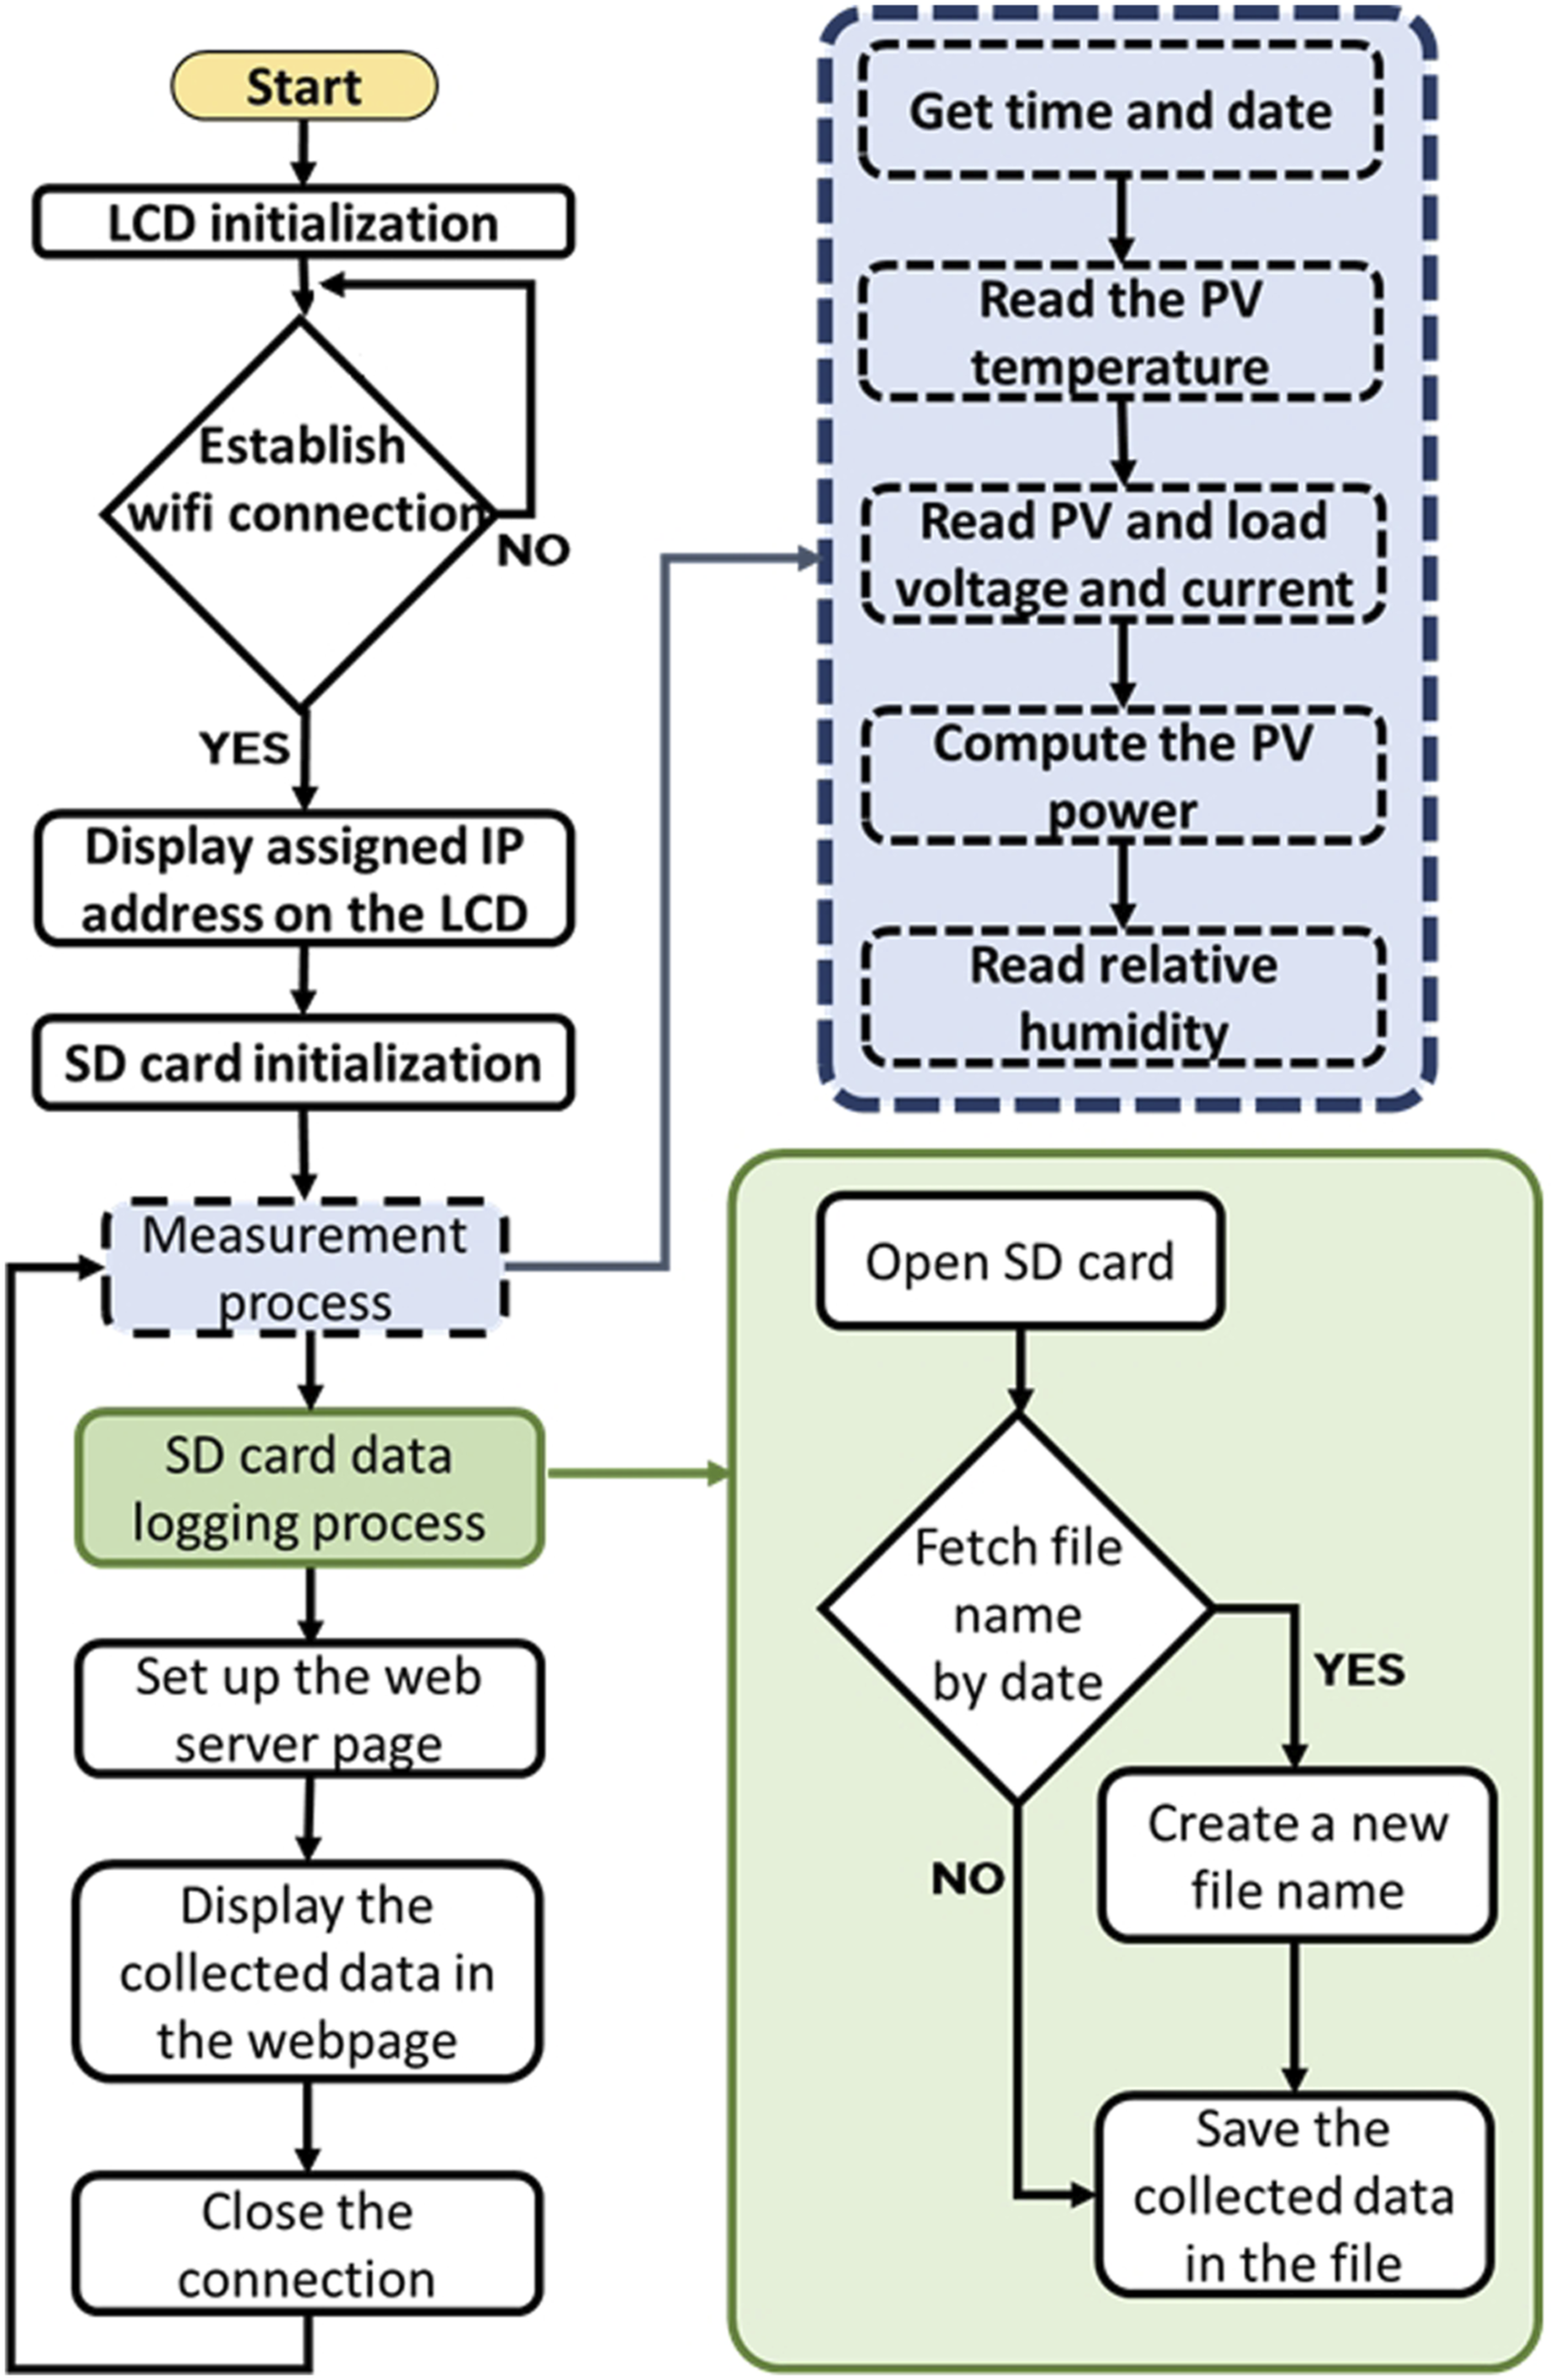
Measured data consultation
The measured data can be displayed in one of the following approaches: 1. On an LCD: The measurement values are displayed one by one. 2. Opening the CSV file stored on the SD card on-site would require the operator to be on-site and retrieve the SD and store the data on either a smartphone or a computer. During this time, the monitoring data system stops recording measurements. 3. By retrieving the real-time measurements on a web page. This can be achieved using the Arduino Uno Wi-Fi Rev2 board which has an embedded Wi-Fi chip providing a connection to wireless networks. The program will generate the HTML code corresponding to the page currently viewed with the data updating every 8 s.
Photovolataic monitoring system router-configured network
The Internet network at the university uses the WPA2-Enterprise encryption method. The Arduino Uno Wi-Fi and even existing Wi-Fi modules do not support such a protocol; it can only support the WPA2-Personal encryption method. Thus, the wireless monitoring area is limited to the area covered by that specific router, which will be of short range. Consequently, there is a need to use a dedicated router to connect the system to the wireless network regardless of whether it is Internet-enabled. To overcome this issue, the dematerialized zone (DMZ) approach was used in such a way that even if the router does not have an Internet connection, the router is recognized within that network and can be accessed from anywhere in the university as long as it is connected to the university network through an Ethernet cable. This feature would allow measurements in labs and classrooms for teaching purposes. Each Ethernet slot has a unique Internet Protocol (IP) address assigned by the university IT department, and the router IP address remains the same.
It is worth mentioning that the DMZ allows for the router’s incoming connections to be forwarded to an IP address, providing the external users with access to the device connected to that address. This is possible given that once the Arduino Uno Wi-Fi module connects to the router, an IP address is assigned to it. Further testing revealed that the Arduino board remembers the latest assigned IP address and uses it automatically for the next connection if another process is not using this IP address. This will not be the case since the router was used solely for this project. Figure 4 explains the network architecture and data access using the university system. Photovoltaic monitoring system router-configured network.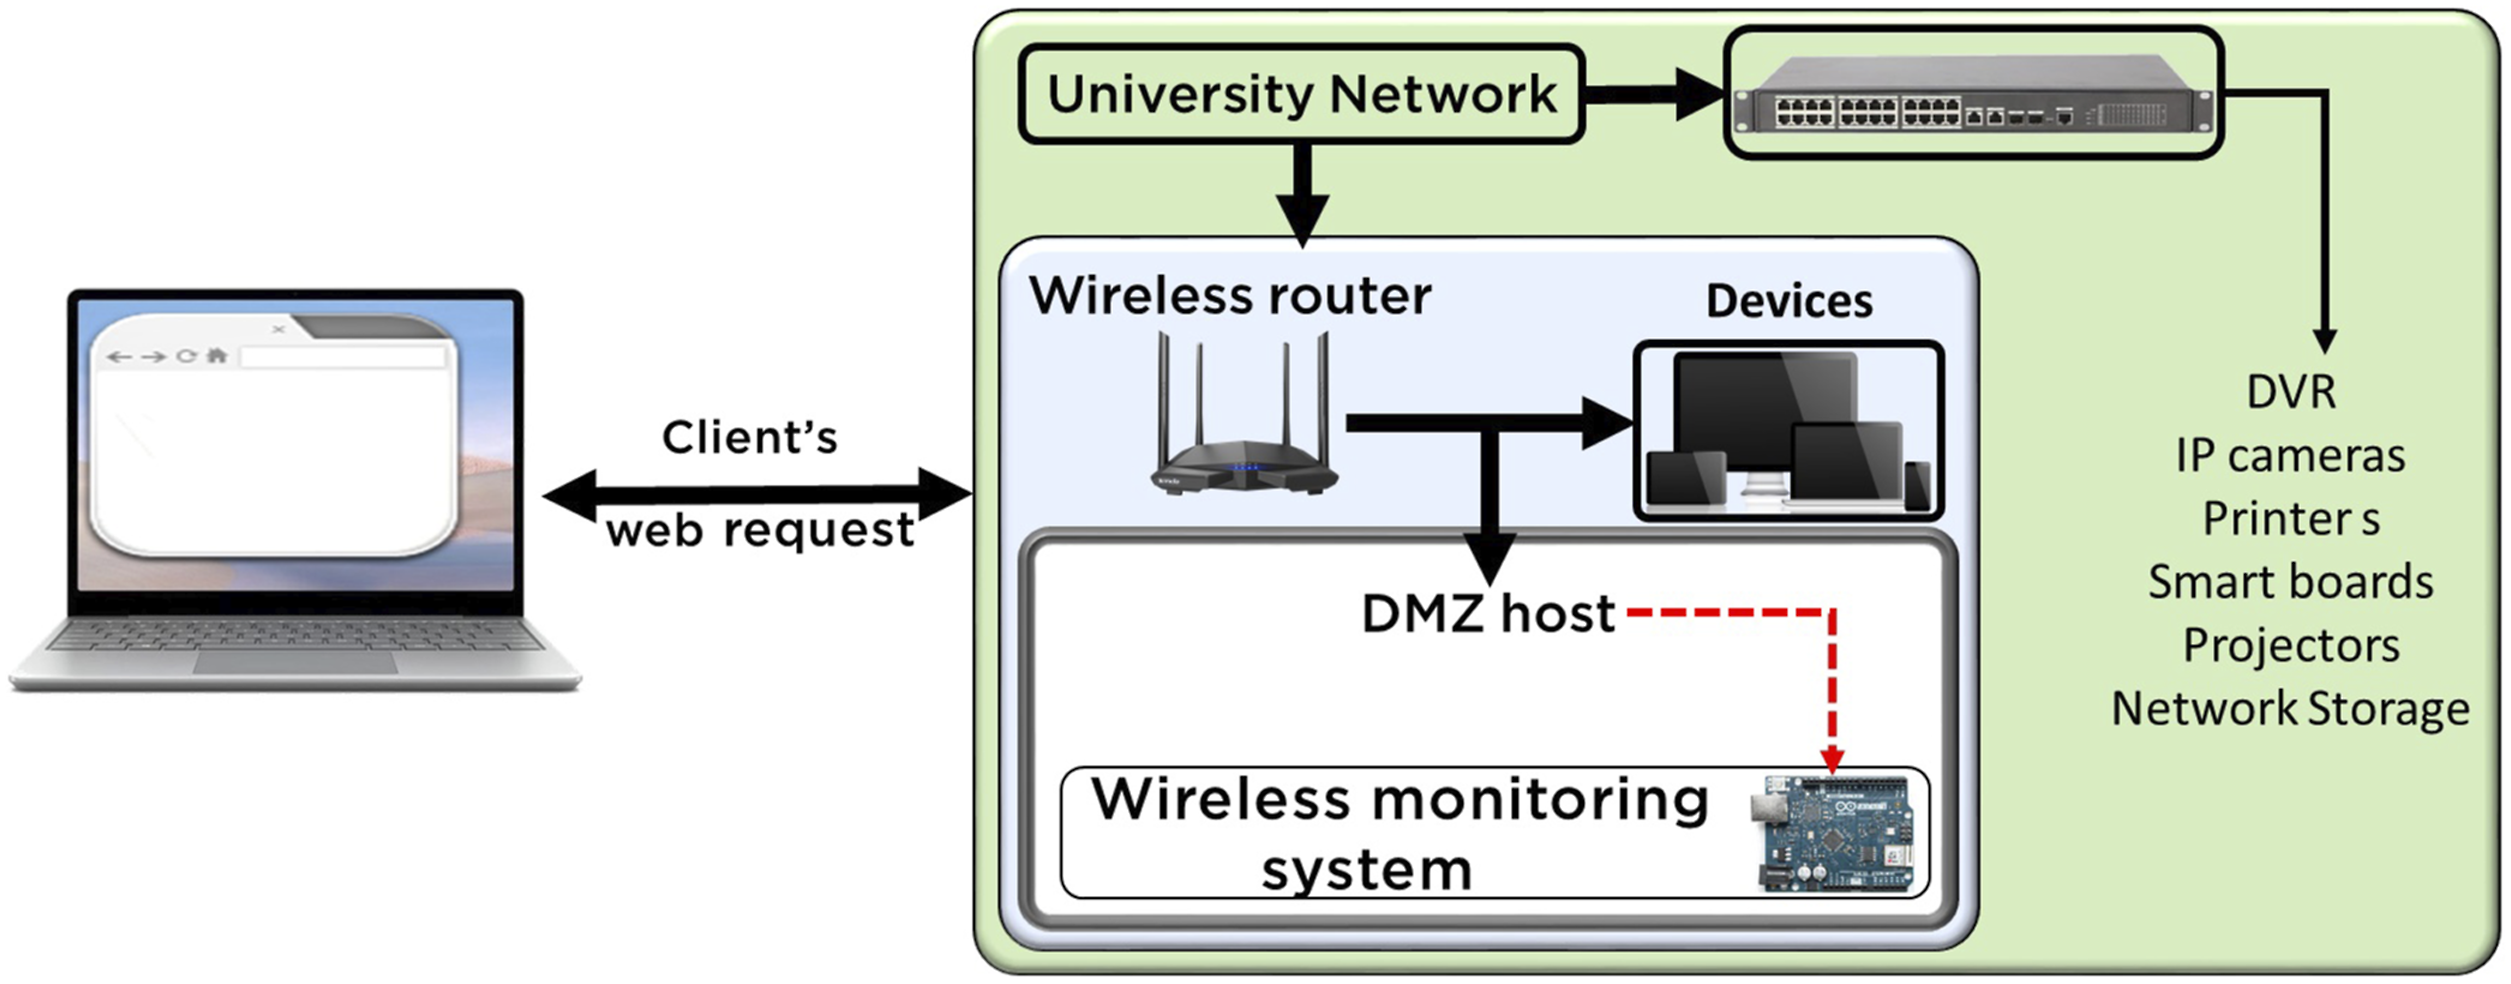
Experimental setup
The proposed PV monitoring hardware is shown in Figure 5. Under standard test conditions (STC) of 1000 W/m2 and 25°C, the PV panel has a maximum power of 15 W, an efficiency of 14.12%, an open circuit voltage of 25.02 V, and a short circuit current of 0.82 A. The maximum power point is obtained when the voltage and the current are 20.10 V and 0.72 A, respectively. Remote photovoltaic monitoring system hardware.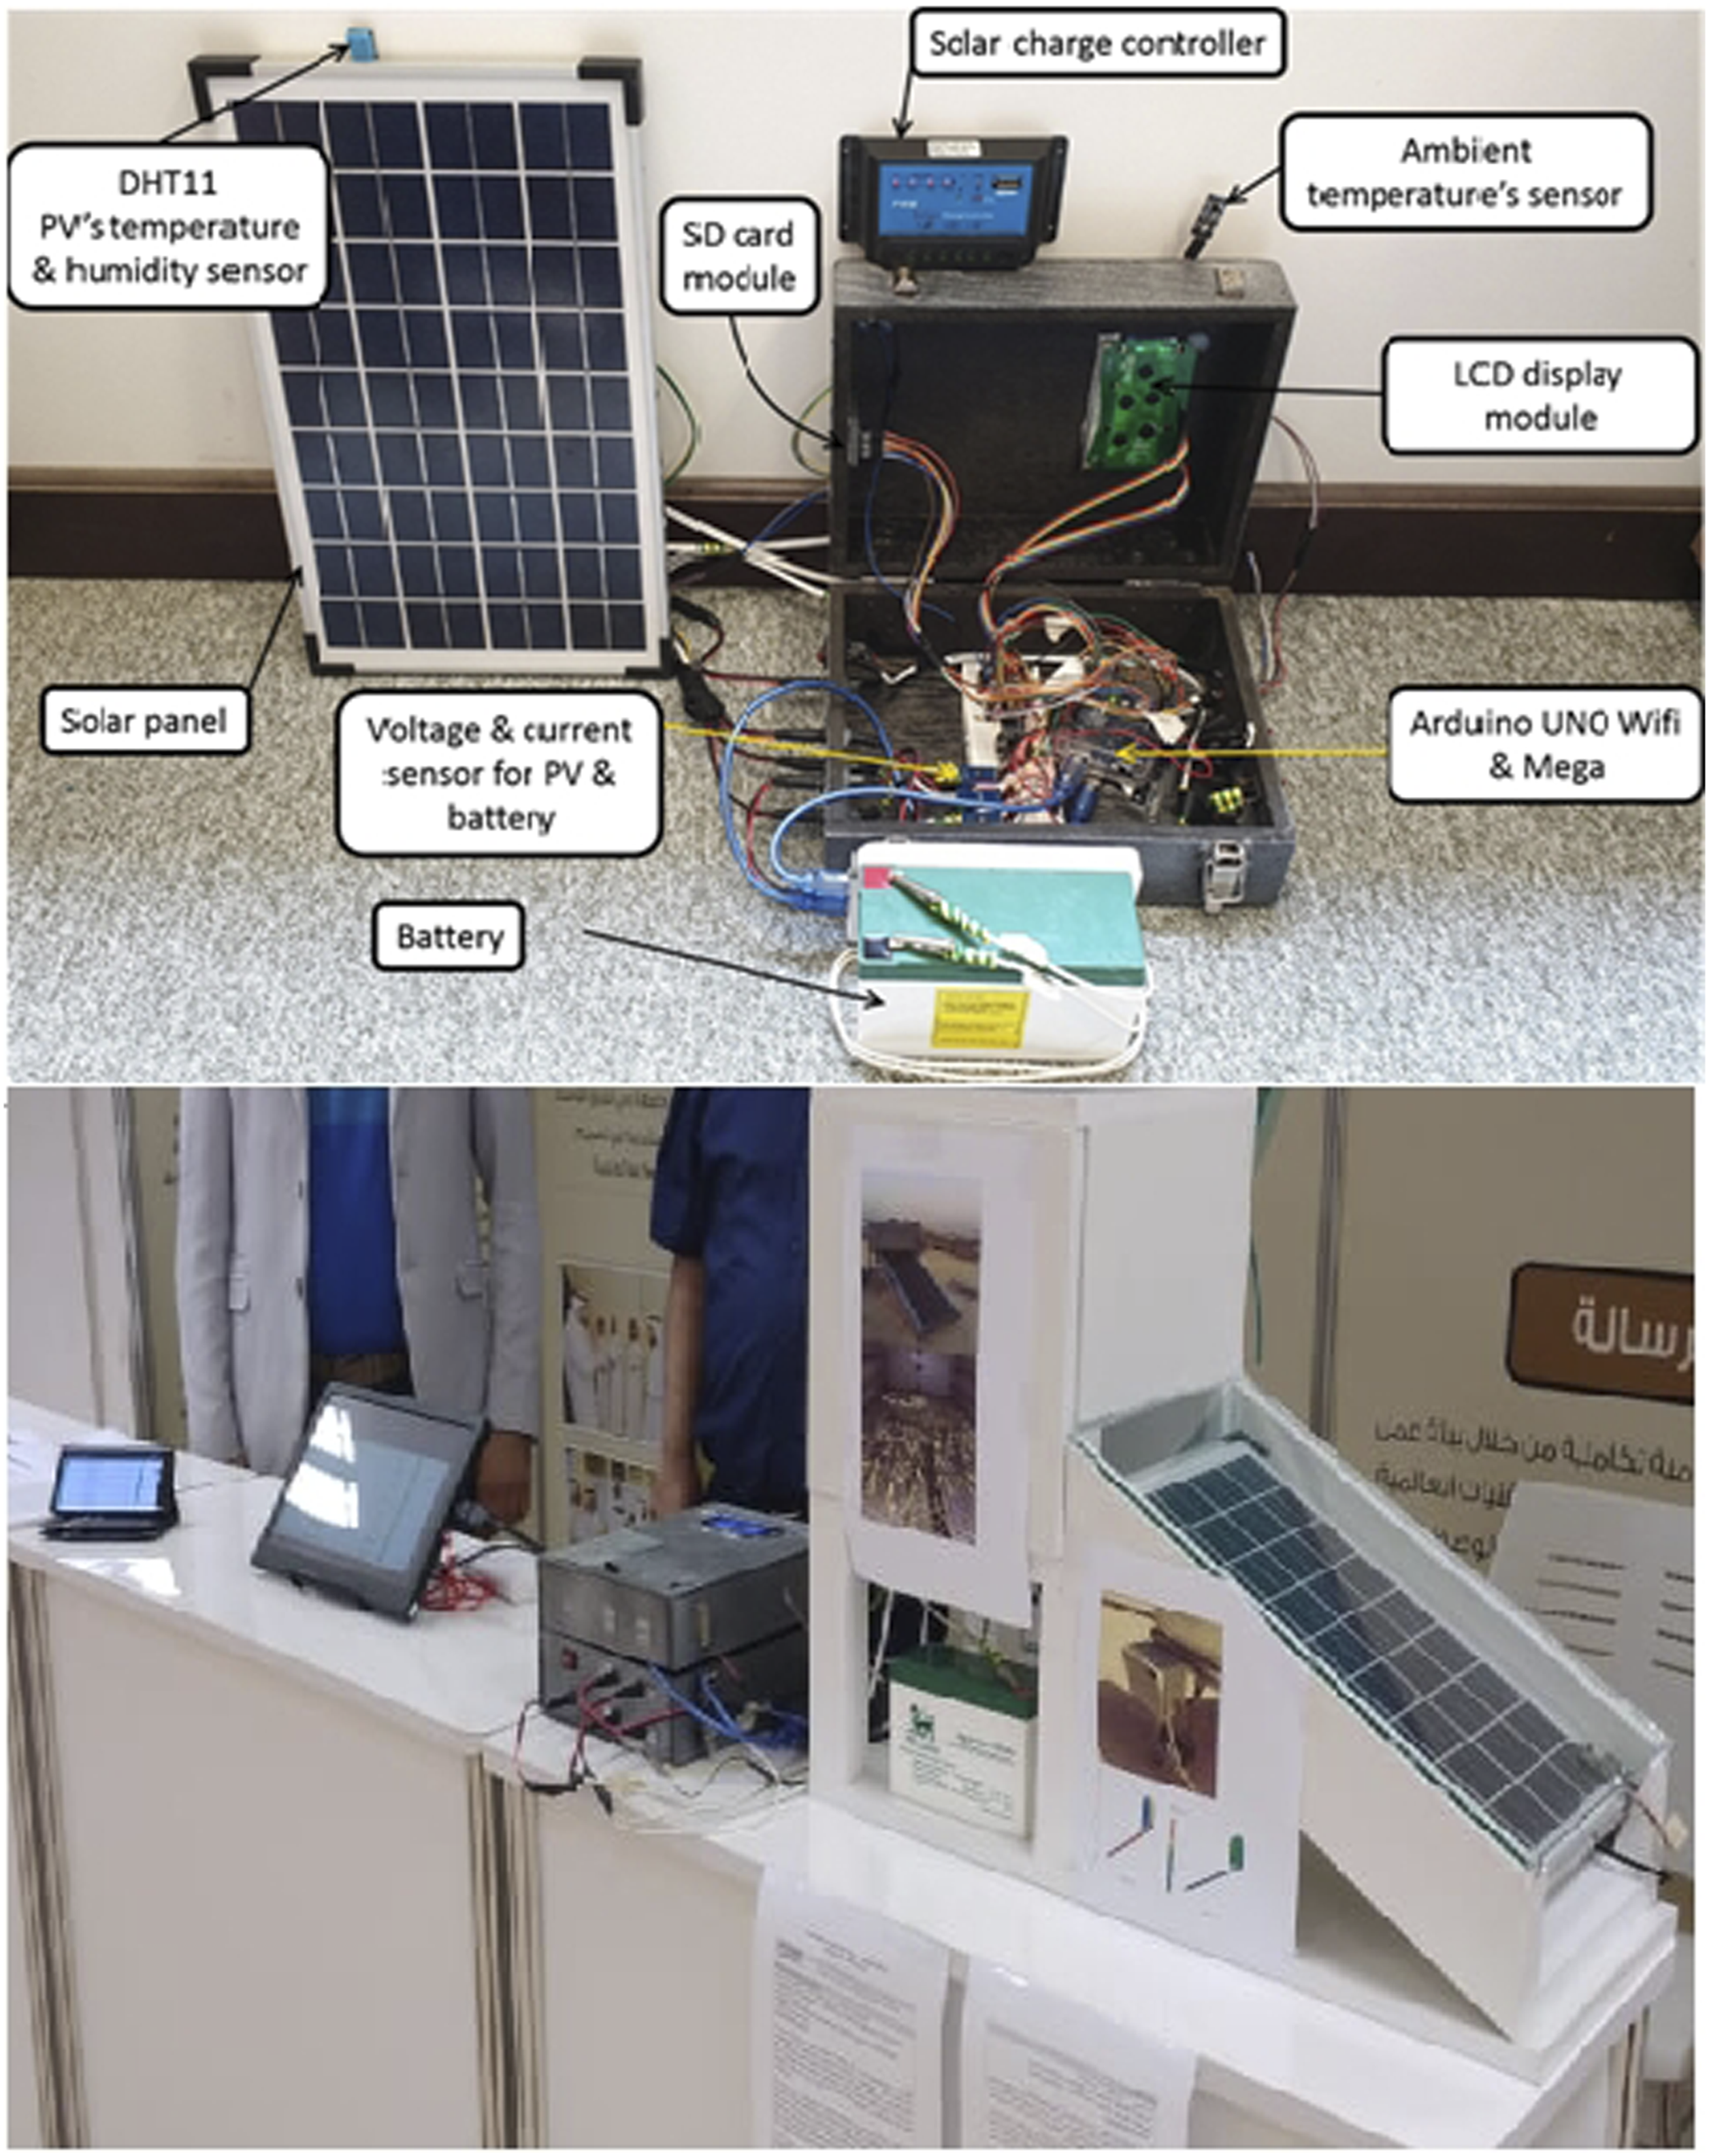
The DHT11 sensor measures the panel temperature and humidity. While the LM35 sensor measures the ambient temperature. The PV panel, battery voltage, and current are measured by the Arduino Voltage Module 25V’ and ACS712 sensors. A PWM charge controller is used to maintain a constant D.C. voltage while charging the battery. In addition, the prototype was equipped with one SD card module for data storage, one LCD, one Arduino Uno Wi-Fi module, and one Arduino Mega equipped with the DS3231 Real-Time Clock module. It is worth mentioning that the ACS712 sensor has the following features: 1. It measures the DC and AC currents regardless of the current flow direction. 2. It needs only 5.0 V for operation and measures currents of up to 30 A. 3. It provides extremely stable output offset voltage, low-noise analog signal path, and nearly zero magnetic hysteresis.
Software design
The router was connected to the university network through an RJ45 cable. By knowing the IP address of this slot, it was possible to access the router configuration page from anywhere within the university. The DMZ feature is enabled by accessing the router configuration page for the DMZ setting and specifying the PV system’s IP address. The university network administrator executes the above two tasks. In this project, the router’s assigned IP address is 10.154.28.35. Once the DMZ was successfully deployed, it is then possible to access the PV data using that same IP address. The P.V. could then be monitored from any place within the university. The system can only be accessed when using the university’s network and is not exposed to the outer internet, protecting it therefore from external cyber threats and providing an extra layer of security for sensitive data.
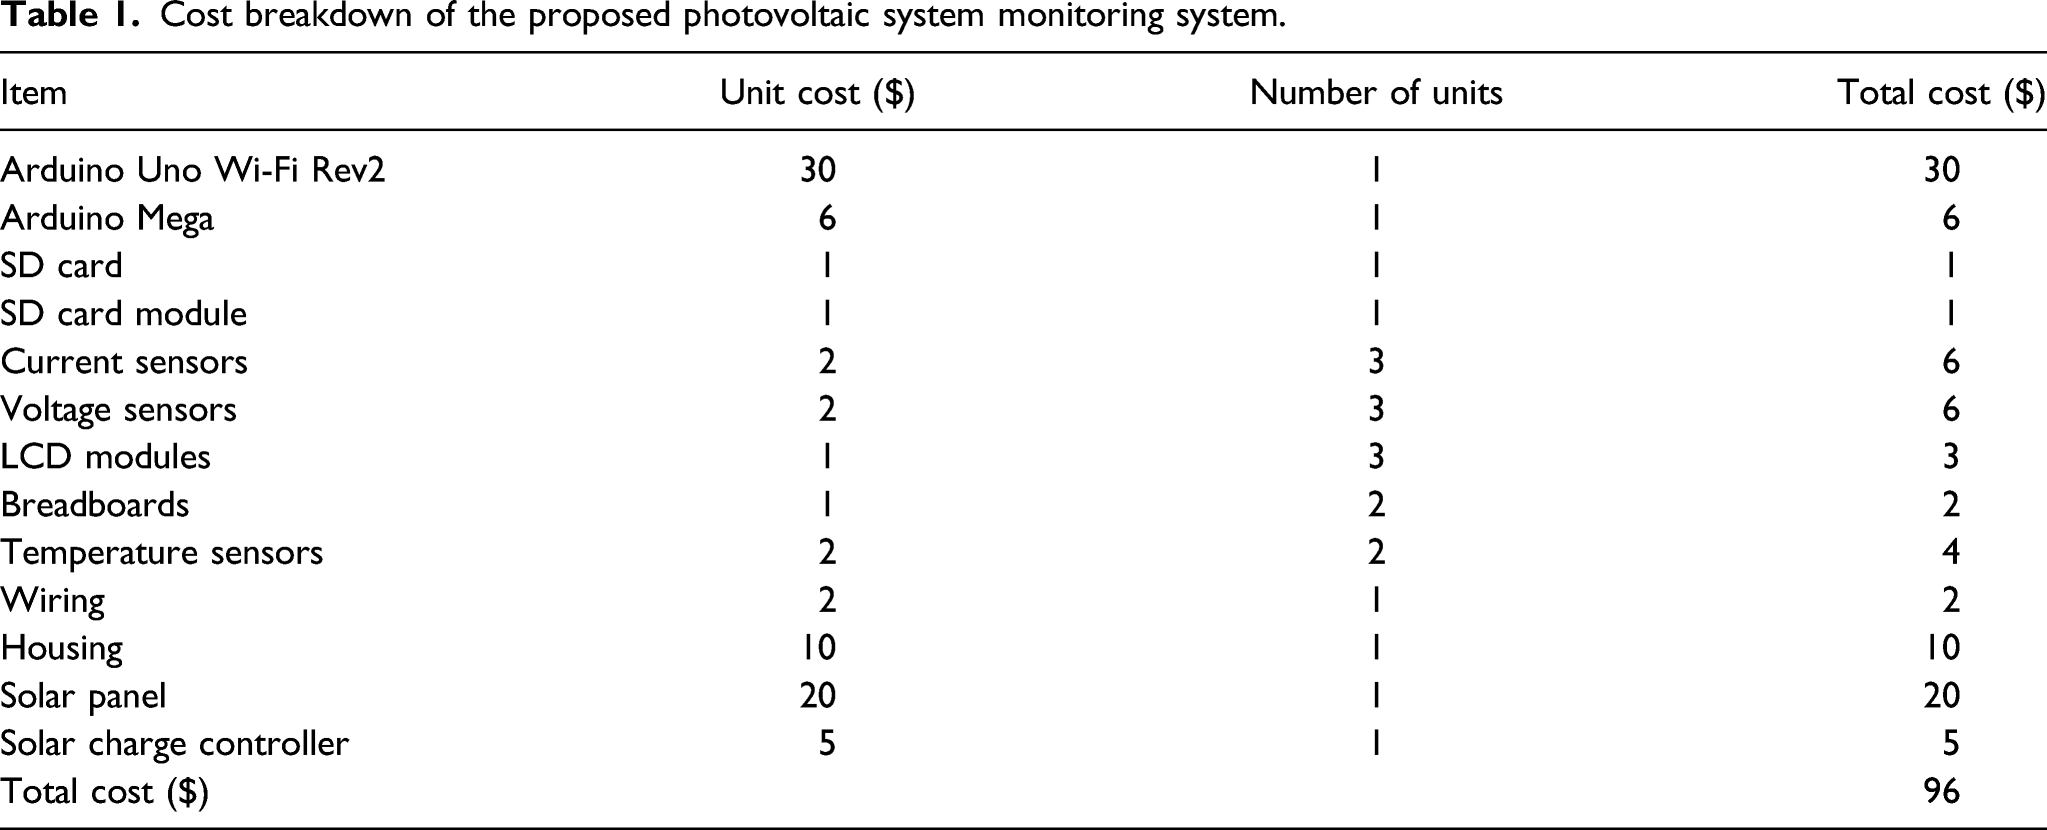
Economic evaluation
Cost breakdown of the proposed photovoltaic system monitoring system.
System implementation
The proposed PV monitoring hardware shown in Figure 5 is tested throughout the design process as well as in the final stage.
Solar photovoltaic monitoring system measurements
Figure 6 depicts the online monitoring summary for 6 October 2020, at 10:43:57 a.m. and depicts that the panel power output exceeded its rated capacity and reached 16.99 W. Measurement sample for 6 October 2020.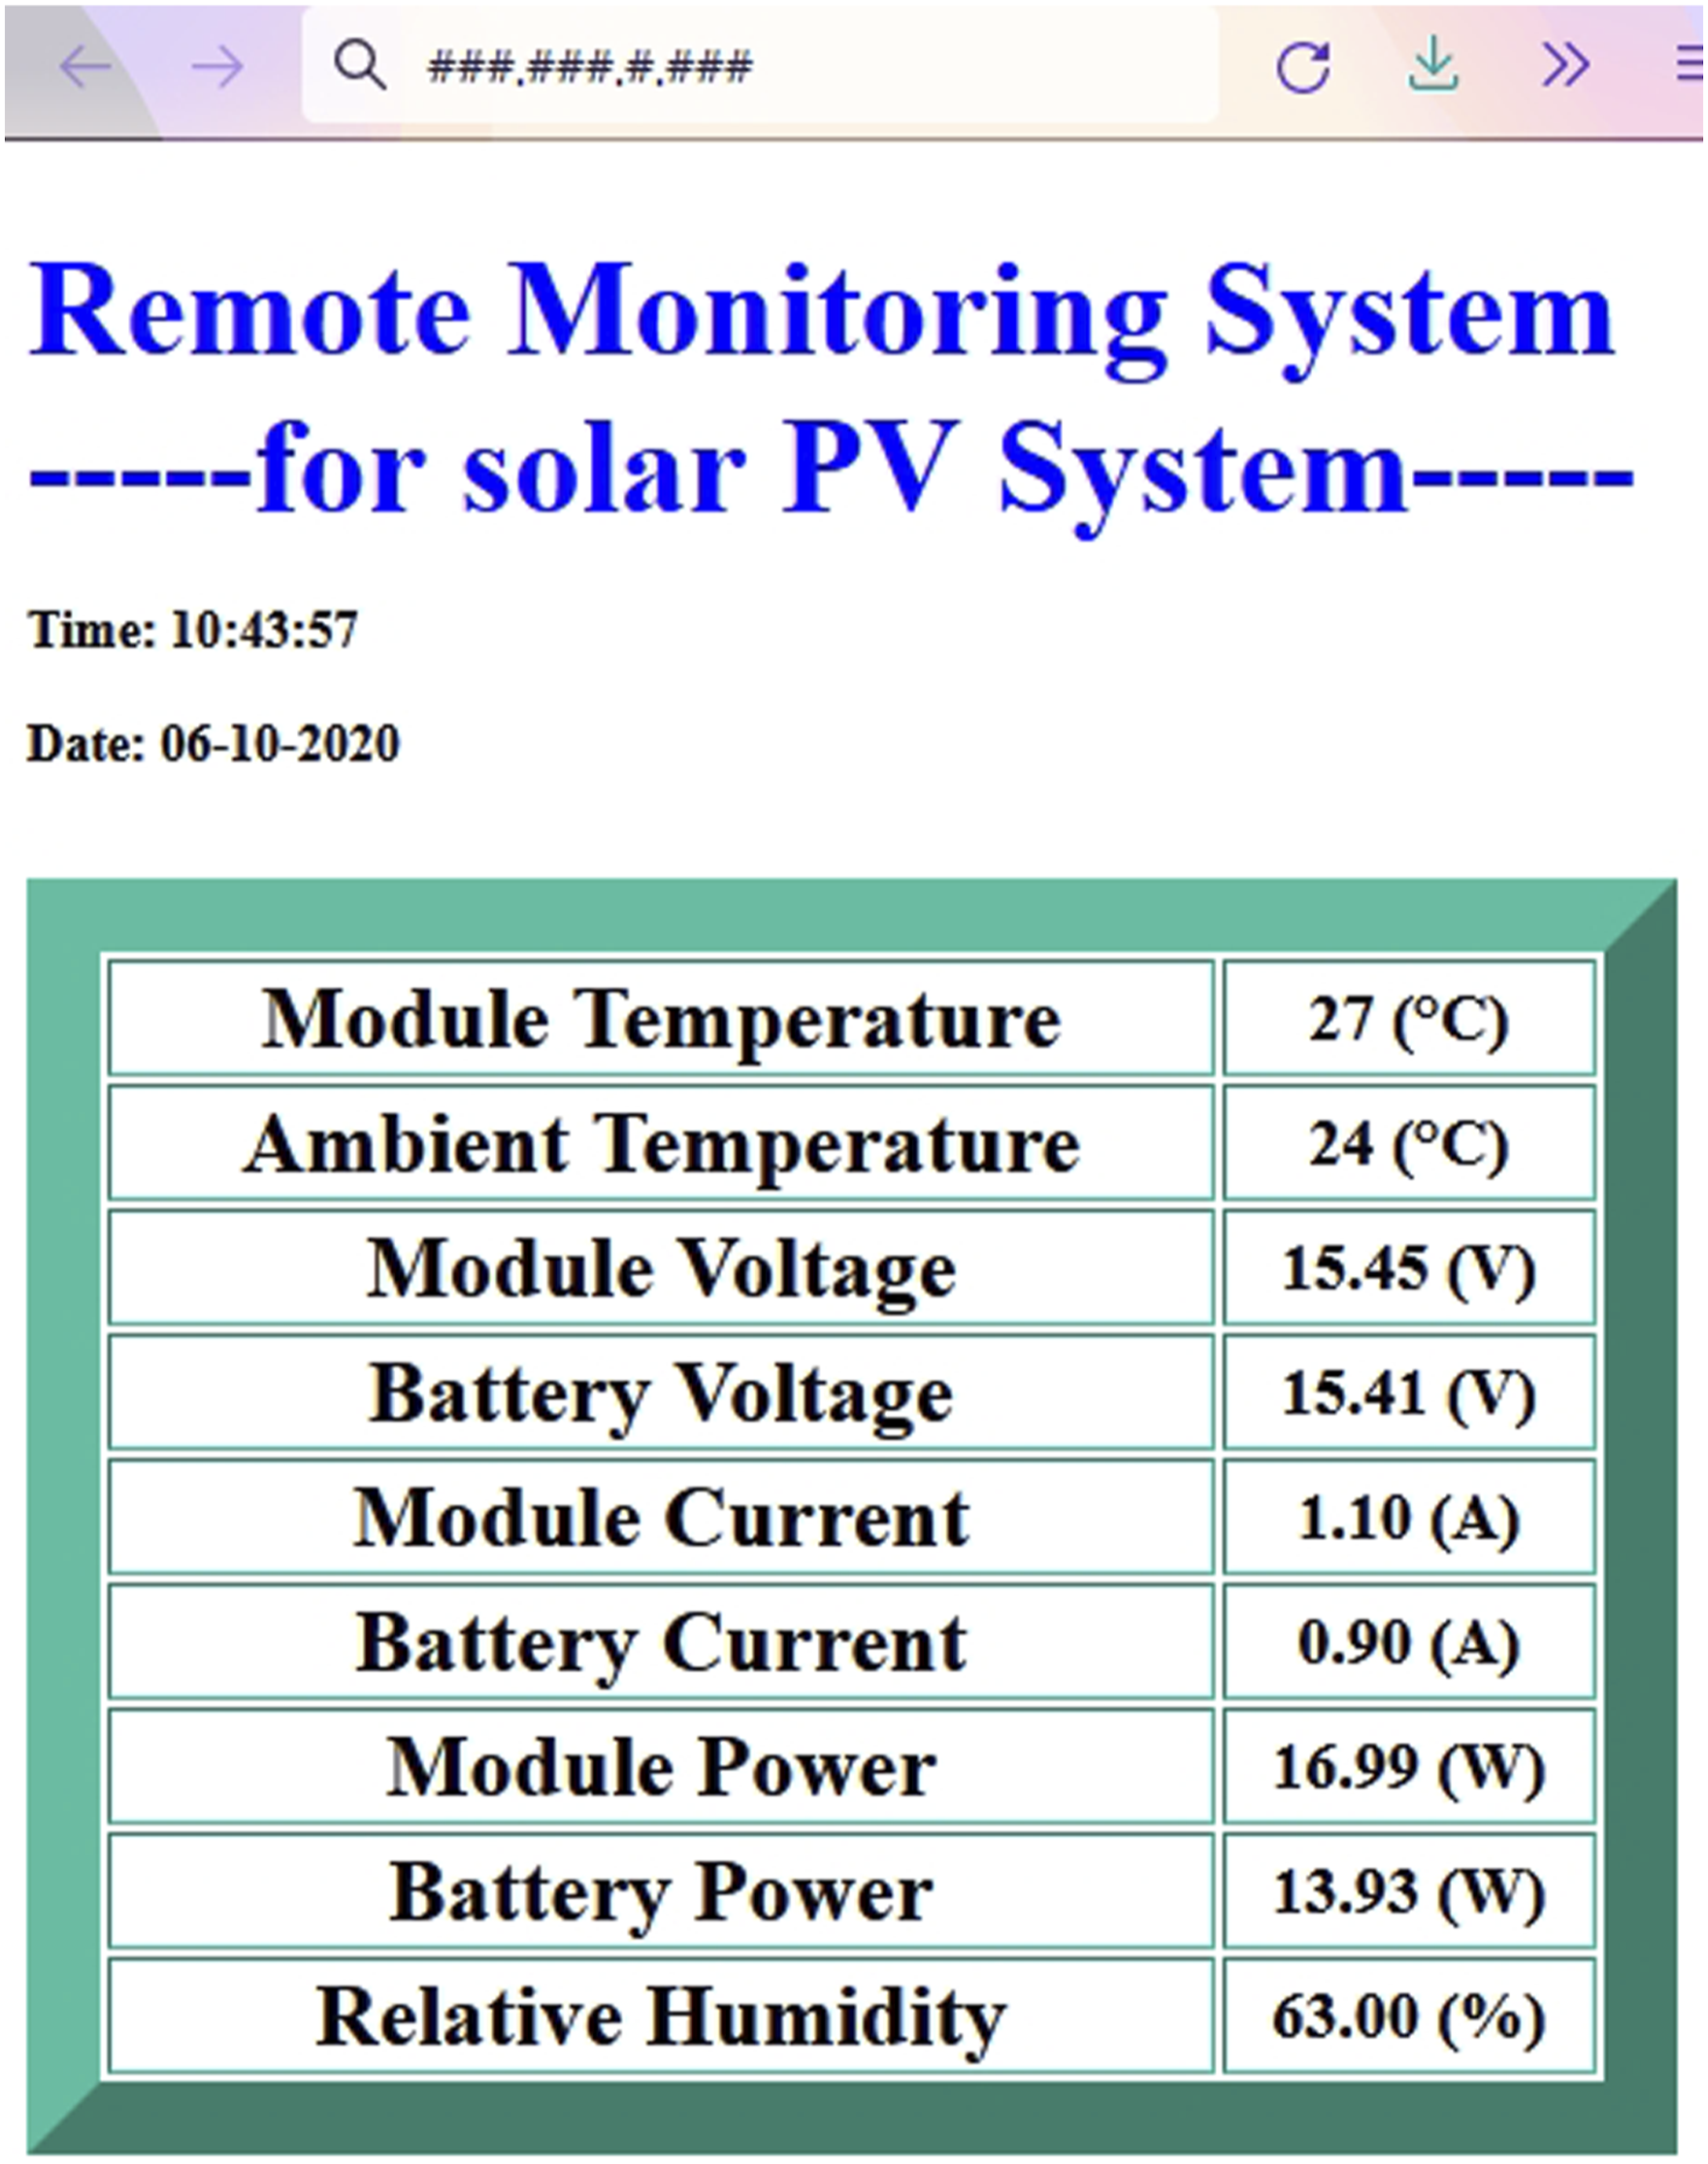
Measurement samples for 26 April 2019.
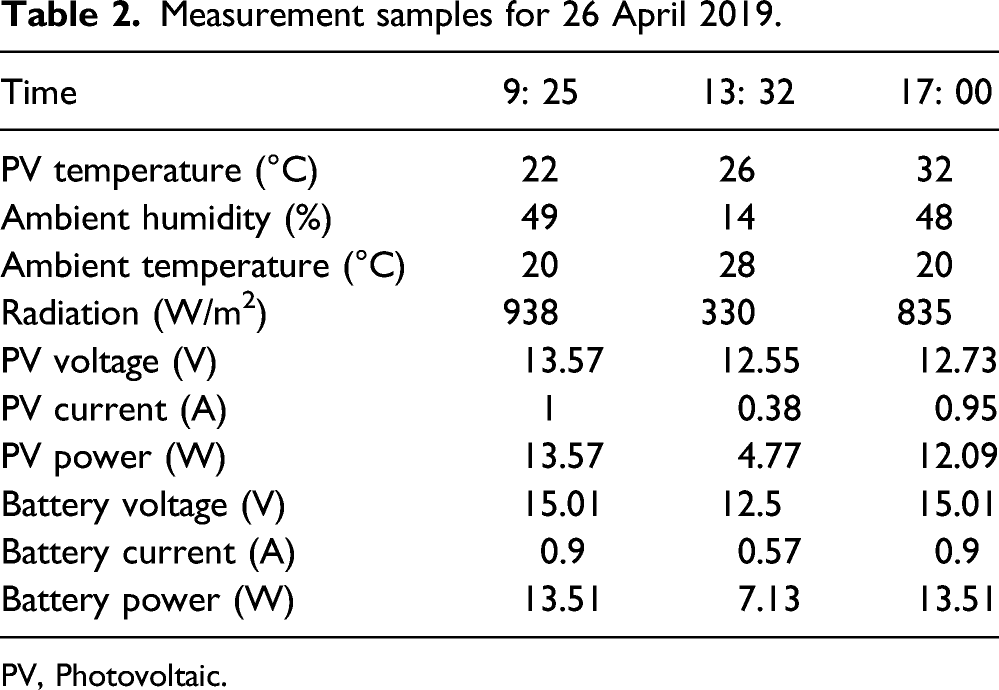
PV, Photovoltaic.
The estimated solar panel efficiency of 13.62%, 13.61%, and 13.63% at 9:25 a.m., 13:32 p.m. and 17:00 are about 1% less than the 14.12% nameplate efficiency.
Sample of the 1-minute measurements for 26 April 2019.
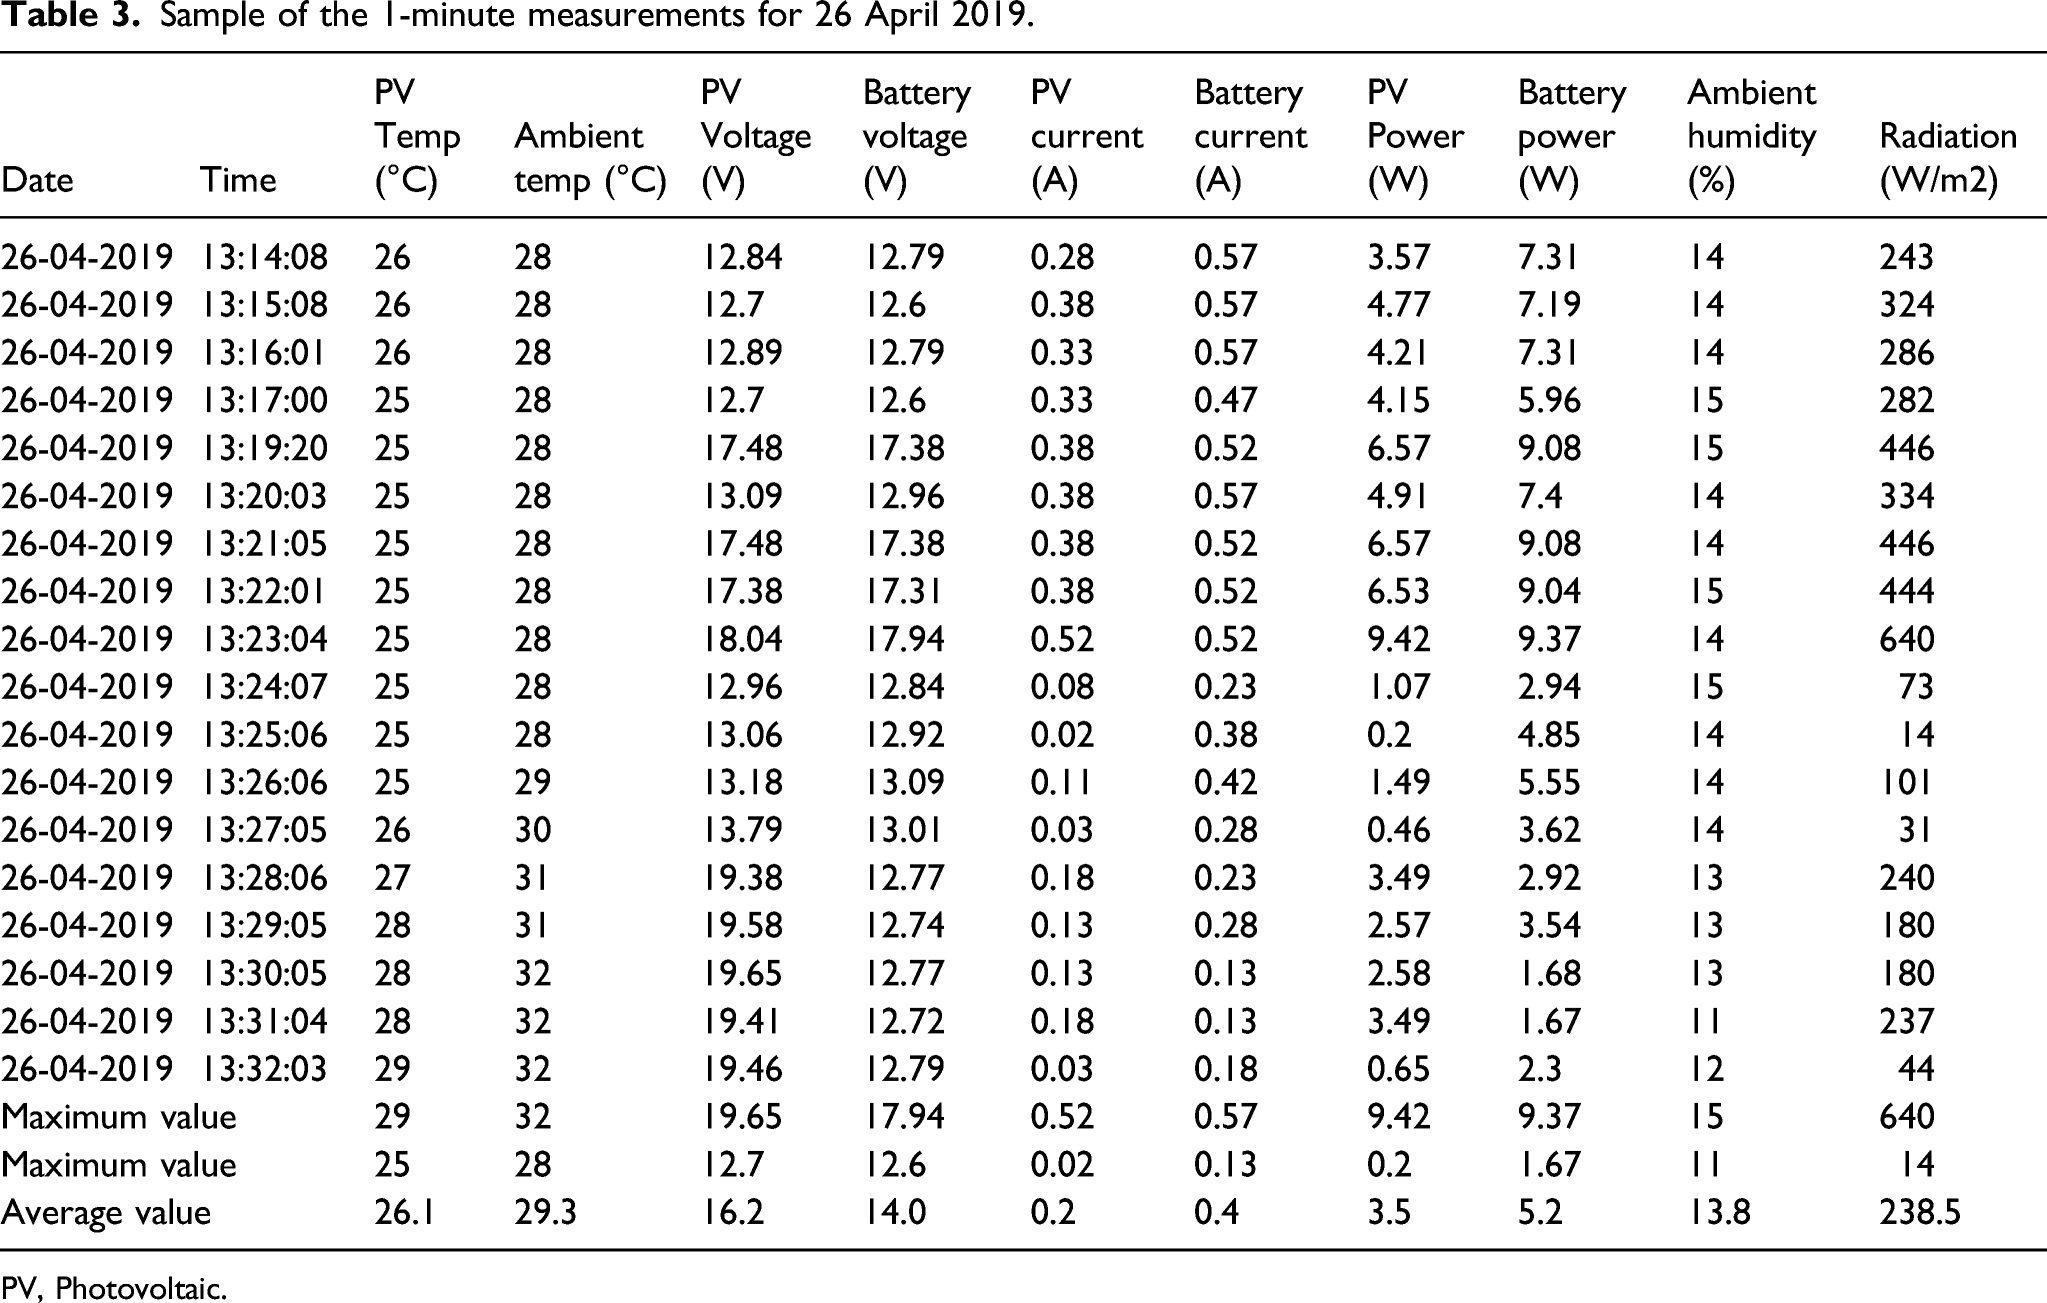
PV, Photovoltaic.
Sample of 10-second measurements for 22 November 2020.
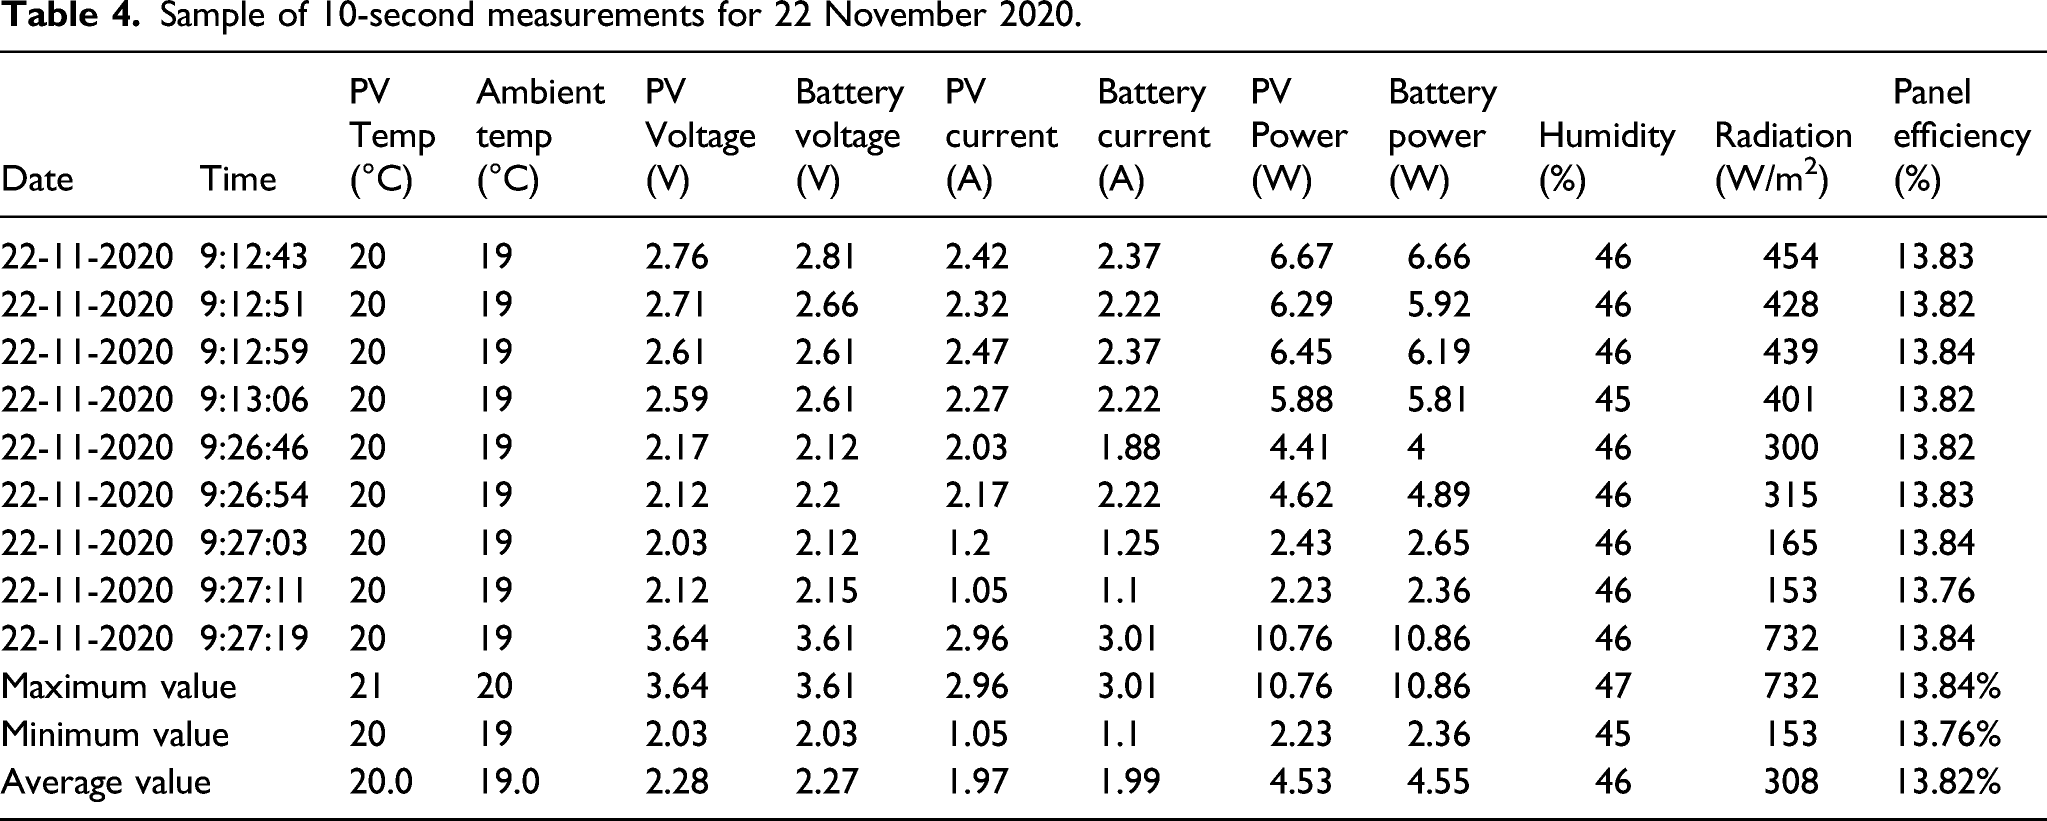
The measurements were taken 19 months later than those of Table 3. Table 4 shows while the ambient temperature remains constant for the entire period, the panel temperature remains about 1°C below the ambient temperature, while the solar radiation oscillates between 153 W/m2 and 732 W/m2. Meanwhile, the PV power output varies between 2.23 W and 10.76 W with an efficiency between 13.76% and 13.84%. The panel efficiency is expected to be high due to low ambient and solar panel temperatures.
Figure 7 displays the variation of the ambient and solar panel temperature; the PV power output and the efficiency of the solar panel being monitored and the solar radiation using 10-s measurements on 22 November 2020. Variation of (a) the ambient and solar panel temperature; (b) the photovoltaic power output and the efficiency of the solar panel being monitored and (c) the solar radiation using 10-s measurements on 22 November 2020.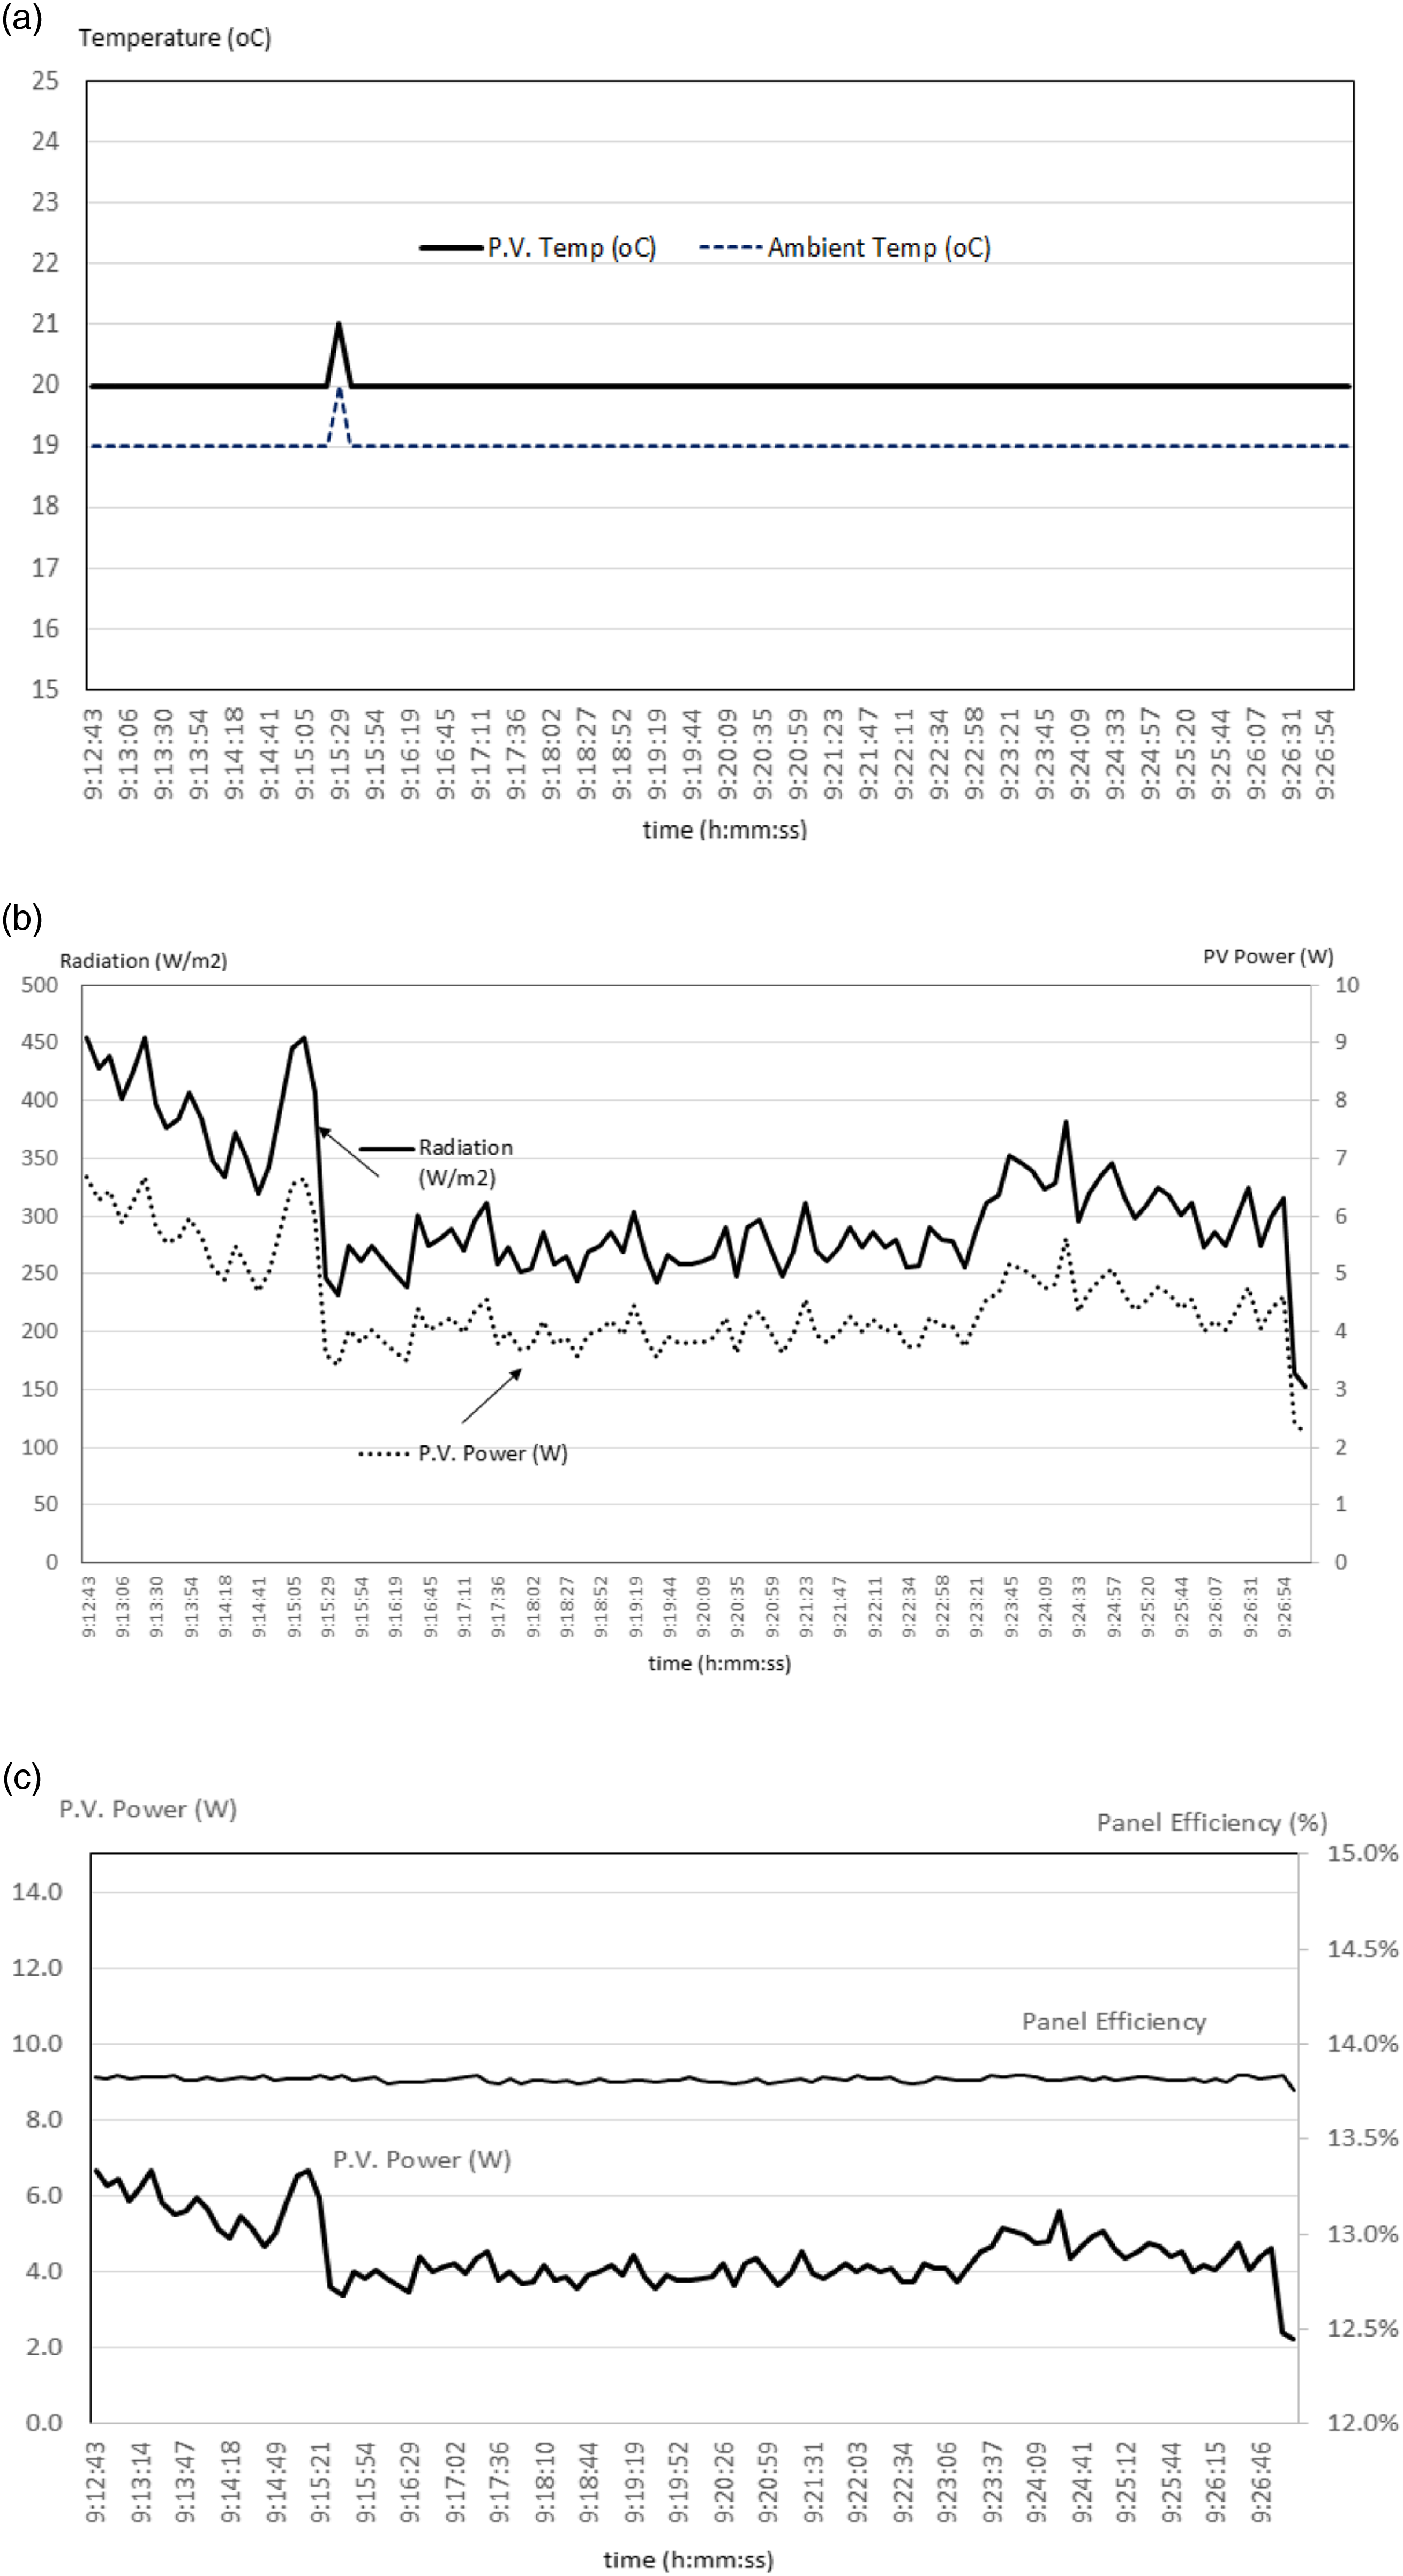
Monitoring system power consumption
The power consumption of the proposed monitoring system was carried out to estimate the energy requirements over time. The KEWEISI Voltage Current Tester was connected and displayed the power consumption with and without data transmission. It was found that the designed system consumes 1050 mW (at 5 V and 210 mA) and 300 mW (at 5 V and 60 mA), respectively. In contrast to the system designed in Ref. [20] which does not provide online monitoring, the proposed system consumes less power.
System design limitations and future work
Although recent Arduino boards technology has evolved and has several advantages, including the low cost, the adaptability to various operating systems such as Linux, Windows, and Macintosh, and flexible programming environment. Nevertheless, the technology has some limitations, such as low bit resolution of up to 10 bits, the inability to accommodate intricate and advanced systems with sophisticated platforms, and the ability to manage complex data involving simultaneous processes. According to comprehensive solar PV monitoring technologies, 26 small-scale PV system monitoring requires irradiance, panel output voltage, current, humidity, temperature, load output voltage current, and the inverter output voltage and current. The last two parameters were not monitored due to the DC nature of the load and instrumentation.
Finally, more precise sensors such as the LM36, DHT22, and D18B20 are chosen. Due to availability limits when the prototype was created, two independent sensors (LM35 and DHT11) are used instead. Except for the power range, these two sensors are Arduino compatible and offer similar features. The LM35 can be powered by voltage sources ranging from 4 V to 30 V, whereas the DHT11 requires voltage sources ranging from 3 V to 5.5 V given by the Arduino board. A summary of the solar PV system performance can be included at the end of each recording session for future work. This type of summary provides statistical findings from the recording session, such as the maximum, minimum, and average values, as well as the total energy produced by the solar PV system and consumed by the load since it started operating.
Conclusions
A unique remote monitoring system for PV systems is described in this paper. The proposed design is based on a low-cost and open-source system according to Arduino Uno Wi-Fi requirements. It gathers both meteorological and electrical data on-site, providing a wireless architecture capable of being implemented in most PV installations. It is capable of reading, processing, displaying, and storing critical parameters including solar radiation, the ambient and solar module temperatures, air humidity, voltages and currents of the solar panels, the charging current, the discharging current, and the load current and voltage. To overcome the university network encryption issue, the authors proposed a DMZ approach so that the designated router is recognized within that network and accessed from within the university without exposing it to external unauthorized access. This feature would also allow the lab and course instructors to access the solar PV performance data. The sensors were calibrated, and the results comply with the IEC-61,724 minimum accuracy values in terms of current, voltage, and power. The PV-module temperature was reported with an average error of 4% or less. Moreover, data are measured with an error of 2% and can be accessed from a mobile phone or a computer.
From an economical perspective, the proposed monitoring approach is less expensive than current commercial solutions. Table 1 provides detailed cost information. Sensors and hardware requirements for the gateway and related nodes are included in the price.
Footnotes
Declaration of conflicting interests
The author(s) declared no potential conflicts of interest with respect to the research, authorship, and/or publication of this article.
Funding
The author(s) disclosed receipt of the following financial support for the research, authorship, and/or publication of this article: This work was funded by Deanship of Scientific Research, King Faisal University (186352).