
Abstract
Background. Neuropathic pain (NP) following spinal cord injury (SCI) affects the quality of life of almost 40% of the injured population. The modified brain connectivity was reported under different NP conditions. Therefore, brain connectivity was studied in the SCI population with and without NP with the aim to identify networks that are altered due to injury, pain, or both. Methods. The study cohort is classified into 3 groups, SCI patients with NP, SCI patients without NP, and able-bodied. EEG of each participant was recorded during motor imagery (MI) of paralyzed and painful, and nonparalyzed and nonpainful limbs. Phased locked value was calculated using Hilbert transform to study altered functional connectivity between different regions. Results. The posterior region connectivity with frontal, fronto-central, and temporal regions is strongly decreased mainly during MI of dominant upper limb (nonparalyzed and nonpainful limbs) in SCI no pain group. This modified connectivity is prominent in the alpha and high-frequency bands (beta and gamma). Moreover, oscillatory modified global connectivity is observed in the pain group during MI of painful and paralyzed limb which is more evident between fronto-posterior, frontocentral-posterior, and within posterior and within frontal regions in the theta and SMR frequency bands. Cluster coefficient and local efficiency values are reduced in patients with no reported pain group while increased in the PWP group. Conclusion. The altered theta band connectivity found in the fronto-parietal network along with a global increase in local efficiency is a consequence of pain only, while altered connectivity in the beta and gamma bands along with a decrease in cluster coefficient values observed in the sensory-motor network is dominantly a consequence of injury only. The outcomes of this study may be used as a potential diagnostic biomarker for the NP. Further, the expected insight holds great clinical relevance in the design of neurofeedback-based neurorehabilitation and connectivity-based brain–computer interfaces for SCI patients.
Keywords
Introduction
Spinal cord injury (SCI) and neuropathic pain (NP) cause functional changes in various brain regions thereby affects the quality of life of almost 40% of the injured population.1‐3 Our previous study reported theta over-activation along with alpha and beta over-activation during motor tasks performed by SCI patients having NP. 4 Studies on other neurological disorders such as Alzheimer’s, epilepsy, and mild cognitive impairment reported abnormal brain connectivity. 5 Taken together, altered cortical connectivity may also be expected in patients having NP following SCI. 6
NP affects the functional connectivity (FC) in various regions of the brain such as fronto-parietal, sensory-motor, and within motor (among primary, pre, and supplementary motor areas) networks.7‐9 These studies reported increased connectivity strength due to NP, 7 which is not restricted to superficial networks but also found in deep cortical structures. 9 This includes increased connectivity of insula and anterior cingulate cortices with the prefrontal region. 8 Functional magnetic resonance imaging (fMRI) studies are mostly based on resting-state data as it is sensitive to slow oscillations and has a poor temporal resolution.6,10‐13 However, cognitive-motor processes such as motor imagery (MI) occur at faster time scales. Furthermore, oscillatory activity changes have been reported in people having NP.3,14‐17 Therefore, the findings of EEG studies are very important. EEG studies on cortical connectivity also provide oscillatory information in specific frequency bands. Moreover, studies also reported increased connectivity strength in the alpha and beta bands with long-range (between frontal and posterior regions) and short-range connectivity changes (within posterior and within frontal regions).3,15‐17
Various SCI studies of altered cortical connectivity are based on fMRI data but reported contradicting findings.10‐12, 18‐23 However, most studies reported decreased connectivity of primary motor and sensory cortices with supplementary motor area (frontal region), visual and somatosensory cortex.10‐12,21‐23 EEG studies have also been widely used to investigate altered brain networks of SCI patients in resting and nonresting states, employing motor tasks such as attempting, executing, or imagery of hands and foot. The study reported significantly decreased connectivity over the sensorimotor cortex (located over the central and posterior regions) in patients with SCI when compared with healthy subjects. Studies also found that SCI patients had a large number of cortical connectivity networks in which cingulate and supplementary motor areas were identified as an information hub.3,16,17
Despite the detailed literature survey, we did not find any brain connectivity study conducted on the SCI population separating the impact of injury and NP. Therefore, based on findings of connectivity studies conducted only on the SCI population and on subjects with NP only, we assume that connectivity changes following SCI may be an effect of NP as well. This study aims to use EEG to identify which modified brain networks connectivity is due to SCI and/or due to NP. The expected insight holds great clinical relevance in the design of neurofeedback-based neurorehabilitation and connectivity-based brain–computer interfaces for SCI patients.
Methodology
Participants
A total of 30 participants aged between (18 and 55 years old) were recruited and divided into 3 groups:
Able-bodied (AB) without a history of any neurological disorder (3 female, 7 male, age 39.1 ± 10.1 [mean ± standard deviation]). SCI patients with no reported pain (PNP) (2 female, 8 male, age 44.4 ± 8.1). SCI patients with central NP (CNP) ≥ 5 on a visual numerical scale (VNS) (3 female, 7 male, age 45.2 ± 9.1).
The American Spinal Injury Association (ASIA), an impairment classification system is used to determine the neurological level of SCI.
24
All patients having pain ≥5 were included in the study. Whereas, patients having any chronic (other than CNP) or acute pain such as brain injury or any neurological disorder that can impact the analysis of EEG or may distract the patients to follow the experimental tasks were excluded from the study. All patients have signed an informed consent form in addition to ethical permission granted by the local health service to perform experiments.
EEG Recording and Preprocessing
Neuroscan EEG device (Synamp 2, Neuroscan, USA) was used to record the spontaneous and task-related EEG data (linked ear reference) with 61 channels placed on the head, based on a 10-10 system. 25 The sampling frequency was 1000 Hz but downsampled to 250 Hz before preprocessing. A high-pass filter of 1 Hz and a band-pass filter of 48 to 52 Hz were applied before converting EEG data into average reference. However, ICA was applied for extensive removal of noises or non-EEG activities captured during EEG recordings. In this regard, the Infomax algorithm was chosen for distinguishing brain activity from artifacts such as eye movements, muscle activity, and line noise. Further, the Infomax algorithm avoids overcorrection which results in a good performance for canceling artifact. 26 27 The bad components or artifact-related components were identified on the basis of their morphology, frequency spectrum, topography, and timing. 28 Once the artifact-related components are removed, the signal was then reconstructed and then EEG activity of each channel of both datasets (ie, with and without removal of bad components) was compared on the basis of visual inspection, frequency spectrum, and topography. The component that showed maximum activity at the frontopolar region (identified through topography) was removed as it represents an eye movement artifact. Similarly, components that showed peaks or strong activity around 50 Hz (identified on the basis of the spectrum) were also removed for removing line noise. Components that showed very focal activity at frequencies above 20 Hz usually at the lateral electrodes were considered as muscles artifacts and hence removed.
Experiment Study Design
On the day of the experiment, participants were asked to avoid coffee/alcohol. EEG was recorded in 2 different states: spontaneous and induced activity during cue-based MI. All patients with pain were requested to fill a Brief Pain Questionnaire. 29 Each participant was requested to sit comfortably on the desk while facing the computer screen for visual instructions at ∼1.5 m away. Each participant from all groups performed 3 types of cue-based MI tasks which are imagined movement of the right hand (RH), left hand (LH), or foot (F) tapping. They were told to focus at the center point of the screen and execute MI in response to visual cues and avoid any unnecessary movement. During each trial, a (cross +) cue appeared as a sign of readiness on screen at t = −1 s. A sign to initiate the task appeared next to the cross sign displayed as an arrow at t = 0 s till t = 1.25 s. These arrows have 3 directions right, left, or down denoting MI tasks of RH, LH, or F, respectively. All participates were instructed to continue the MI task for 3 s (after the initiation sign) till the cross sign disappears from the screen. Total 60 trials divided into 6 sessions were presented randomly for each MI task. The length of each trial was 5 s with 2 s prior to cue movement and then 3 s of cue movement.
Phase-Locking Values (PLVs)
PLV is used to detect phase synchrony in EEG signal for specific frequency band between 2 recording sides. PLV was calculated for all groups and all MI tasks among 61 channels pairs. There are 3 steps for measuring PLV30,31:
Step 1: Select desired frequency band and filter order: Following removal of artifacts, EEG data were first filtered using FIR band-pass filter: theta (4-8 Hz), theta-alpha overlap (TAO) (6-10 Hz), alpha (8-12 Hz), SMR (16-24 Hz), beta (20-30 Hz), and gamma (35-40 Hz) frequency ranges were selected. Four cycles of desired signals were selected to find the model order. The filter order for different frequency bands was calculated based on the following equations
32
:

Step 2: Calculating instantaneous phase: Hilbert transform was used for amplitude and frequency calculations and is termed as instantaneous amplitude, frequency, and phase angle.31,33,34
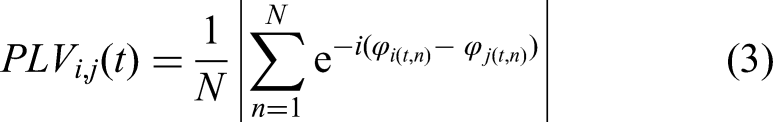
Step 3: Measuring PLV: PLV is computed among 61 channels (61*61 = 3721 pairs) for a time length of the single epoch, that is, 5 s (2 s before and 3 s after the target stimuli) using the following equation:
PLV Normalization
The reference period of −1.5 to −1.1 s was adopted as a baseline to find whether participants show desynchronization (reduced connectivity strength, ie, negative PLV) or synchronization (increased connectivity strength, ie, positive PLV) during MI tasks (0-3 s) as compared to baseline. Equation (4) demonstrates the normalization of PLV during MI tasks with baseline PLV value. PLV for a baseline period was subtracted with the PLV calculated for 3 different time ranges (0.5-1, 0.5-1.5, and 1.5-2.9 s).

Graph Theory Analysis
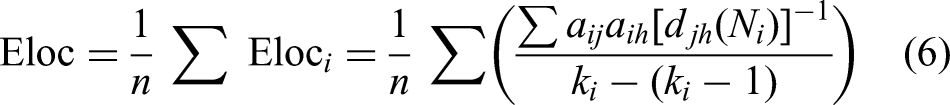
In order to further validate the characteristics of brain networks obtained through functional connectivity using EEG data, we have calculated various graph theoretical parameters which include clustering coefficient (Cp) and local efficiency (Eloc). These parameters were calculated with the help of the freely available toolbox “Brain Connectivity” (http://www.brain-connectivity-toolbox.net). Nodes were defined as 61 electrodes locations based on a 10-10 international system of electrode placement. An association undirected binary matrix was created by selecting connections having normalized PLV values above 30% of the maximum value.
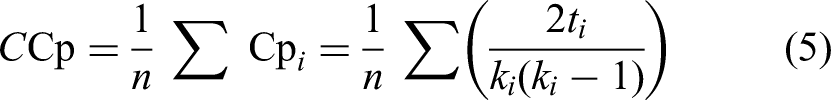
The clustering coefficient “Cp” was determined using Equation (5) and represents the fraction of a node's neighbors which were also neighbors to one another.
35
The local efficiency “
Statistical Analysis
For comparison of PLV (action-resting), a parametric unpaired t-test was applied between groups (PNP vs PWP, AB vs PWP, and AB vs PNP). The Shapiro–Wilk test was applied before applying parametric statistical analysis to confirm the normal distribution of normalized PLV values, cluster coefficients, and local efficiency. The P-value was set at 0.05. To control type-I error which may occur due to repetitive measures, a false discovery rate was applied on normalized PLV values overall 60 connections for each single electrode. However, for cluster coefficient and local efficiency values, the effect size was calculated to test whether a significant difference between the 2 groups was due to false positive, that is, type-I error. The effect size was calculated between each groups for each electrodes location. Effect sizes in ranges 0.2 to 0.49, 0.5 to 0.79, and larger than 0.8 were considered as small, medium, and large, respectively. 37
Grouping EEG Channels
To identify similar traits, PLV results are presented after grouping 61 EEG channels in 5 different regions. These include central (C), fronto-central (FC), centro-parietal (CP), frontal (F), and posterior (P) regions as represented in Figure 1.
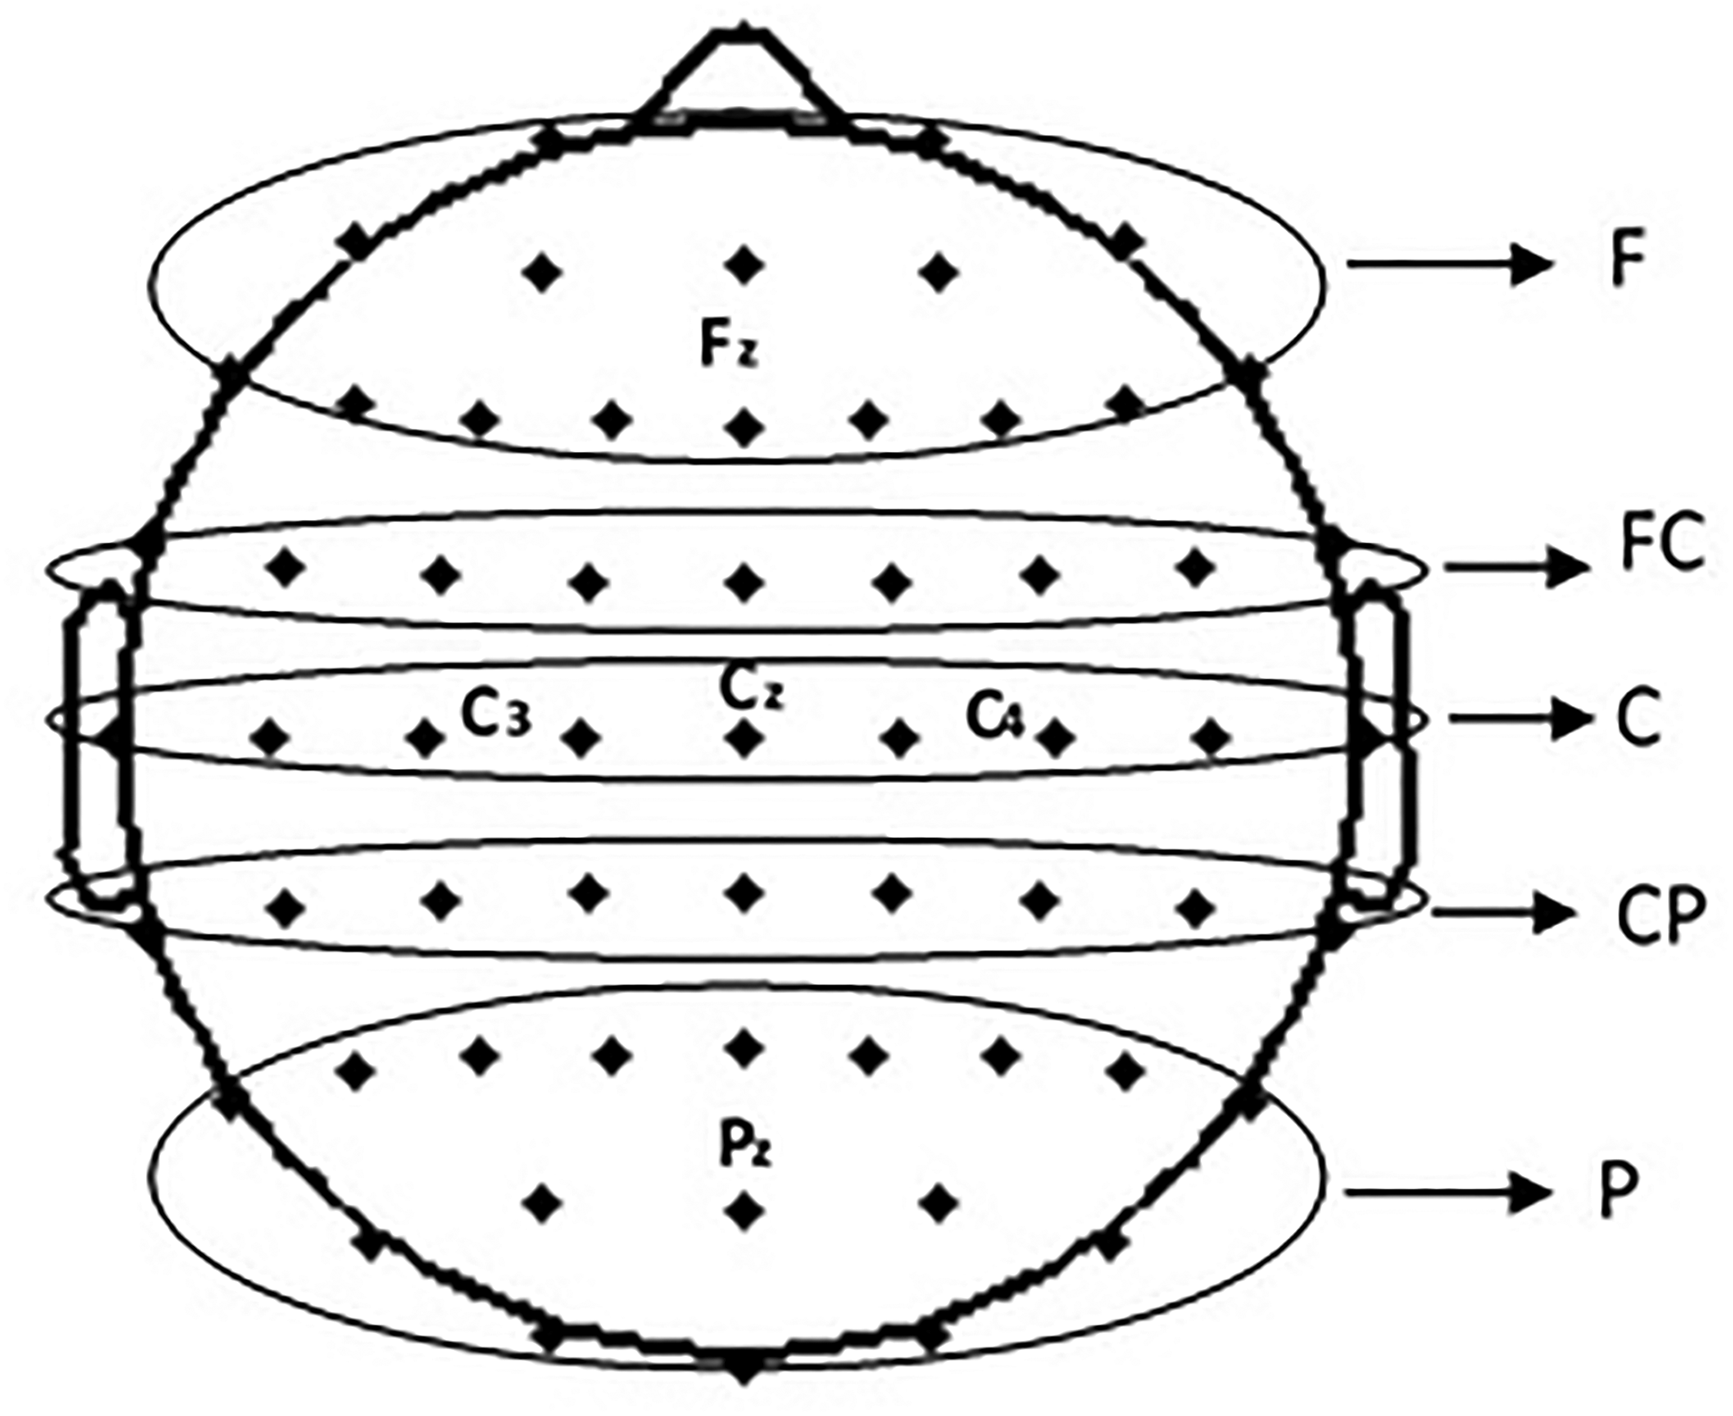
EEG channels grouping.
Results
The FC at a cortical level during MI of RH, LH, and F for different time periods (0.5-1.0, 0.5-1.5, and 1.5-2.9 s) in various frequency bands (theta, TAO, alpha, SMR, beta, and gamma bands) are compared between each of 2 groups (AB vs PNP AB vs PWP, and PWP vs PNP) for 61 electrode locations. The results are presented by grouping electrodes for 5 different regions, as shown in Figure 1. Figure 2 illustrates the comparison of FC strength between AB and PNP while performing MI of RH, LH, and F for different time periods (0.5-1.0, 0.5-1.5, and 1.5-2.9 s). In the TAO band (Figure 2B), the PNP group demonstrated synchronization while the AB group showed desynchronization within frontal at 0.5 to 1.5 s and between frontal-posterior regions at 0.5 to 1 and 1.5 to 2.9 s during MI of RH. During MI of F, AB group showed desynchronization while PNP group showed synchronization within frontal regions at 0.5 to 1 and 1.5 to 2.9 s and between frontal-posterior regions at 0.5 to 1.5 s. In the alpha band (Figure 2C), during MI of RH, both groups showed desynchronization which is stronger in the PNP group between central-posterior regions at 0.5 to 1.5 s. During MI of F, stronger desynchronization and synchronization in the PNP group are observed within the frontal and between frontal-posterior regions (0.5-1.5 and 1.5-2.9 s). In SMR (Figure 2D), the PNP group showed stronger desynchronization within frontal (0.5-1.5 s) and between frontal-posterior regions (1.5-2.9 s) during MI of F. In the beta band (Figure 2E), stronger desynchronization in the PNP group is observed between temporal-posterior (0.5-2.9 s) and between frontocentral-posterior regions at 1.5 to 2.9 s during MI of RH. During MI of LH, the PNP group showed stronger desynchronization between frontocentral-posterior (0.5-2.9 s), and between central-posterior regions (0.5-1 and 0.5-1.5 s). Moreover, during MI of F, the PNP group showed stronger desynchronization between frontocentral-posterior regions (0.5-1.5 and 1.5-2.9 s). In the gamma band (Figure 2F), during MI of RH and LH, stronger desynchronization is observed between central-posterior regions in the PNP group except at 0.5 to 1.5 s for MI of LH. Moreover, during MI of F, both groups showed synchronization which is stronger in the PNP group between frontal-posterior and within frontal regions at 0.5 to 1 s.
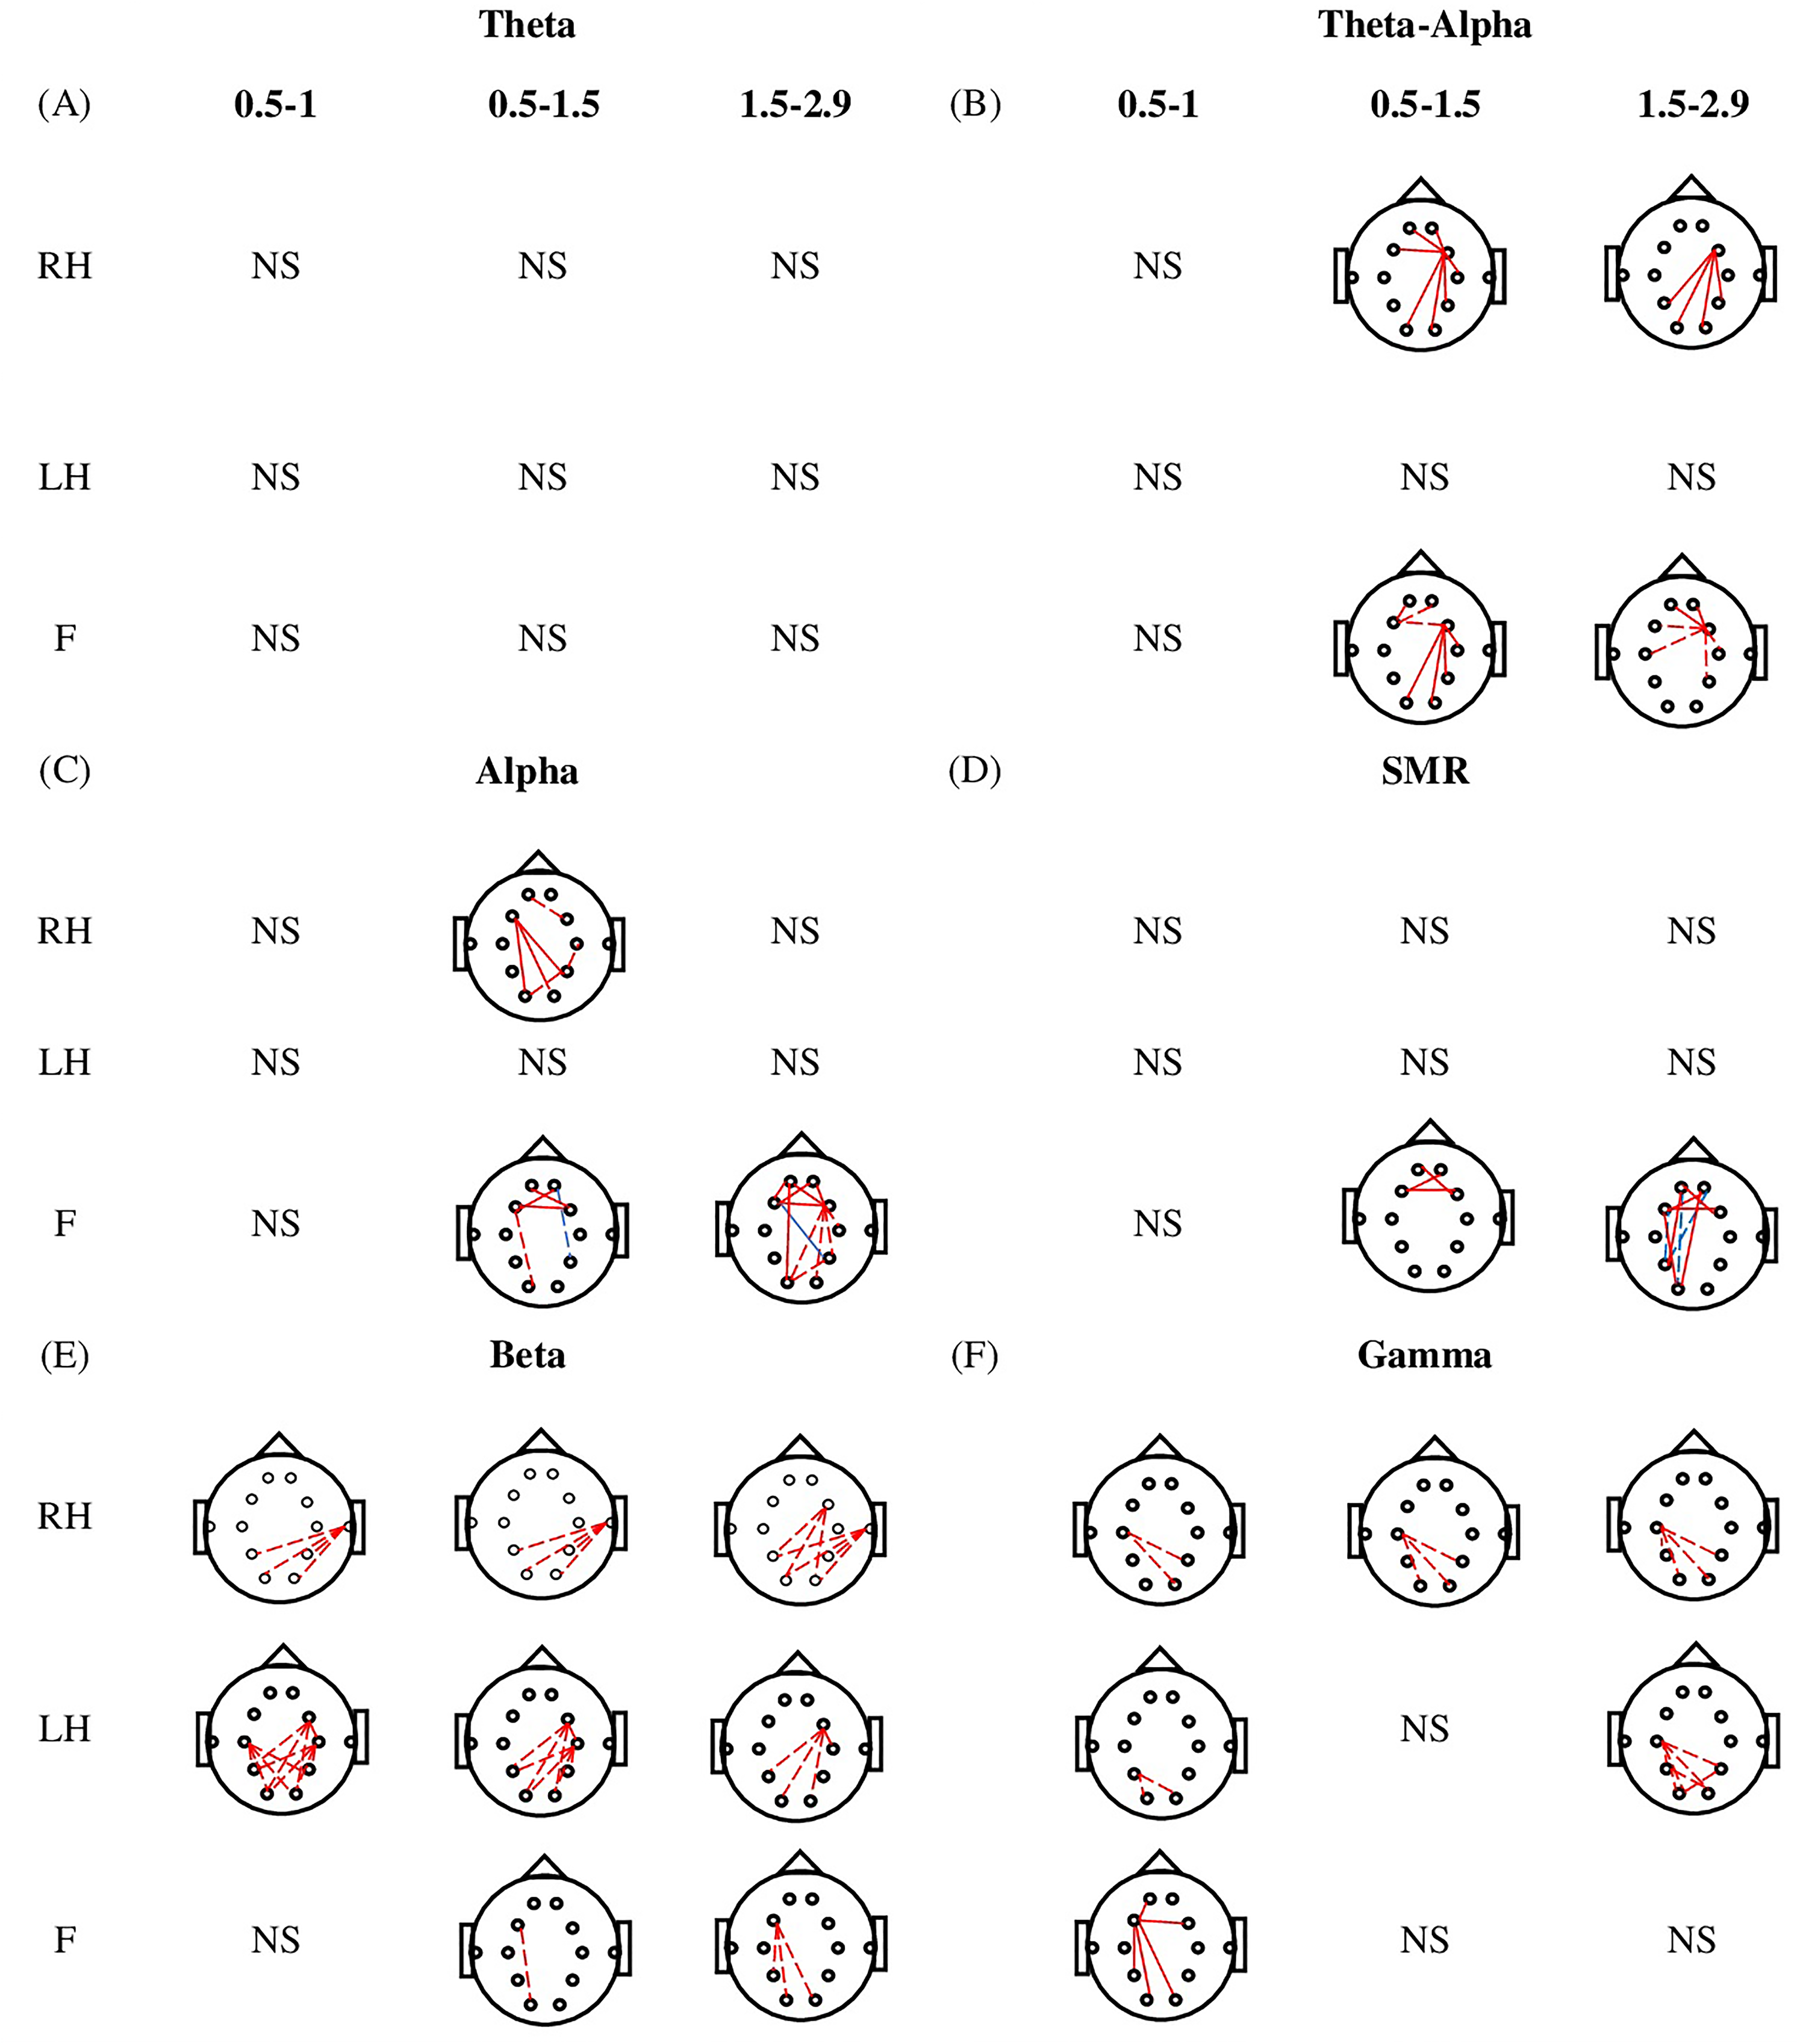
Comparison of functional connectivity strength between able bodied (AB) and patient with no pain (PNP) during motor imagery (MI) of right hand (RH), left hand (LH), and foot (F) for different time periods (0.5-1.0, 0.5-1.5, and 1.5-2.9 s) in (A) theta, (B) TAO, (C) alpha, (D) SMR, (E) beta, and (F) gamma. Solid lines indicate the synchronization in connectivity while dashed lines indicate the desynchronization in connectivity. Similarly, the red color demonstrates the increase de/synchronization in the PNP group while the blue line demonstrates the decrease de/synchronization in the PNP group. Moreover, NS represents the nonsignificant results.
Figure 3 depicts the strength of FC between AB and PWP during MI of RH, LH, and F for 0.5 to 1.0, 0.5 to 1.5, and 1.5 to 2.9 s time periods. In the theta band (Figure 3A), the AB and PWP groups show desynchronization, which is stronger in the PWP group within posterior and between central-frontocentral regions during MI of RH at 0.5 to 1 s. During MI of LH, the PWP group showed stronger desynchronization between frontocentral-posterior and central-posterior regions at 0.5 to 1 s. Moreover, during MI of F, the PWP group showed strong synchronization while the AB group showed desynchronization between frontal-posterior regions at 0.5 to 1 and 0.5 to 1.5 s. In the TAO band (Figure 3B), the PWP group showed stronger desynchronization between frontocentral-posterior at 1.5 to 2.9 s, between frontal-posterior and within the posterior region at 0.5 to 1 s during MI of RH and LH, respectively. In the alpha band (Figure 3C), during MI of F, PWP group showed strong desynchronization compared to AB group within frontal at 1.5 to 2.9 s, between frontal-posterior and temporo-posterior regions at 0.5 to 1.5 s. In the beta band (Figure 3E), during MI of RH and LH, AB and PWP both groups show desynchronization, which is stronger in the PWP group within posterior regions. In the gamma band (Figure 3F), during MI of F, the PWP group showed weaker desynchronization at 0.5 to 1 s followed by stronger desynchronization at 0.5 to 1.5 and 1.5 to 2.9 s between frontal-posterior regions.
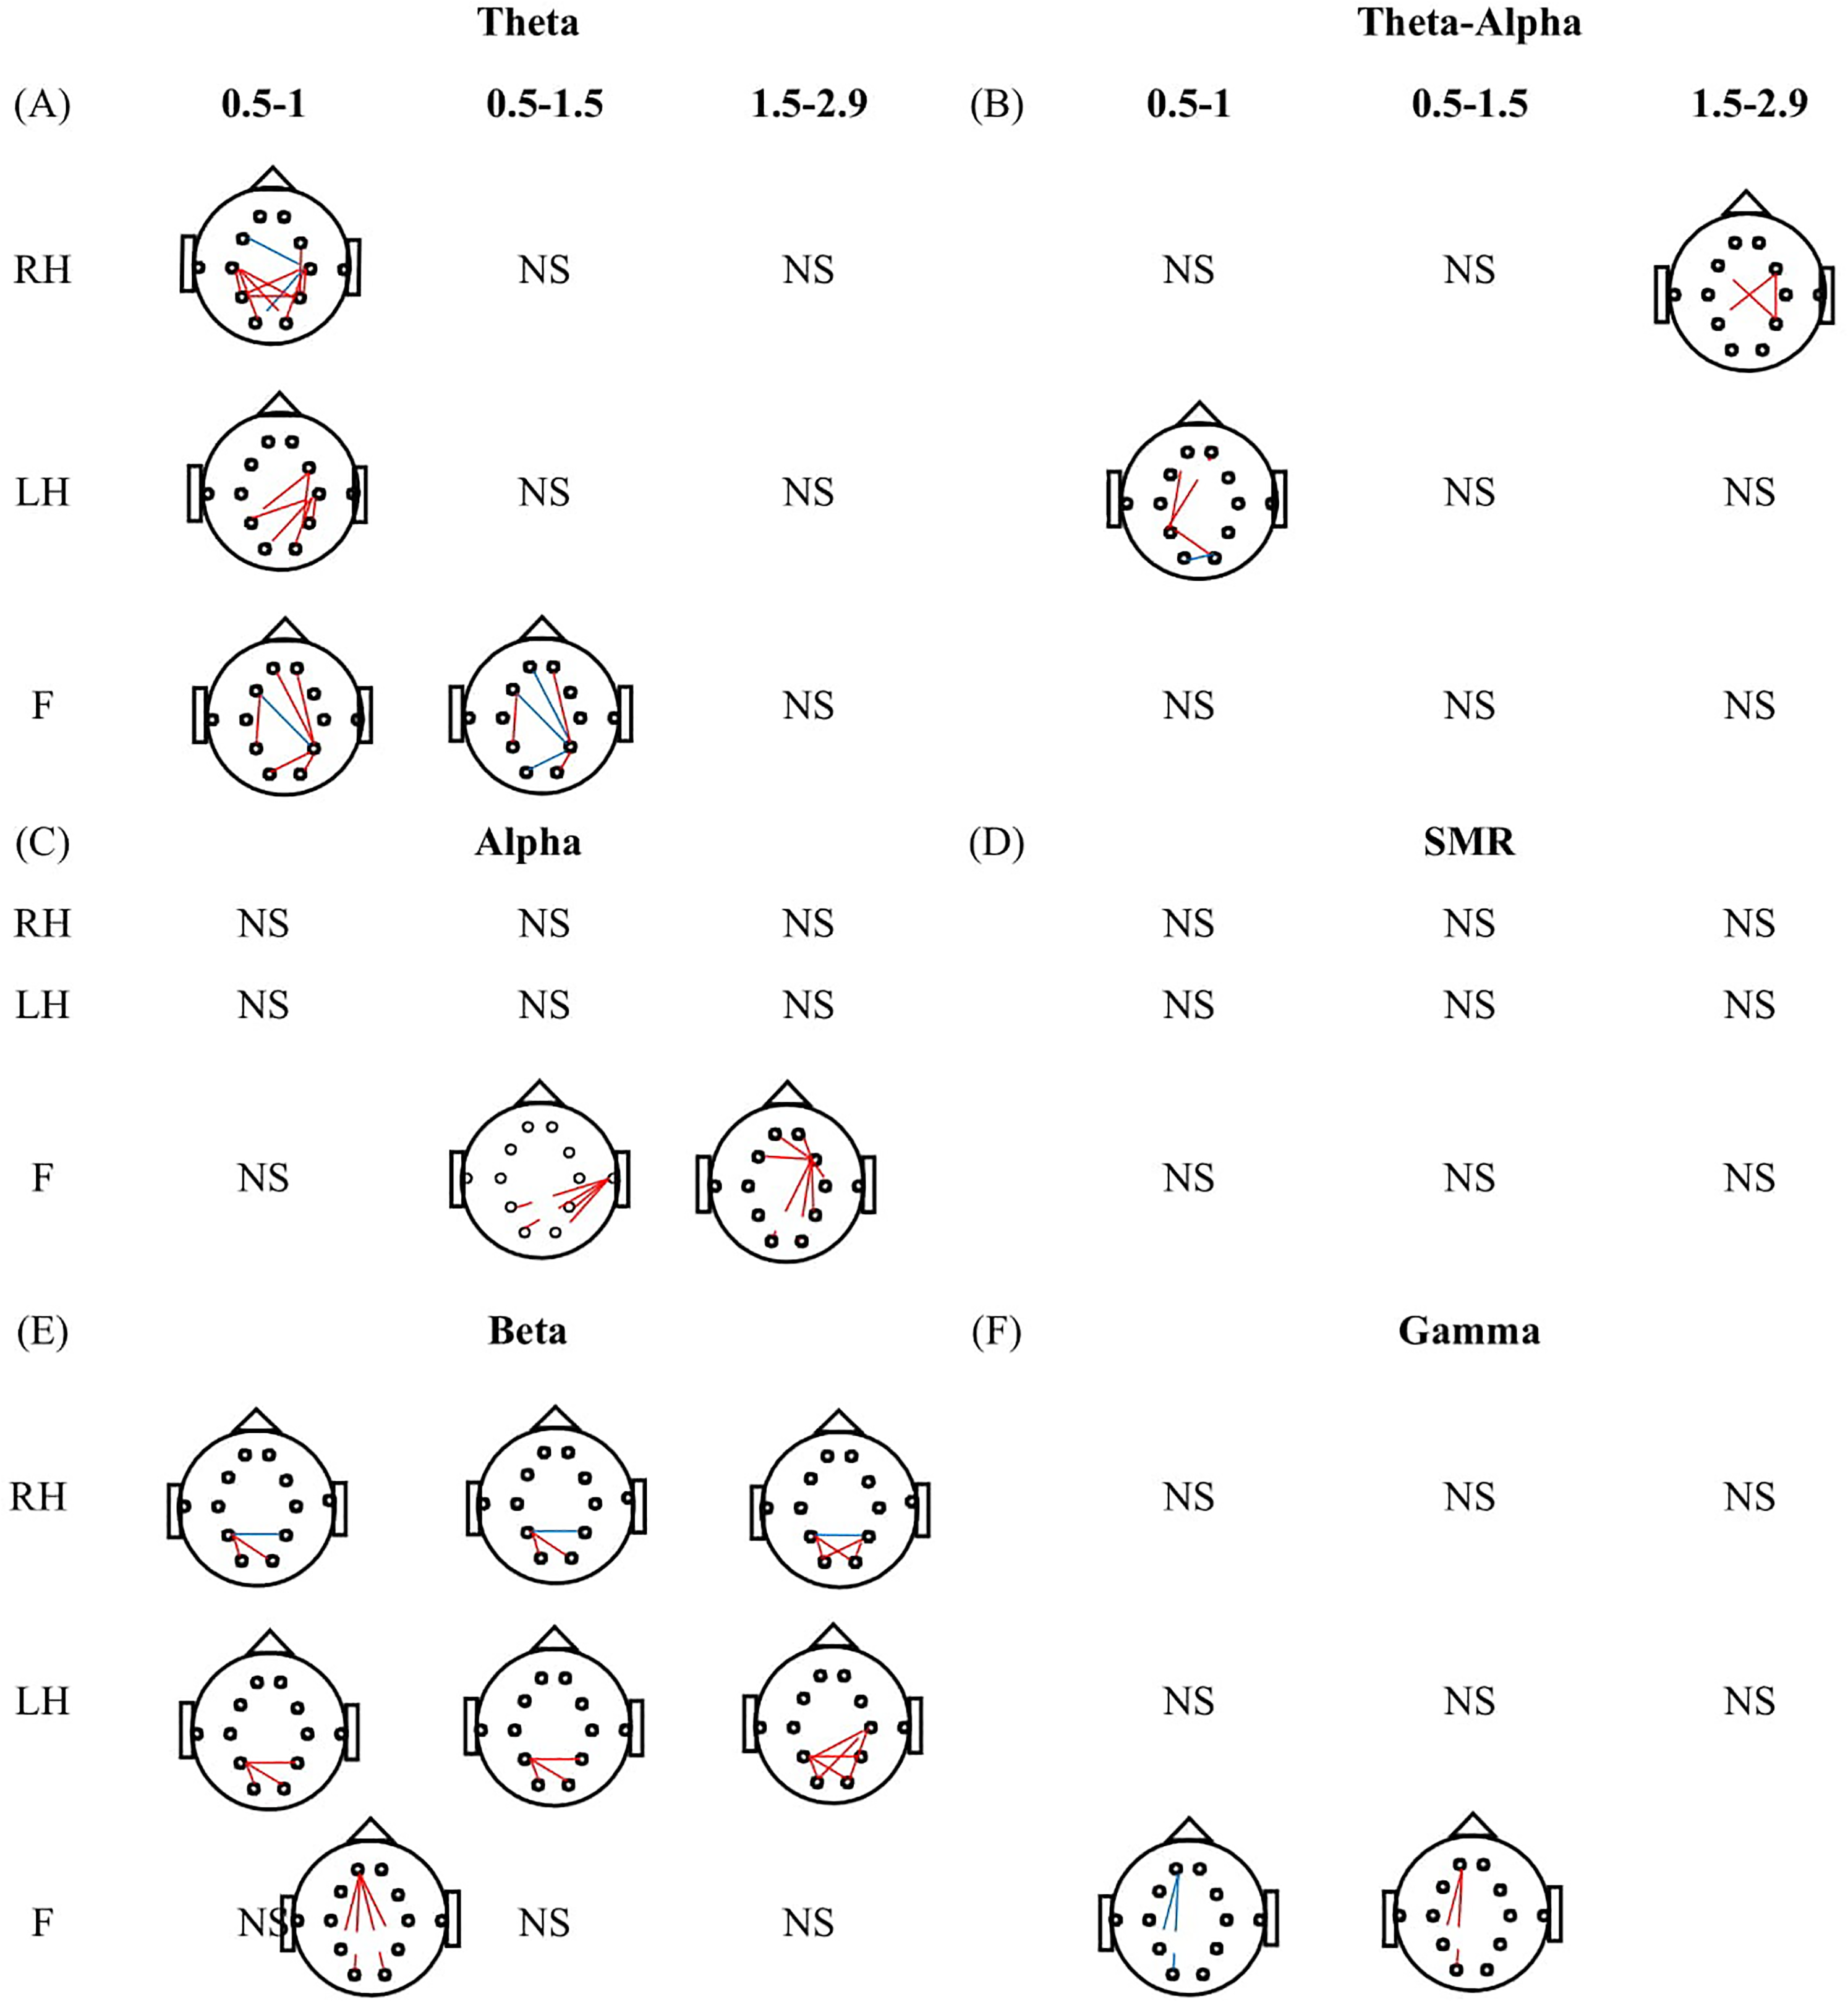
Comparison of functional connectivity strength between able bodied (AB) and patients with pain (PWP) during motor imagery (MI) of right hand (RH), left hand (LH), and foot (F) for different time periods (0.5-1.0, 0.5-1.5, and 1.5-2.9 s) in (A) theta, (B) TAO, (C) alpha, (D) SMR, (E) beta, and (F) gamma. Solid lines indicate the synchronization in connectivity while dashed lines indicate the desynchronization in connectivity. Similarly, the red color demonstrates the increase de/synchronization in the PWP group while the blue line demonstrates the decrease de/synchronization in the PWP group. Moreover, NS represents the nonsignificant results.
Figure 4 illustrates the comparison of FC strength between PNP and PWP while performing MI of LH, RH, and F for 0.5 to 1.0 s, 0.5 to 1.5 s, and 1.5 to 2.9 s time periods. In the theta band (Figure 4A), the PWP group showed weaker desynchronization within posterior and between frontal-posterior regions during MI of RH at 0.5 to 1.0 s and 0.5 to 1.5 s. During MI of LH, the weaker desynchronization between frontal-posterior regions is noticed at t = 0.5 to 1.0 s. Moreover, during MI of F, the strength of desynchronization observed in the PWP group is weaker than the PNP group at 1.5 to 2.9 s. These differences are found within frontal and between frontal-posterior regions. In the TAO band (Figure 4B), during MI of RH, the PWP group showed stronger desynchronization between frontal-posterior, central-posterior, and within posterior regions at 0.5 to 1.0 s, 0.5 to 1.5 s, and 1.5 to 2.9 s. During MI of LH, the PWP group showed weaker desynchronization between frontal-posterior and within posterior regions at 0.5 to 1 s and 0.5 to 1.5 s. During MI of F, PWP shows stronger desynchronization within the frontal and between frontal-parietal regions. In the alpha band (Figure 4C), during MI of RH, at 0.5 to 1.5 s PWP group showed stronger desynchronization between frontocentral-parietal and central-posterior regions. Moreover, during MI of F at 0.5 to 1 s PWP group showed weaker desynchronization between frontal-posterior and within frontal regions. In the SMR band (Figure 4D), during MI of RH at 0.5 to 1.5 s, the PWP group showed stronger desynchronization between temporal-posterior regions. Moreover, during MI of LH at 1.5 to 2.9 s, both groups showed synchronization which is weaker in the PWP group between frontocentral-posterior regions. In the beta band (Figure 4E), during MI of RH, both groups showed desynchronization between frontocentral-posterior (0.5-1 s) and central-posterior regions (0.5-1.5 s) which is strong in the PWP group. Moreover, during MI of F, the PWP group showed strong synchronization compare to the PNP group within frontal (0.5-1.5 s) and between frontal-posterior (1.5-2.9 s) regions.
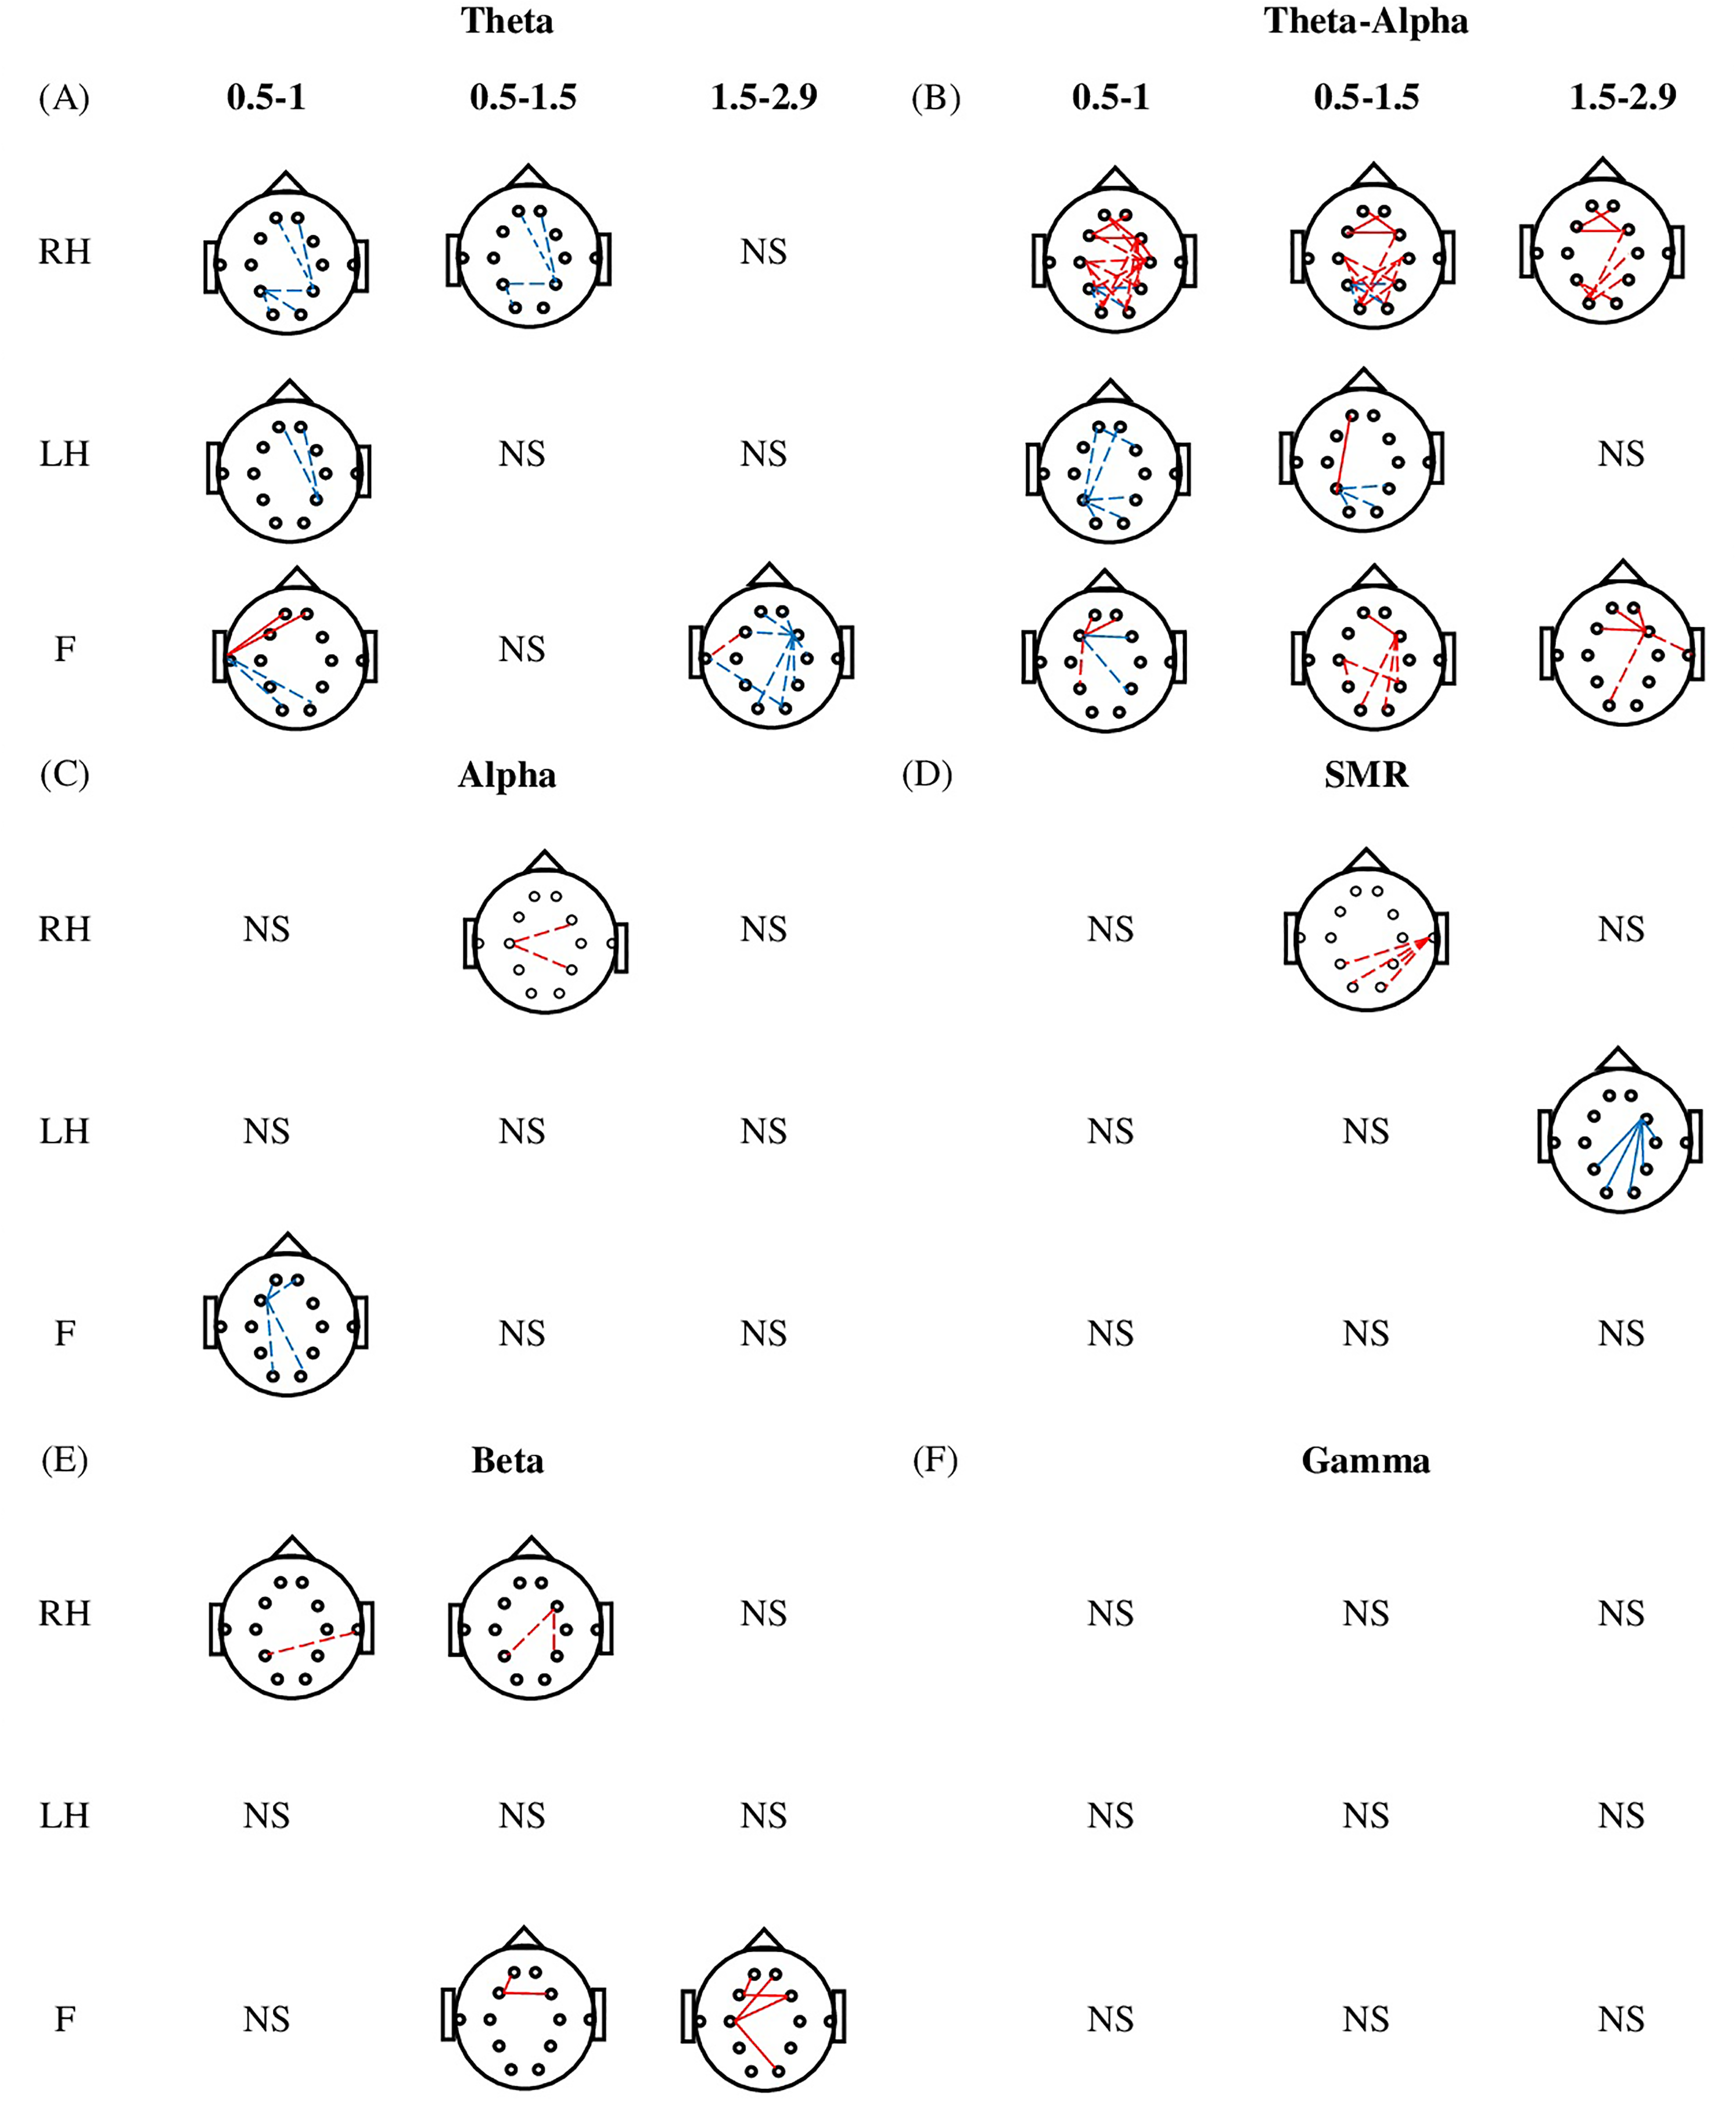
Comparison of functional connectivity strength between patient with no pain (PNP) and patient with pain (PWP) during motor imagery (MI) of the right hand (RH), left hand (LH) and foot (F) for different time periods (0.5-1.0, 0.5-1.5, and 1.5-2.9 s) in (A) theta, (B) TAO, (C) alpha, (D) SMR, (E) beta, and (F) gamma. Solid lines indicate the synchronization in connectivity while dashed lines indicate the desynchronization in connectivity. Similarly, the red color demonstrates the increase de/synchronization in the PWP group while the blue line demonstrates the decrease de/synchronization in the PWP group. Moreover, NS represents the nonsignificant results.
Figure 5 illustrates the number of significant functional connections observed when comparing PLV between groups (AB vs PNP, AB vs PWP, and PWP vs PNP) in theta, TAO, alpha, SMR, beta, and gamma frequency bands during MI of RH, LH, and F. In the theta band, the maximum number of connections are noticed when AB is compared with PWP and PNP is compared to PWP for RH and F MI tasks. While in the TAO band, it is observed when AB is compared with PNP and PNP with PWP groups while performing MI of LH and RH. Likewise, in the alpha band, it is observed for all group combinations for F MI tasks. In the SMR band significant differences are observed during groups comparison of PNP and PWP while performing MI of RH. However, in the beta and gamma bands, significant differences are observed only for AB and PNP groups comparison while performing MI of LH (beta) and RH (gamma). Regarding networks involved in altered connectivity, it is evident that the frontal region showed a connection with itself and other regions mainly during MI of F while posterior regions showed connections with itself and other regions predominantly during MI of RH and LH.
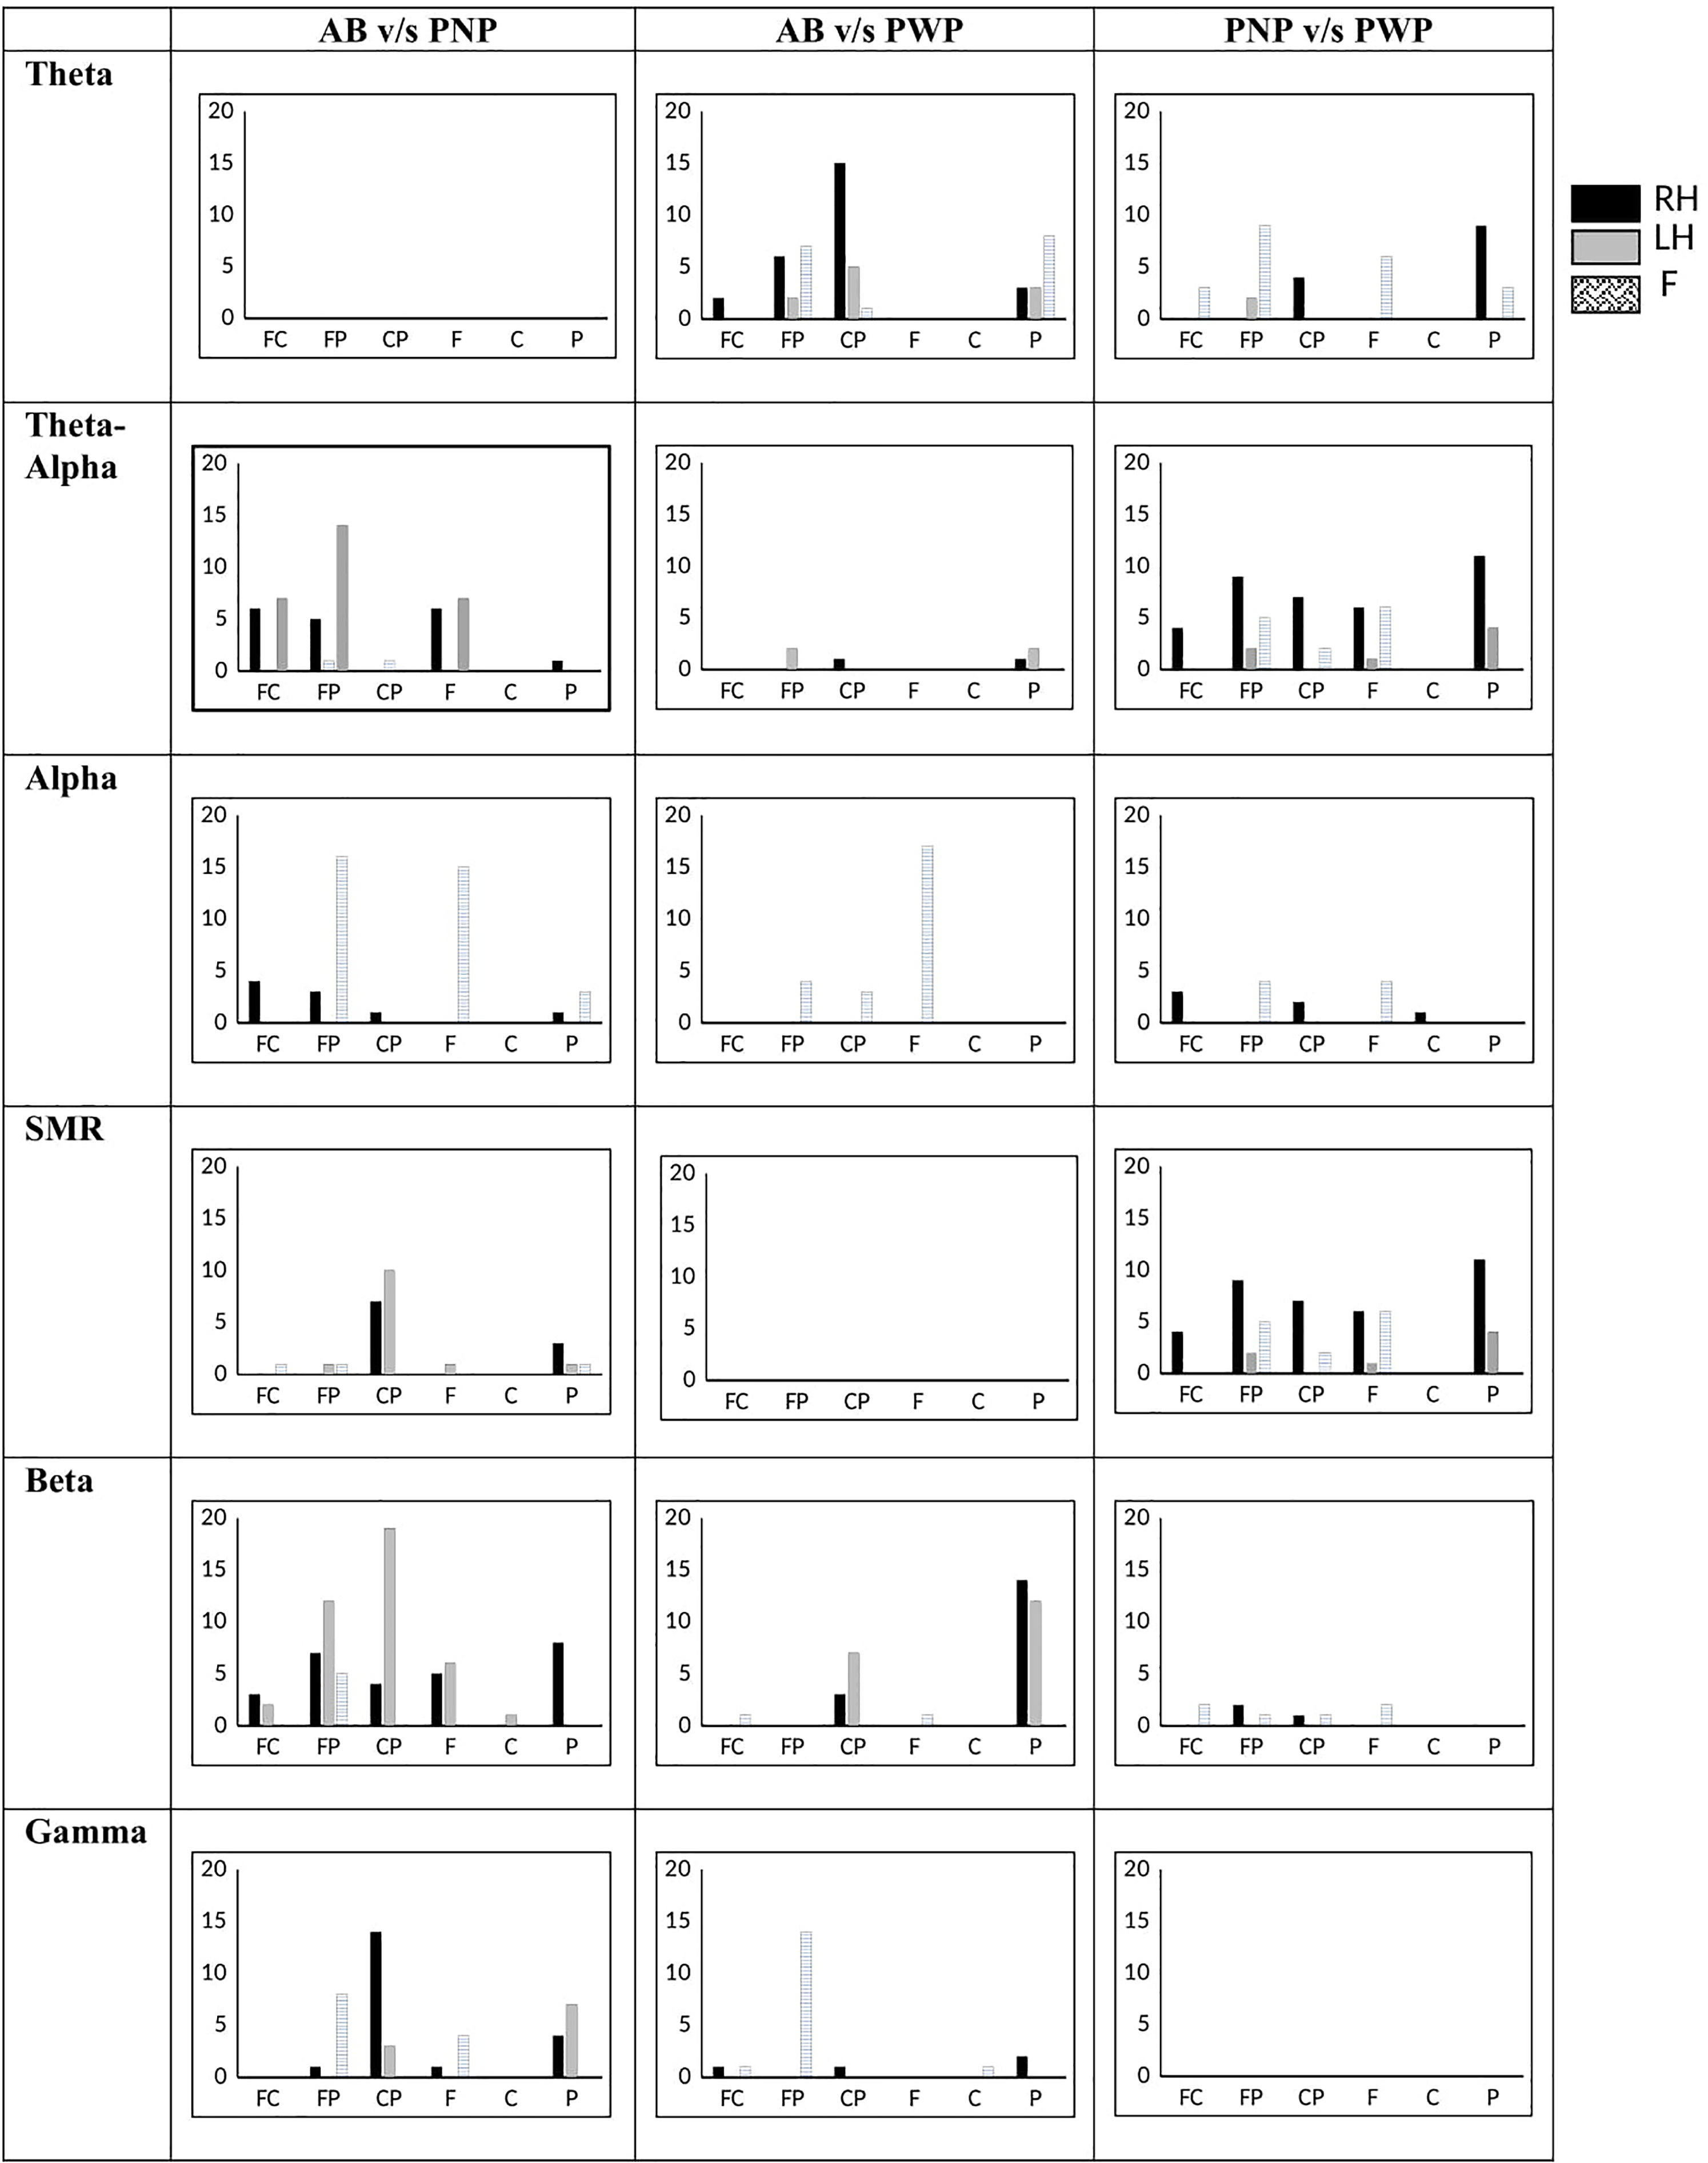
Number of functional connections in able bodied (AB), patient with no pain (PNP) and patient with pain (PWP) between frontal-central (FC), frontal-posterior (FP), central-posterior (CP), within frontal (F), within central (C) and within posterior (P) in theta, alpha, beta, and gamma bands.
Figure 6 depicts the local efficiency between AB and PNP, AB and PWP, and PNP and PWP during MI of F for 0.5 to 1.0 s time period. Gray-filled circles represent a significant decrease in local efficiency while black-filled circles represent an increase in local efficiency. In the theta band, the comparison between PNP and PWP groups shows that PWP exhibits a significant increase in local efficiency in the frontal, fronto-central, central, centro-parietal, and posterior regions with a large effect size (d>0.8). In the TAO band, the PNP group showed a low value of local efficiency in frontal, central, and posterior regions with a large effect size (d>0.8) as compared to the other 2 groups. No significant difference in local efficiency was observed between HV and PWP groups. Moreover, in alpha, SMR, beta, and gamma bands changes in local efficiency were observed in the occipital region only.
Comparison of local efficiency between able bodied (AB) and patient with no pain (PNP), able bodied (AB) and patient with pain (PWP) and patient with no pain (PNP) and patient with pain (PWP) (P = .05) during MI of foot (F) for time period 0.5 to 1.0 s in theta, TAO, alpha, SMR, beta, and gamma. Electrode locations marked in black indicate the increase in local efficiency whereas, electrode locations marked in grey represent the decrease in local efficiency.
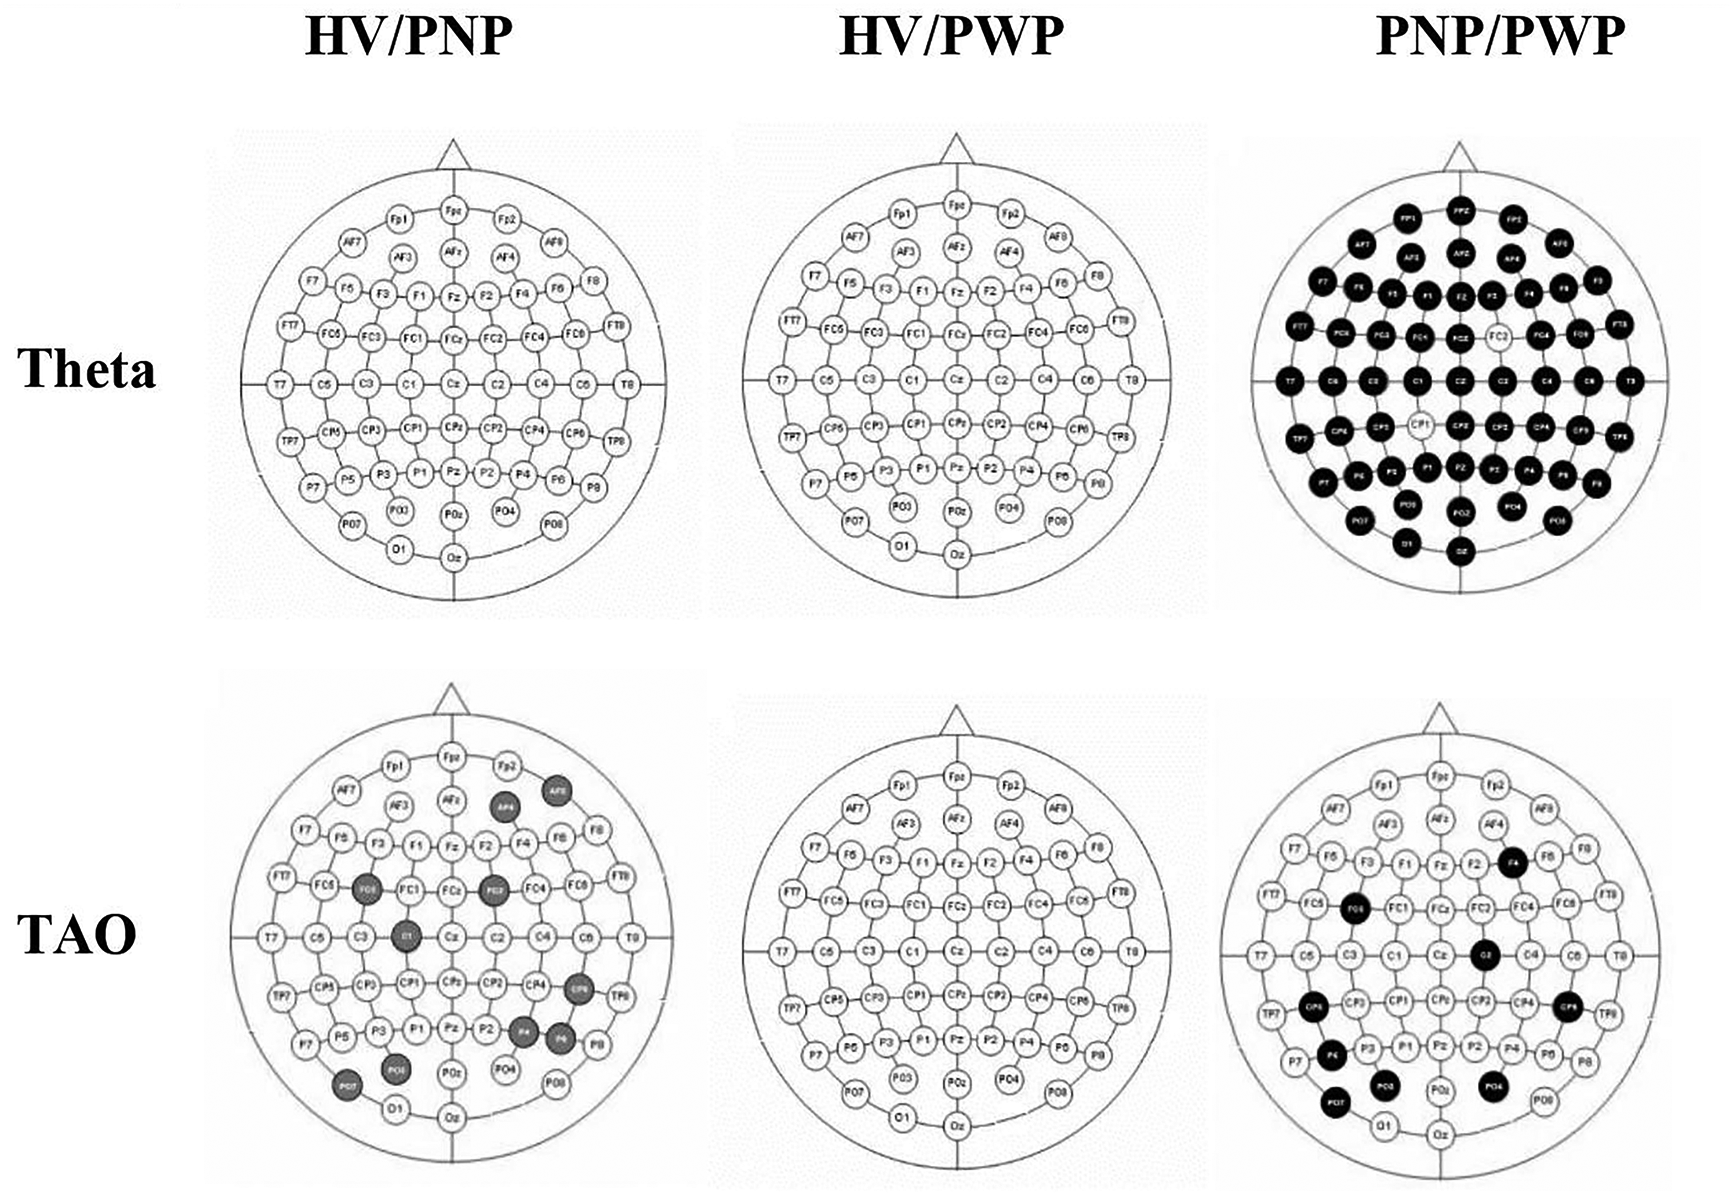
Figure 7 shows the comparison of cluster coefficient values between each 2 groups (HV vs PNP, HV vs PWP, and PNP vs PWP) during MI of paralyzed and painful limb, the, F for a time period 0.5 to 1.0 s in the theta, TAO, alpha, SMR, beta, and gamma bands. Gray-filled circles represent a significant decrease in cluster coefficient values while black-filled circles represent an increase in the cluster coefficient values. A global significant decrease in cluster coefficient value, with an effect size greater than 0.8, in the beta and gamma bands can be noticed in both PNP and PWP groups as compared to the HV group. However, this significant reduction in cluster coefficient values is restricted over the sensory-motor cortex in the theta and TAO bands in the PNP group as compared to HV. Comparing PWP with the HV group, no significant difference could be noticed. Comparing PWP with the PNP group, a significant increase in cluster coefficient values could be observed, mainly over the sensory-motor cortex, in the TAO band only, having an effect size greater than 0.8.
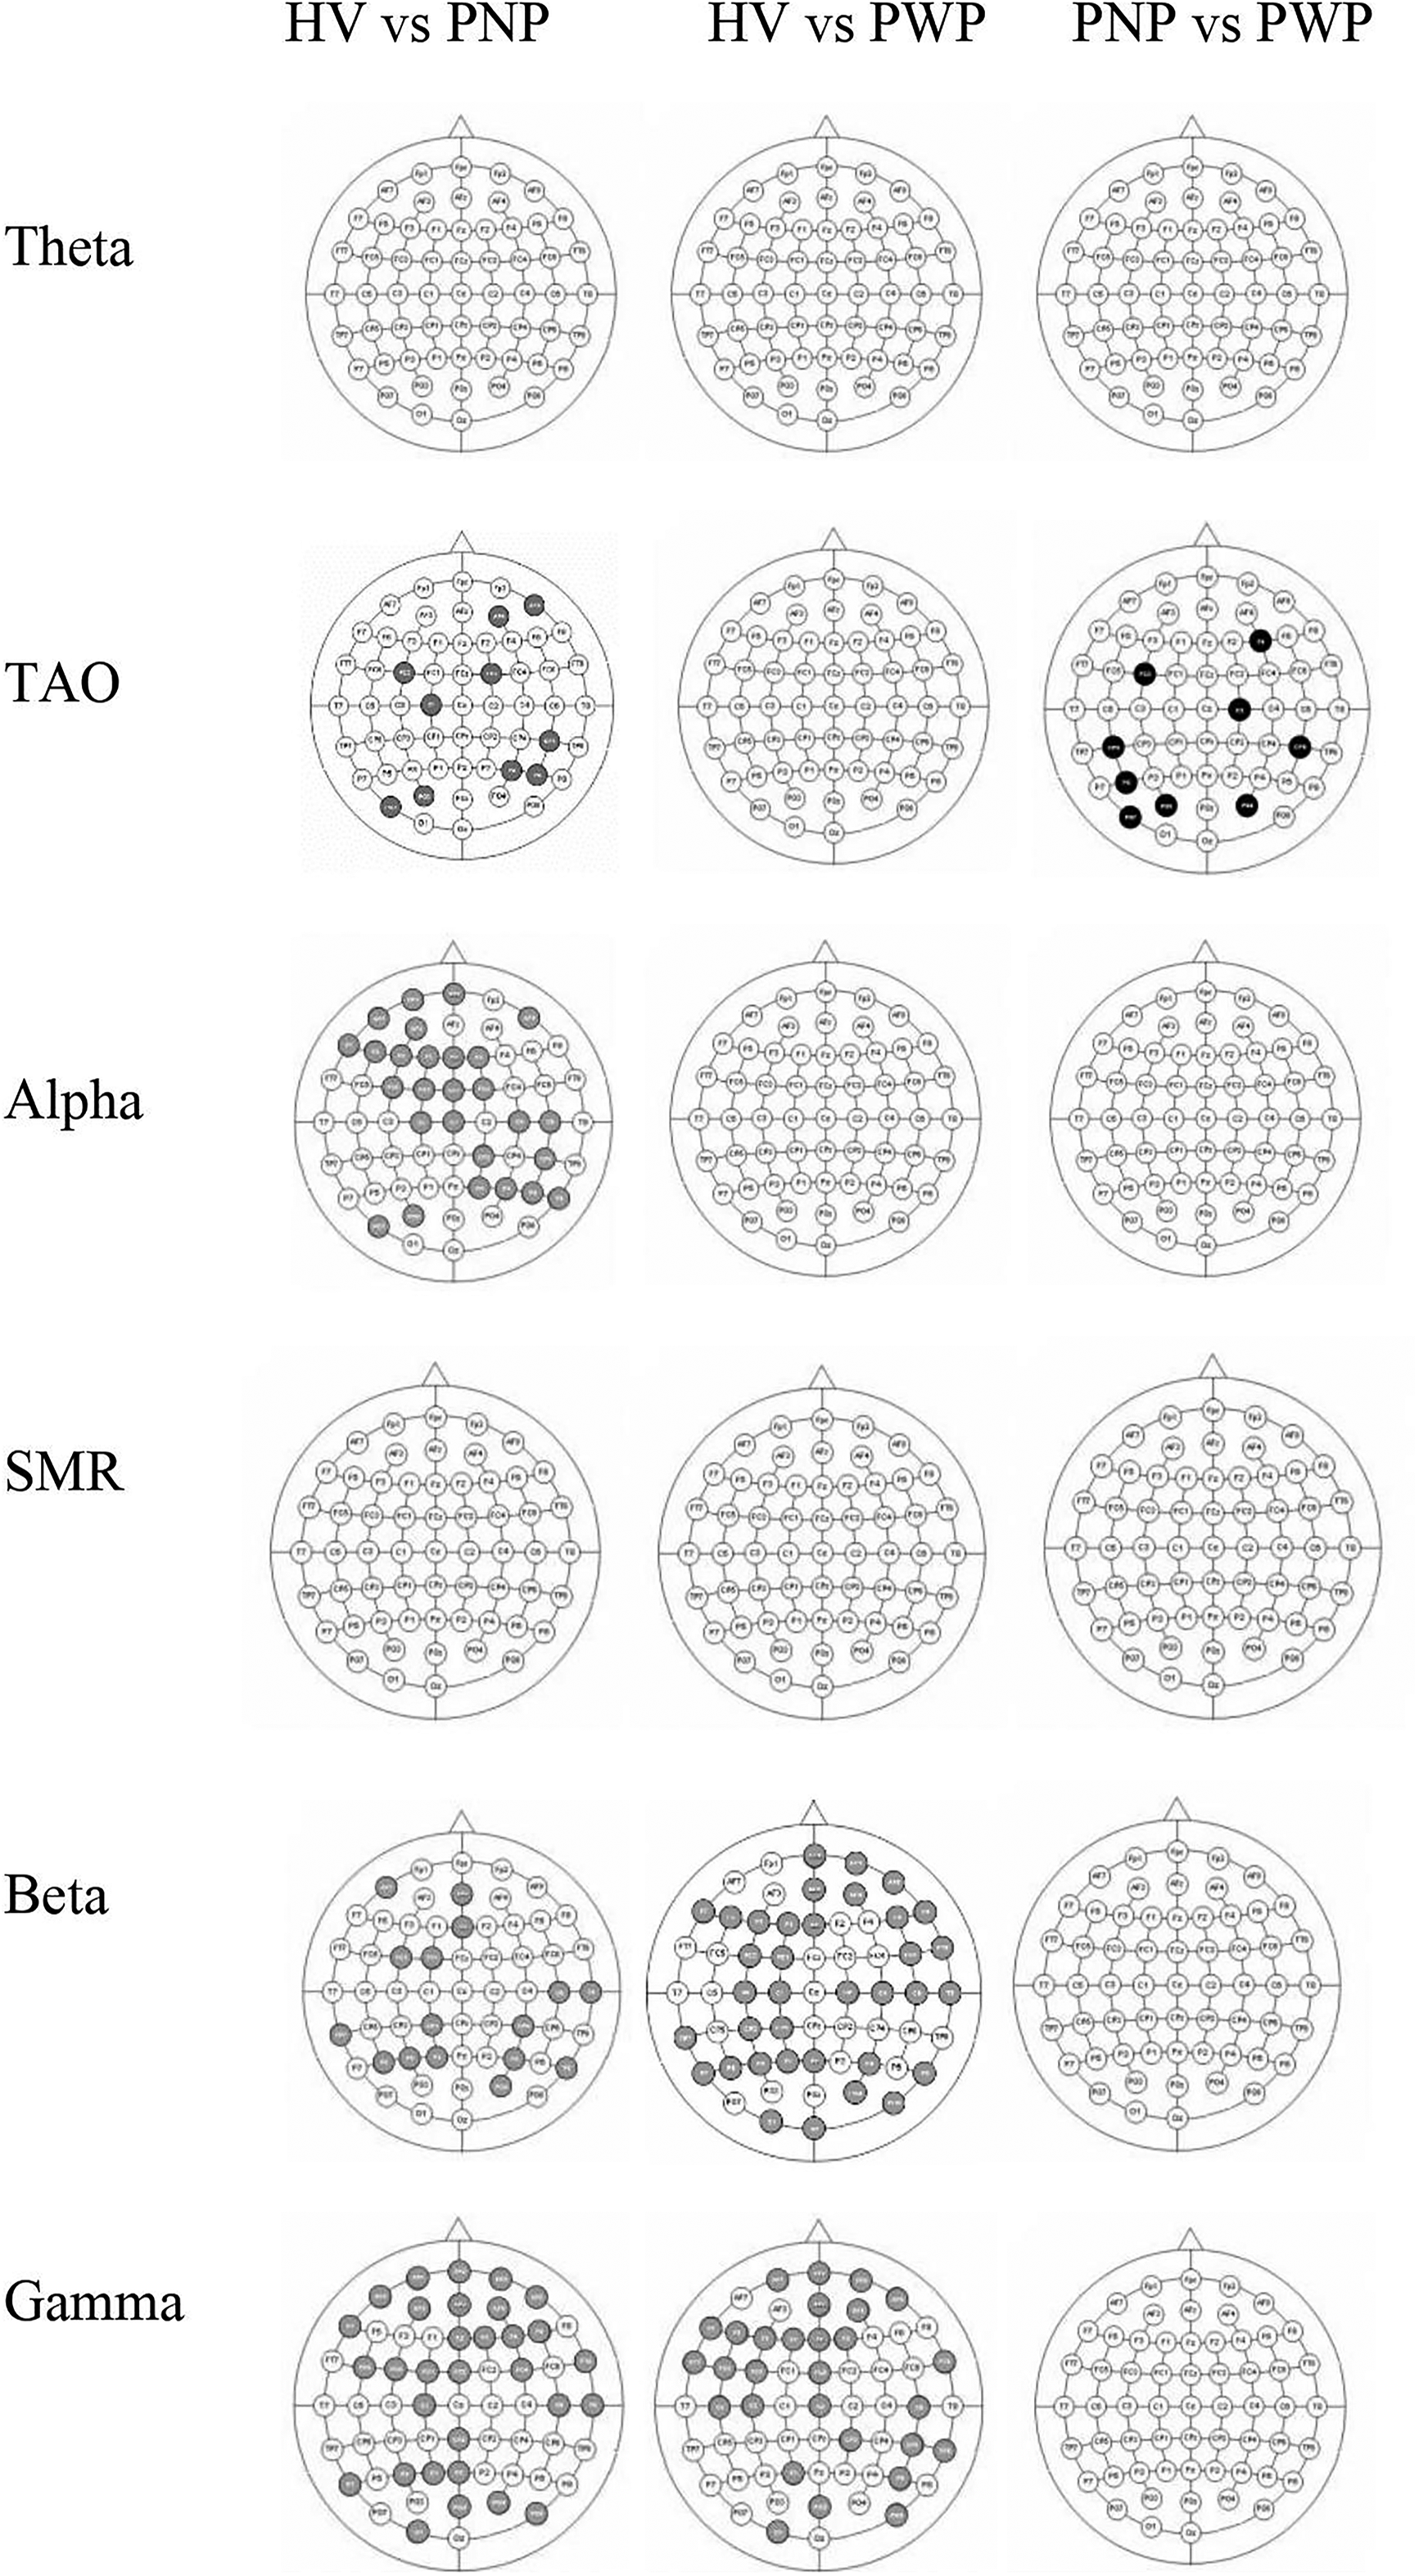
Comparison of cluster coefficients between able bodied (AB) and patient with no pain (PNP), able bodied (AB) and patient with pain (PWP) and patient with no pain (PNP) and patient with pain (PWP) (P = .05) during MI of foot (F) for time period 0.5 to 1.0 s in theta, TAO, alpha, SMR, beta, and gamma. Electrode locations marked in black indicate the increase in cluster coefficients, whereas electrode locations marked in grey represent the decrease in cluster coefficients.
Discussion
The objective of this study is to find altered brain networks connectivity due to SCI only and due to NP following SCI. Prominent changes are observed within the sensory-motor network, that is, (between central-posterior and between frontocentral-posterior regions) during MI of upper dominant and nonpainful limb and in the fronto-parietal network during MI of paralyzed and painful limb. We found that connectivity changes in the theta and SMR bands are mainly due to pain. However, the connectivity changes due to injury are mainly found in the alpha, beta, and gamma bands during MI of painful and nonpainful limbs. Furthermore, global increase in local efficiency in the theta band is mainly an effect of pain while localized, restricted to sensory-motor cortex, decrease in local efficiency in the TAO band is mainly an effect of an injury.
A study conducted on SCI people found that alteration in connectivity strength and distinction in functionally connected regions are changed with time since injury. 13 Moreover, studies conducted on pain patients reported an association of modified connectivity with pain intensity and perception.8,10,12 Since, in our study, there are 2 distinct groups separating injury and pain. Therefore, the strongest connectivity decreases in the pain group as compared to the other 2 groups suggest that altered connectivity might not only be related to the onset of injury but also due to the development of pain. Past studies on SCI subjects do not separate the effect of NP when studying brain connectivity and are mainly based on fMRI.10-12,18-23 EEG studies as compared to fMRI studies provide frequency-specific changes.3,16,17 Hence, this is the first study showing that connectivity changes in the theta and SMR bands may be a biomarker of NP in people with SCI. Whilst altered connectivity in the alpha, beta, and gamma bands may be considered as a consequence of SCI only.
The strong connectivity strength decrease within the sensory-motor network of the ascending nociceptive pathway in both SCI groups is in line with findings reported in fMRI studies.14,38,39 This may be associated with a posterior shift of the sensory-motor cortex or invasion of the cortical representation of the affected limb (ie, paralyzed limb) by unaffected limb (ie, upper limbs). However, it is required to perform a study on tetraplegic patients to confirm. The decrease in connectivity within the sensory-motor networks demonstrates loss in communication between sensory and motor cortices.6,7 This means SCI participants need a lot of attention to understand sensory stimuli and to perform tasks. This is further supported by a decrease in cluster coefficient values in the PNP group as compared to the other 2 groups. Altered sensorimotor connectivity is also a direct consequence of lifestyle changes in motor behavior following pain. Therefore, the decreased sensorimotor connectivity may be primarily attributed due to top-down control of descending pain pathways.
The salience network (SN) has a role in both task execution and pain processing.40‐42 The role of SN in terms of task is to activate the executive network and deactivate the default mode network (DMN) during the visual or auditory stimulus. 43 The SN is strongly activated in the rest to task switch state as compared to the task to task switch state. 44 SN is categorized as the frontal region for this study.43,45‐47 A study reported a strong association of chronic pain (CP) with alteration in SN. 40 Similarly, the study reported significant increased SN connectivity due to higher pain intensity. 48 The increased connectivity observed within the frontal and fronto-central regions demonstrates that the PWP group seeks strong attention during the execution of paralyzed and painful limbs as compared to MI of nonparalyzed and nonpainful limbs. Hence, this altered connectivity in SN demonstrates modulation of interoceptive brain processes such as homeostatic regulation of body physiology controlled by integration of internal and external stimuli.
Compound limb MI causes higher activation and coupling of multiple brain networks. 49 A large number of connections together with the increased value of cluster coefficient in the PWP group, in this study, reveals the complexity of the cognitive process and thereby demonstrates that execution of paralyzed and painful limb is a complex task for PWP group. 49 The fronto-parietal network is considered a functional hub that shows connections with several brain regions50‐52 comprising of frontal (Fp1, Fp2; BA10, F3, F4; BA9, FZ; BA8), temporal (F7, BA47), and parietal regions (P3, P4, BA39). 53 Frontal cortex plays an important role in performing and controlling cognitive functions by integrating complex perceptual information from sensory-motor cortices. The interaction within the posterior region is useful for performing higher cognitive functions such as updating postural representations of limbs. 54 It is interesting to note that connectivity differences are the long-range distance (between frontal-posterior regions) during MI of F. The augmented connectivity within and between fronto-parietal network has been reported in pain and diseases (depression, schizophrenia, anxiety) compromising cognitive functions.55‐60 The altered connectivity within frontal and between frontal-parietal regions has also been reported in patients with different types of CPs.7,14,15,61‐63 Therefore, the augmented connectivity, during MI of F limb in both injury and pain groups, reported in this study is either due to injury, pain perception, or impaired cognitive functions. Further, the connectivity changes between frontal-posterior regions may reflect involvement of multiple regions for information exchange.
The DMN comprises of medial prefrontal cortex and medial posterior cortex 64 (ie, FP1, FP2, FPz, F3, F4, F7, Fz, T3, T4, P3, and P4). 53 The DMN which is part of dynamic pain connectome and large-brain network is active in resting-state while inactive during task state. However, few studies reported activation of DMN in task execution when cognitive load increases.65‐67 Studies also reported decreased connectivity in DMN during task performance.65‐70 The connectivity is strongly attenuated in attention-demanding task-task initiation 71 because DMN is coupled with fronto-parietal network during task initiation.70,72‐74 The connectivity changes in DMN found in this study during MI of F demonstrate that the PWP group faced difficultly in task performance but are highly engaged in the attention-demanding task. In other words, the patients’ focus may be shifted during on-going tasks towards pain or injury. 75 Therefore, the increased local efficiency in the pain group may reflect increased activity in pain matrix neural processing.
The study also reported that the long-range connectivity between frontal-parietal regions is observed when visual and sensory-motor brain areas are involved in executing motor tasks that require visual stimulus which is strong in the theta band. 76 This varied connectivity may reflect sustained attention to bodily sensations and hypervigilance to somatic sensations. The pain processing region establishes the relationship between pain and decision making relevant to pain. Therefore, the additional burden of decision making and processing of desired action responses with CP distractors is reflected with increased connectivity between frontal-posterior regions. 21 The augmented FC in the posterior region (part of pain matrix) reported in this study is likely to reflect expansion due to hyper-perfusion of the signals as reported in fibromyalgia patients. 77 CP causes a paradigm shift towards augmented activation in the brain related to cognitive affecting processing.
A large number of nodes are observed in our study during MI of F which demonstrate the involvement of a larger neural network in information processing. Multiple nodes are formed at frontal and posterior regions when comparing SCI patients with AB, while at the frontal side only when comparing both injury groups. However, previous studies reported the formation of a large number of nodes only at the frontal region in SCI patients as compared to AB.16,21 In an attempt to move paralyzed and painful limbs, more cortical resources are utilized in order to restore the sensation and structural alignment of the limb.18,78 It means that SCI patients showed functional independence of motor cortices for paralyzed limb movement. The formation of nodes at the posterior side suggests an enhancement in visual-related sensory processing after the loss of spinal afferents.50‐52 This concludes that the formation of nodes at the posterior region might be due to injury while the formation of nodes at the frontal region might be due to pain.
Studies reported the theta band overactivation of the pain matrix associated with thalamocortical dysrhythmia (TCD).79‐85 Moreover, studies reported that the abnormal theta oscillation is the point of interest in various neuropsychiatric disorders, such as in NP thalamic theta oscillation deafferentation entrain thalamocortical loop.82‐85 Thalamocortical loop plays a vital role in encrypting information of sensory-discriminative properties of painful stimuli. Hence, in this study, altered the theta band connectivity, formation of a large number of nodes, and large local efficiency in the theta band reported in the pain group as compared to the other two groups strongly support the concept of TCD.82‐85
This study has some limitations. First, we only considered the comparison of pain presence or absence, irrespective of pain intensity which can significantly affect FC. Second, the study recruit only paraplegic patients with CNP, therefore, the findings cannot be generalized for all SCI patients having pain. Third, we analyzed FC of SCI patients without considering duration of injury and pain which can be potential parameters to impact FC.
In conclusion, this study found altered connectivity in fronto-parietal with global increase in local efficiency and modified sensory-motor networks evident with a decrease in cluster coefficient values during MI of F (painful and paralyzed limb) which can be used as a potential biomarker for the diagnosis of pain following SCI. Altered brain connectivity in the theta bands is associated with pain only, whereas the gamma and beta frequency bands are associated with injury only. It is also observed that the number of nodes in the PWP group is more in the theta band during MI of paralyzed and painful limbs. The findings of our study can be used for designing and setting connectivity-based protocols of neuromodulation devices largely used in the field of BCI, neuro-stimulation, neurorehabilitation, neuro-feedback software design, and assistive technologies for SCI and pain patients.
Supplemental Material
sj-docx-1-eeg-10.1177_15500594211051485 – Supplemental material for Brain Networks With Modified Connectivity in Patients With Neuropathic Pain and Spinal Cord Injury
Supplemental material, sj-docx-1-eeg-10.1177_15500594211051485 for Brain Networks With Modified Connectivity in Patients With Neuropathic Pain and Spinal Cord Injury by Muhammad A. Hasan, Parisa Sattar, Saad A. Qazi, Matthew Fraser, and Aleksandra Vuckovic in Clinical EEG and Neuroscience
Footnotes
Acknowledgments
This work was supported by the MRC grant G0902257/1, National Center of Artificial Intelligence. The authors thank Professor Bernard Conway, the University of Strathclyde for lending EEG equipment and to Dr Purcell and Dr Mclean for choosing participants of the study, and to all participants for taking part.
Supplementry Material
Supplementry material in this article is available online.
References
Supplementary Material
Please find the following supplemental material available below.
For Open Access articles published under a Creative Commons License, all supplemental material carries the same license as the article it is associated with.
For non-Open Access articles published, all supplemental material carries a non-exclusive license, and permission requests for re-use of supplemental material or any part of supplemental material shall be sent directly to the copyright owner as specified in the copyright notice associated with the article.