
Abstract
Objectives
Assessment of sensorimotor cortex and tracts degeneration using novel diffusion tensor imaging (DTI) templates in patients with chronic spinal cord injury (SCI) and its correlation with clinical and neurophysiological findings.
Methods
Sex and age-matched 29 patients with chronic SCI (paraplegic: p-SCI; tetraplegic: t-SCI) and 29 healthy controls underwent neurophysiological assessment including motor evoked potentials (MEP). DTI was performed on 3 T magnetic resonance imaging scanner and postprocessed using Human Motor Area and Sensorimotor Area Tract Templates. DTI parameters were compared using analysis of covariance with post hoc Scheffé and Bonferroni corrections. Spearman’s rank test was used for correlations with P < .05 considered significant.
Results
Compared to controls, all SCI patients showed significantly lower fractional anisotropy (FA) in several tracts (primary motor [M1], somatosensory [S1], pre-supplementary motor area [preSMA], and dorsal premotor [PMd]) and cortices (M1, pre-SMA, and S1). There were no differences in DTI parameters between p-SCI and t-SCI or p-SCI and controls. Compared to controls, t-SCI showed significantly decreased FA within M1 and S1 tracts. In t-SCI higher motor scores were associated with higher FA from ventral premotor area (PMv) tracts and cortex; higher sensory scores were associated with higher FA from S1 tracts. Positive correlations were found between MEP amplitudes from rectus femoris muscles and FA for M1, PMd, PMv, pre-SMA, SMA tracts, and PMv cortex.
Conclusions
DTI shows remote degeneration of sensorimotor cortex and supraspinal tracts in SCI correlating with several clinical motor and sensory scores, and MEP parameters. DTI metrics have the potential to become biomarkers of remote degeneration.
Keywords
Introduction
Spinal cord injury (SCI) causes localized destruction of nervous tissue at the site of the primary lesion within the spinal cord. Over time, however, secondary neuronal damage affects adjacent areas and extends to more distant regions, including supraspinal centers, peripheral nerves, and muscles. Anterograde and retrograde degeneration proceeds along the spinal cord white matter tracts, resulting in axonal loss and demyelination. This degeneration has been shown to extend further cranially, involving both white matter and cortical regions of the brain.1-3 Secondary changes in the peripheral nervous and muscular systems following SCI are observed approximately 3 months after the injury, despite the absence of direct damage to the spinal segments below the lesion. 4 Pathological studies in rat models after SCI using confocal microscopy demonstrated that the density of dendritic spines in the motor cortex decreases at 7 days post-injury, with partial recovery by 28 days. This recovery is accompanied by increased spine elongation and filopodium-like protrusions, suggesting synaptic remodeling. These microscopic findings support the occurrence of structural changes in the motor cortex and indicate time-dependent synaptic reorganization after SCI. 5
Remote structural alterations within the brain can be assessed in vivo using different advanced magnetic resonance imaging techniques including diffusion tensor imaging (DTI), which measures the diffusion of water molecules in tissues. DTI provides quantitative information about tissue organization, microstructure, and integrity based on several parameters, such as fractional anisotropy (FA), mean diffusivity (MD), axial diffusivity (AD), and radial diffusivity (RD). 6 FA is the most commonly used DTI metric that seems to reflect the degree of white matter tract packing, myelination, and fiber integrity. On the other hand, MD is an inverse measure of the membrane density and is sensitive to changes in cellularity, edema, and necrosis, AD has been found to be predominantly modified by acute axonal damage and RD may reflect selective myelin injury such as de- or dysmyelination. 7
Historically, DTI metrics have been used primarily to assess white matter characteristics, while gray matter has been evaluated using magnetic resonance imaging (MRI) morphometric techniques. However, recent studies, including work by Reveley et al, 8 suggest that FA measurements in gray matter may reveal subtle microstructural properties beyond the scope of morphological analysis. It has been found that FA in the cerebral cortex is influenced significantly by unmyelinated tissue features, such as cellular and dendritic organization, rather than solely by myelinated pathways. This insight indicates that FA in the gray matter can reflect microstructural changes at the gray matter-white matter boundary, potentially revealing alterations in cortical cytoarchitecture. The use of FA as a marker in gray matter may therefore enhance our understanding of cortical microstructure changes in conditions like SCI, especially in regions with lower myelination, supporting its role as a novel metric for assessing structural integrity in the sensorimotor cortex. 8 Further studies suggest that AD and RD in gray matter may offer additional insights into microstructural integrity, although their interpretation differs from that in white matter. In gray matter, AD is thought to relate to the orientation and density of neuronal and dendritic structures, while RD may reflect dendritic complexity or synaptic density. Research by Wang et al 9 indicates that increased RD in neurodegenerative conditions correlates with dendritic and synaptic degradation, while decreased FA may indicate disruptions in cellular coherence within cortical layers. DTI metrics within cortical gray matter are more likely to reflect structural reorganization rather than direct histological alterations. Although DTI has limitations in evaluating cortical structures—since it does not directly capture histological changes or the complexity of cellular and synaptic activity—DTI metrics, particularly FA, may serve as sensitive indicators of cortical cytoarchitecture changes, even in the absence of detectable morphological alterations.
The microstructure of the sensorimotor brain regions in SCI has been studied both in animal and human models using various imaging techniques, mainly volumetry or quantitative MRI and less frequently DTI.10-12 In rats, thoracic contusion injuries of varying severity were found to be associated with distinct changes in brain DTI metrics, particularly in regions related to the corticospinal tract, such as the internal capsule and brainstem. 11 Similarly, Liu et al, 12 using a Beagle dog model of spinal contusion, observed dynamic DTI changes in brain regions including the cerebral peduncle and internal capsule, which correlated with alterations in axonal, glial, and neuronal markers. Previous studies investigating DTI changes in cerebral white matter tracts and cortical areas after SCI in humans are relatively sparse and have produced inconsistent results. Several DTI studies have shown decreased FA and increased MD values within large white matter regions, such as the centrum semiovale, as well as in specific white matter tracts including the corpus callosum, anterior cingulum, superior longitudinal fascicles, corticospinal tracts, and the primary motor cortex (M1).13-15
Current approaches to studying the microstructure of descending motor tracts in humans have primary focused on the corticospinal tracts descending from the M1. However, motor function is a complex process involving several cerebral regions and white matter bundles such as corticospinal or corticobulbar tracts originating in areas beyond the M1. M1 is a major region in the motor system, working in association with other motor areas including the premotor cortex, supplementary motor area, posterior parietal cortex and several subcortical regions, all of which contribute to motor planning and execution. Approximately 50% of corticospinal projections originate from the cells of the M1 motor cortex as corticospinal tracts and another 50% arise from premotor areas and the parietal lobe.16-18
The aim of our study was to conduct a detailed assessment of the sensorimotor cortex and white matter tracts in patients with chronic SCI, using 2 templates for DTI data postprocessing: the Human Motor Area Template (HMAT) and the Sensorimotor Area Tract Template (SMATT). HMAT, a gray matter atlas, enables segmentation of 6 cortical regions within the sensorimotor area such as: the M1, dorsal premotor cortex (PMd), ventral premotor cortex (PMv), supplementary motor area (SMA), pre-supplementary motor area (pre-SMA), and primary somatosensory cortex (S1) which have all been specifically defined with task-based functional MRI. 16 SMATT, a white matter atlas, is a high-resolution template that segments corticofugal white matter tracts originating from or targeting the cortical regions extracted with HMAT using a probabilistic tractography approach. 19 In addition, we aimed to assess whether microstructural abnormalities identified with DTI in patients after SCI correlate with the results of functional studies, such as sensorimotor function evaluation and the results of neurophysiological findings such as motor evoked potentials (MEPs) recorded from muscles of the upper and lower extremities following transcranial magnetization stimulation (TMS). 20
Our study may offer new insights into the functioning of the motor system and advance knowledge on remote cerebral degeneration due to chronic SCI. This includes not only the primary motor areas but also premotor and supplementary motor regions, and their relationship with clinical impairment. A distinctive feature of this study is the use of HMAT and SMATT templates, which are tools that segment and label the sensorimotor cortex and associated tracts at a spatial resolution not previously available. To our knowledge, these tools have not been applied before to assess cerebral changes in patients with chronic SCI. Another strength of the study is the investigation of correlations between cerebral microstructural abnormalities and the results of various neurological and neurophysiological studies, including MEP—an approach not previously reported in SCI research. This knowledge may enhance our understanding of the effects of physical rehabilitation and other treatment methods, such as repetitive transcranial magnetic stimulation (rTMS).20-22
Methods
We recruited 29 patients with chronic SCI (mean age = 37 years, range = 21-56 years, M/F 24/5) and 29 healthy controls (mean age = 40.5 years, range = 23-65 years, M/F 23/6) with comparable distributions of age and sex. The inclusion criteria for patients were age over 18 years, a SCI at either the cervical or thoracic level, and a time since injury of more than 6 months. The exclusion criteria included any known psychiatric and neurological disorders other than SCI, any cerebral pathology visible on the structural brain MRI, pregnancy, and contraindications for MRI or MEP studies. 21 The inclusion criteria for healthy controls were no history of neurological disorders or other significant medical conditions and normal structural brain MRI. Before the study, all participants underwent a detailed interview conducted by an experienced neurologist and a physical therapist (W.F.) covering general health and any history of psychiatric and neurological disorders. Additional information on the patients’ mental health was obtained from caregivers and families of the patients. Standard brain MRI using a 3T scanner was performed in each subject to exclude any structural brain abnormalities, including post-traumatic lesions. All MRI examinations were evaluated by experienced certified neuroradiologists (A.Z and B.B.B). Details of the study group are presented in Table 1.
Demographic Data, Clinical, and Neurophysiological Results Recorded in Tetraplegic and Paraplegic Patients With the Chronic Spinal Cord Injury (SCI).
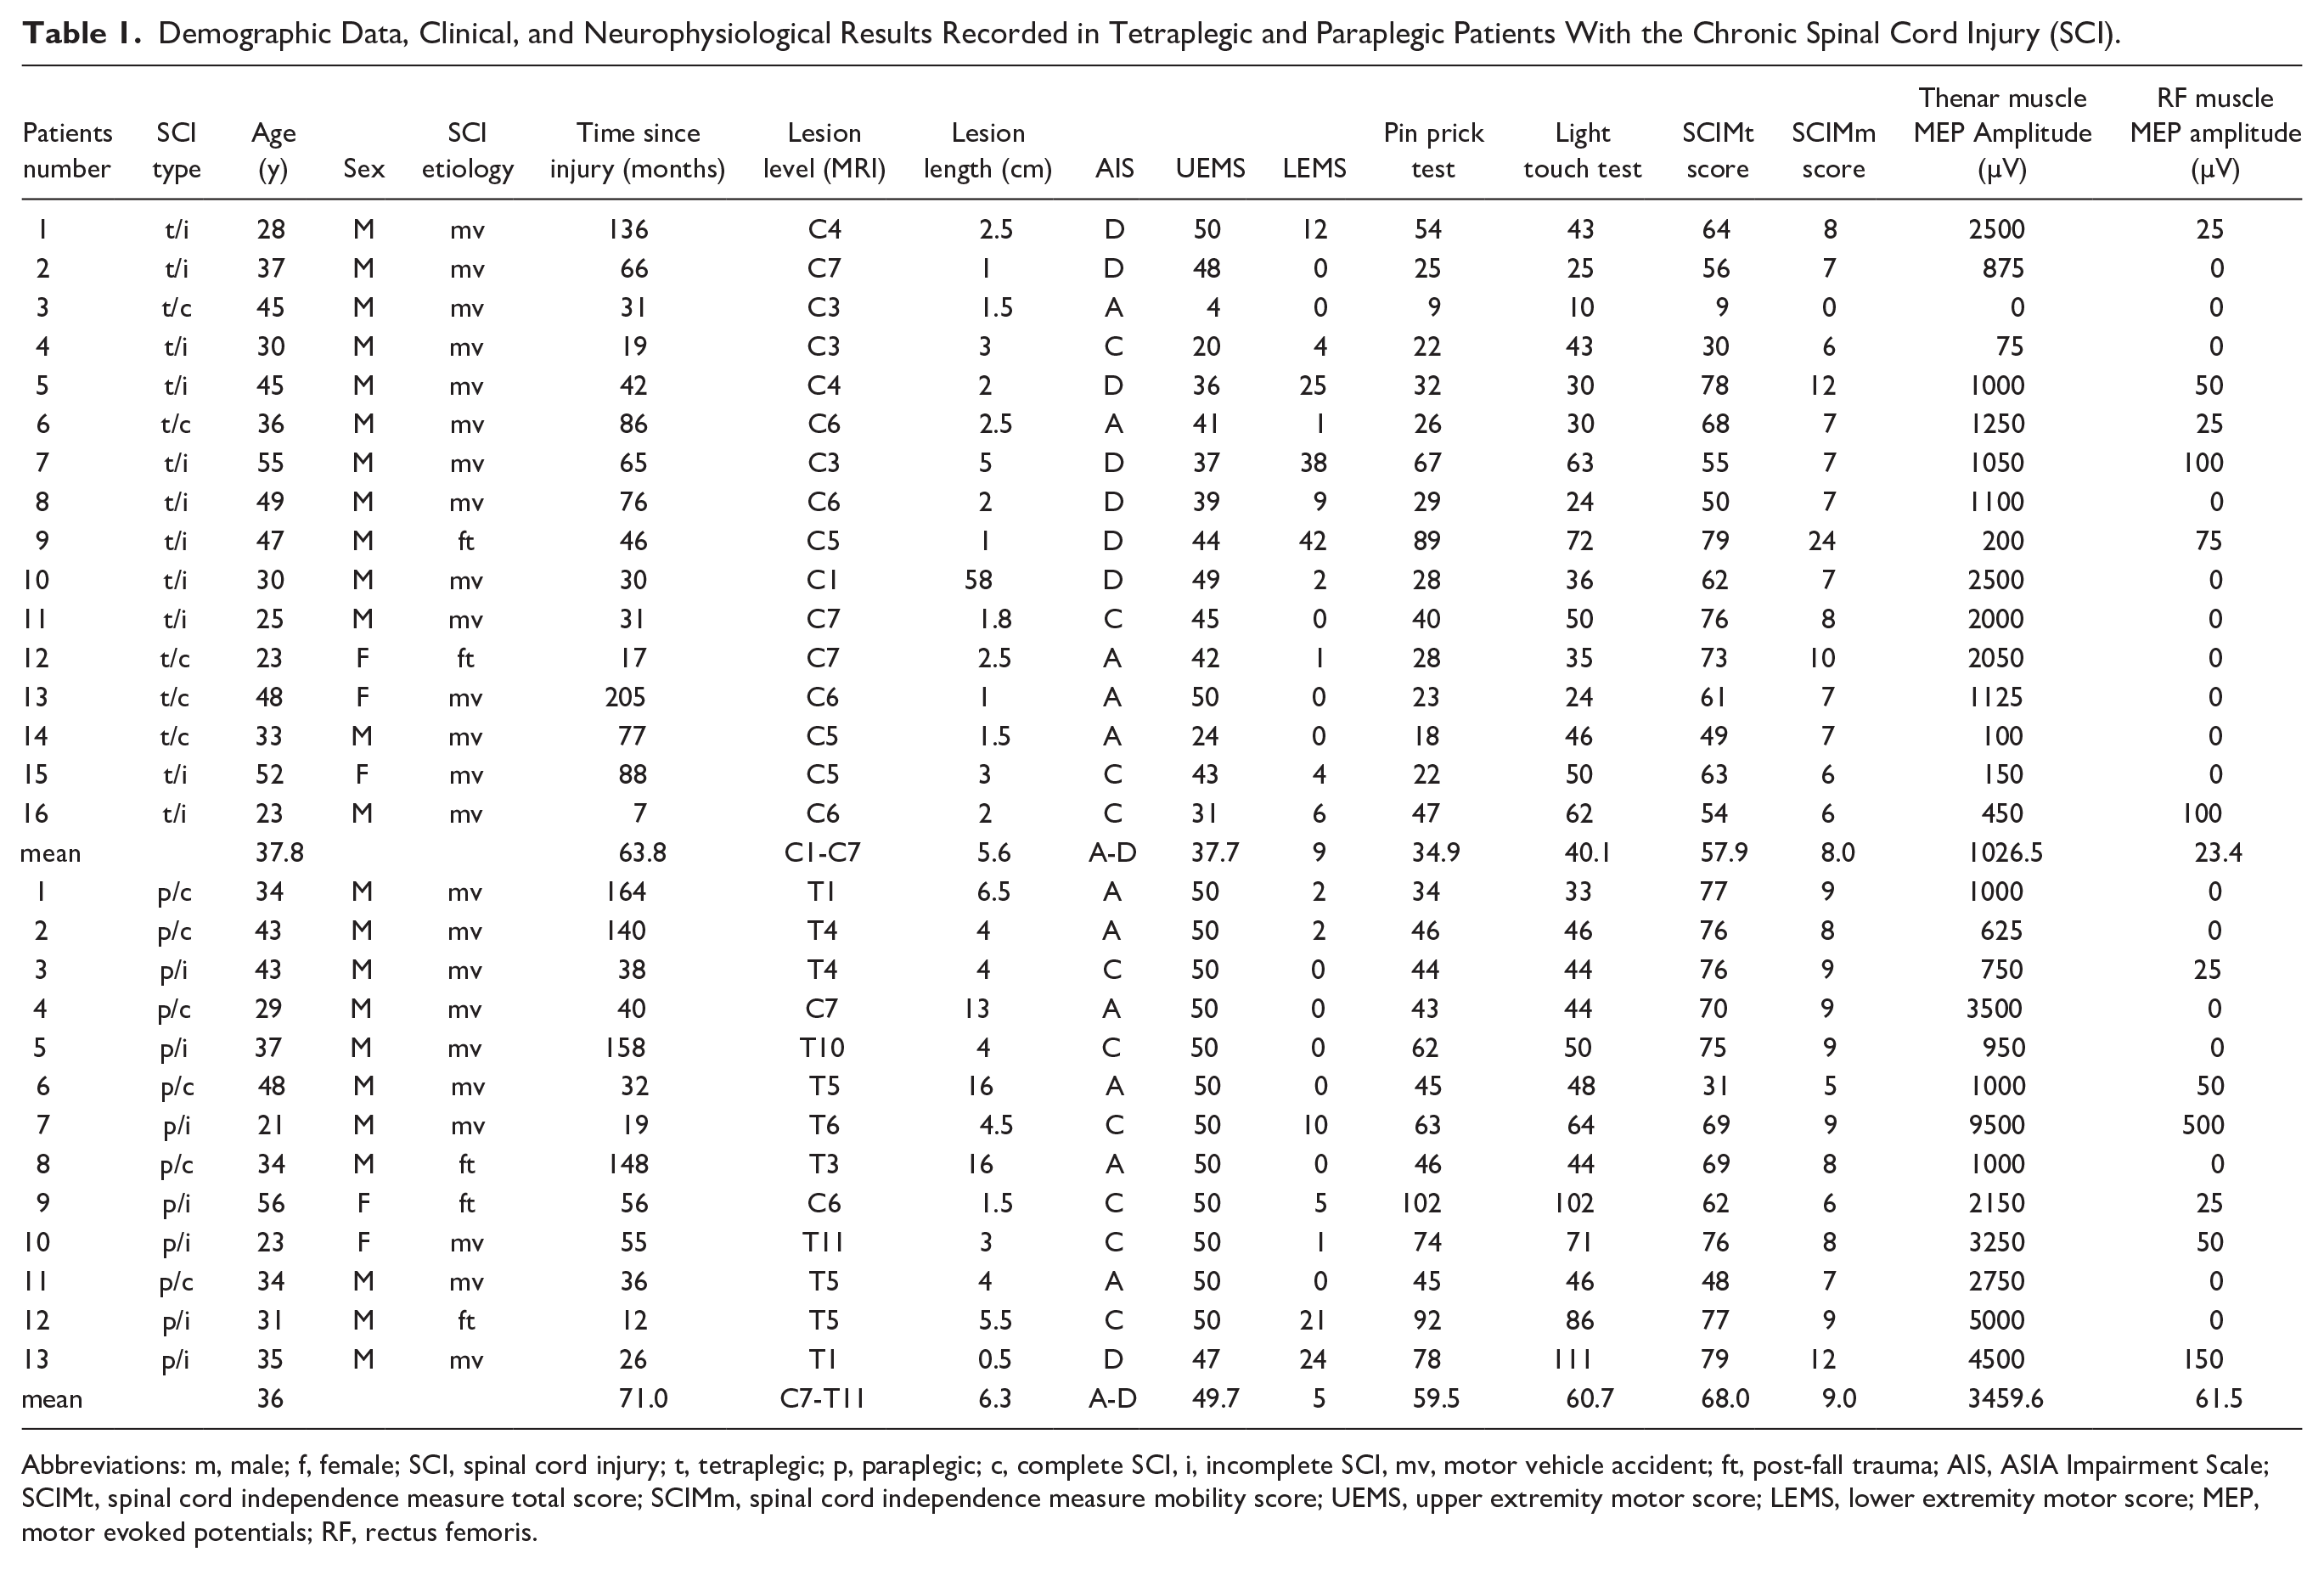
Abbreviations: m, male; f, female; SCI, spinal cord injury; t, tetraplegic; p, paraplegic; c, complete SCI, i, incomplete SCI, mv, motor vehicle accident; ft, post-fall trauma; AIS, ASIA Impairment Scale; SCIMt, spinal cord independence measure total score; SCIMm, spinal cord independence measure mobility score; UEMS, upper extremity motor score; LEMS, lower extremity motor score; MEP, motor evoked potentials; RF, rectus femoris.
The study was performed in accordance with the Declaration of Helsinki and was approved by the Bioethics Committee of the Wroclaw Medical University. All participants signed a written informed consent prior to participation in the study and gave permission for publication of the study results.
All SCI patients underwent a detailed evaluation of their neurological status and neurophysiological assessment followed by MRI. All experts in neurology, neurophysiology, and neuroradiology were blinded during the process of patient examination and data acquisition and did not have full access to all patient data until the time of manuscript preparation.
Neurological Evaluation
A neurological examination was performed by an experienced neurologist and a physical therapist (W.F.) working with SCI patients and was performed using the sensory and motor scores included in the International Standards for Neurological Classification of SCI. 23 It comprised the assessment of the ASIA Impairment Scale (AIS), Upper and Lower Extremities Motor Scores (UEMS and LEMS), Light Touch and Pinprick Tests, Total Sensory Scores, and Sensory and Motor levels based on neurological examination followed by the assessment of Spinal Cord Independence Measure (SCIM total and SCIM mobility scores). To assess the neurological level of injury, spinal levels were consecutively numbered in the craniocaudal direction.
To allow for statistical computations AIS was additionally converted from letters to numbers as follows: A to 1, B to 2, C to 3, and D to 4.
Neurophysiological Recordings
Neurophysiological evaluation was performed by an experienced neurophysiologist (J.H.) and included MEP examinations with recordings from abductor pollicis brevis (Thenar) and rectus femoris (RF) muscles bilaterally. All MEP studies were conducted using the KeyPoint Diagnostic System (Medtronic A/S, Skøvlunde, Denmark) and The MagPro R30 and MagPro X100 magnetic stimulator with MagOption (Medtronic A/S, Skøvlunde, Denmark) used for the TMS. MEP were elicited using a single transcranial magnetic stimulus and recorded with bipolar surface electrodes from the target muscles (Figure 1). Stimulation was applied bilaterally over the scalp, targeting the M1 areas representing the thumb and leg muscles. Stimulation was angled to target the corona radiata, where the fibers of the corticospinal tract for innervating of lower extremities muscles originate. A circular coil (C-100, 12 cm in diameter) generating a magnetic field with the maximal stimulus strength of 2.4 T was used. The magnetic field stream delivered from the coil at a strength 70% to 80% of the resting motor threshold (0.84-0.96 T) stimulating all neural structures up to 3 to 5 cm deep. MEP amplitude was used as the outcome measure to assess the M1 output and evaluate the global efferent transmission of neural impulses to the effectors via descending spinal cord tracts. None of the subjects reported the stimulation as painful. During MEP acquisition, the high-pass filter was set to 0.5 Hz, the low-pass filter to 2 kHz, and the time base was between 10 and 20 ms/D. Signal amplification ranged from 200 to 5000 µV. Further methodological details on MEP recordings have been described elsewhere.20-22
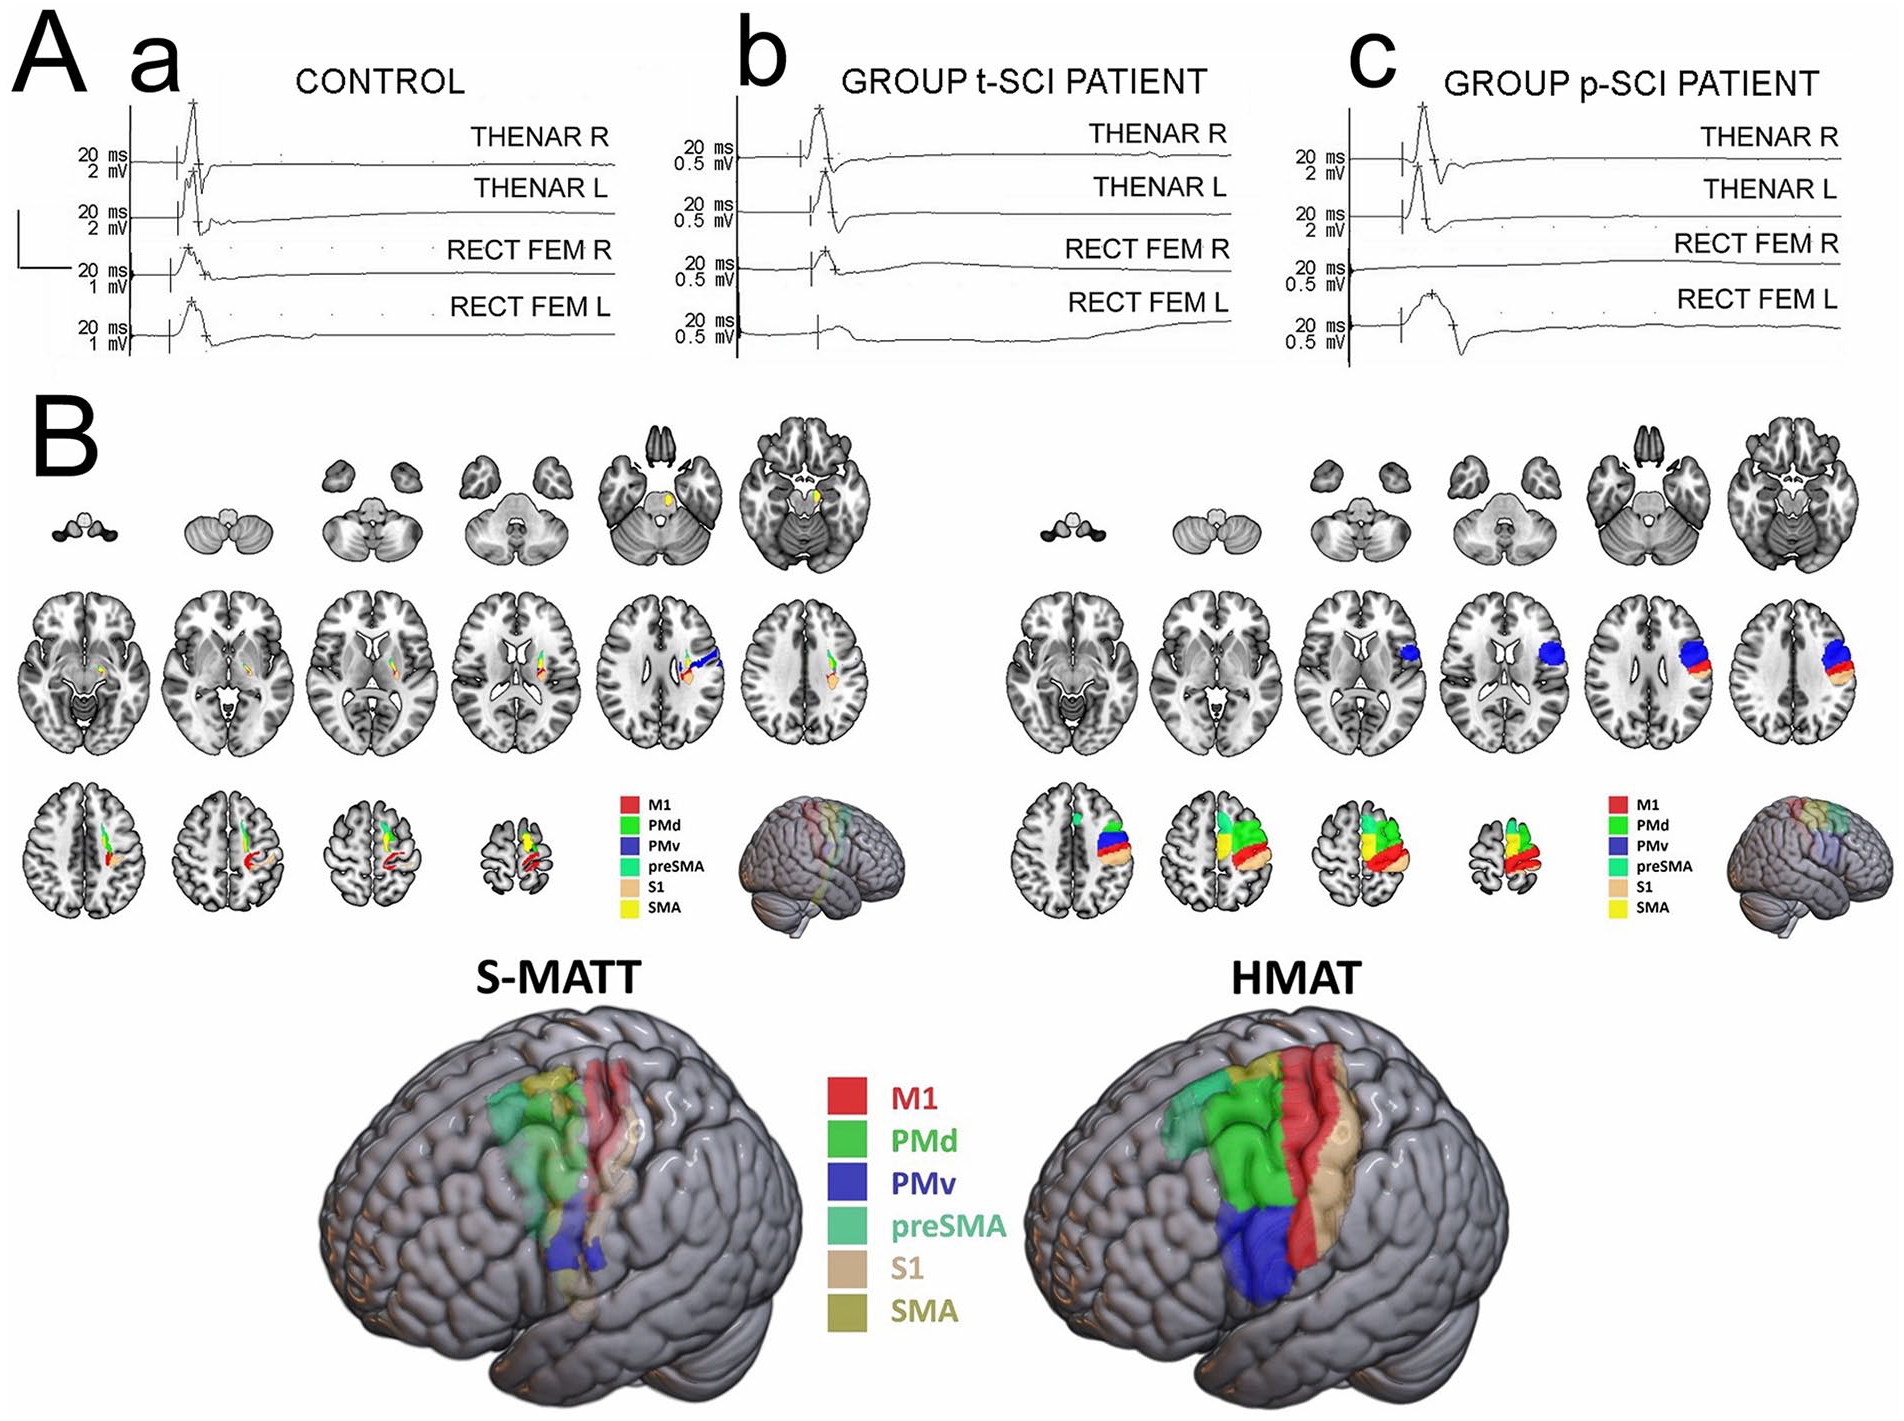
(A) Examples of the motor evoked potentials recordings from abductor pollicis brevis and rectus femoris muscles bilaterally following the transcranial magnetic stimulation in the healthy volunteer (a), a tetraplegic patient after SCI (b), and a paraplegic patient after SCI (c). Calibration bars for amplification (vertical) and the time base (horizontal) of MEP recordings set during neurophysiological tests are shown in the left part of the figure. Note that amplifications of recordings in (b) and (c) are greater than in (a). (B) Sensorimotor tract parcellation using Sensorimotor Area Tract Template (SMATT) and sensorimotor cortical areas parcellation using Human Motor Area Template (HMAT)—planar multislice and 3D views.
MRI Acquisition and Postprocessing
MR imaging was performed on a 3.0 T MRI system (Siemens Magnetom Prisma 3T, Erlangen, Germany) at the Department of Radiology in the National Institute of Oncology in Gliwice in Poland. All participants underwent structural imaging of the entire spine (axial and sagittal T2-weighted images) and the brain (axial T2, 3D FLAIR, and SWI images) followed by DTI and 3D T1 volumetry of the brain using a 20-channel head coil. Structural T2-weighted MR images of the spinal cord were evaluated by an experienced neuroradiologist (A.Z.) in order to assess the length and the most cranial level of the spinal cord lesion. To determine the most cranial level of the spinal lesion each vertebral level was sequentially numbered in the craniocaudal direction. Before DTI analysis, all brain MRI studies of the SCI patients and the control group were checked for any pathology. Patients or healthy controls with visible cerebral pathology were excluded from the study.
The DTI protocol consisted of a single-shot spin-echo echo-planar imaging sequence with the following parameters: TR/TE 11500/79 ms, FOV 220 mm × 220 mm, acquisition matrix 88 × 88, reconstruction matrix 128 × 128, 50 slices with 2.5 mm thickness without gap. Images were acquired in the axial plane with diffusion gradients applied in 24 non-collinear directions with a b-value of 1000 s/mm2 and 1 non-diffusion weighted image. 24 3D T1-weighted structural images were acquired using the following parameters: TE/TR 7/1 8ms, flip angle 25°, acquisition matrix 204 × 256, FOV 224 mm × 256 mm, slice thickness 1 mm.
DTI datasets were analyzed using the diffusion MRI toolbox (Explore DTI) and included the following steps: (1) correction for subject motion and eddy current-induced distortions, 25 (2) tensor estimation using the REKINDLE approach for outlier detection 26 with iteratively reweighted linear least squares estimation after identification and removal of data outliers, 27 and (3) automated atlas-based analysis using diffusion MRI as well as SMATT and HMAT atlases registered using affine and elastic registration based on “elastix.”16,19,28 The templates and parcellated atlas regions used are publicly available at http://lrnlab.org/. Brain parcellations using SMATT and HMAT are shown in Figure 1.
All DTI data were visually checked for tensor estimation and registration quality. Due to severe artefacts, 4 patients with SCI were excluded from further analyses and 29 were finally accepted. After preprocessing, FA, MD, AD, and RD values were calculated in the brain regions defined by the HMAT and SMATT atlases. All DTI parameters were measured separately for the right and left brain hemisphere and then averaged to obtain mean values for both hemispheres.
Statistical Analysis
All statistical computations were performed using Statistica 10 PL software. The Shapiro–Wilk test was used to test for normality of subjects’ demographics and independent t-test and Chi-squared tests were performed to assess differences in age and sex between the cohorts, respectively. All DTI parameters such as FA, MD, AD, and RD derived from SMATT and HMAT were compared between all SCI subjects and healthy controls using the Student’s t-test. Additionally, all DTI parameters derived from SMATT and HMAT were compared between paraplegic (p-SCI) and tetraplegic SCI (t-SCI) subjects as well as between patients with incomplete (i-SCI) and complete (c-SCI) injury and the CG (control group) using analysis of covariance, with age and sex as covariates followed by a post hoc Scheffé test and Bonferroni correction. We applied the Bonferroni correction to control for multiple comparisons in our main analysis. This method adjusts P-values by multiplying each raw P-value by the number of tests and capping any resulting P-value at 1. Using these corrected P-values, we maintained a significance threshold of .05—a process mathematically equivalent to dividing the significance level (α) by the number of tests.
The Shapiro–Wilk test was used to assess the normality of each variable’s distribution. Since the test results indicated that the data were not normally distributed (P < .05), the Spearman correlation coefficient was used as an appropriate method for nonparametric data. Spearman’s rank correlation coefficient was used to analyze the relationships between DTI parameters and clinical metrics including lesion length, the most cranial level of injury on standard MR images, time since injury in months, numerical version of the AIS Score, Upper and Lower Extremity Total Motor Scores, Light Touch, Pinprick and Total Sensory Scores, and sensory and motor levels based on neurological examination ( separately for the right and left sides), total SCIM and SCIM mobility scores, and MEP results (amplitude and latency) recorded from bilateral thenar and femoral muscles. Correlations between DTI parameters from the right and left hemisphere and lateralized clinical scores were assessed, and mean values of DTI parameters from both hemispheres were correlated with averaged clinical scores. All correlations were performed within patient subgroups and across the entire SCI cohort. Statistical software (StatSoft, version 13.1, Kraków, Poland) was used to determine the required sample size based on the primary outcome variables: sEMG and MEP amplitudes recorded from the RF muscles. The calculations were performed with 80% power and a 2-tailed significance level of .05). The mean and standard deviation were calculated using data obtained from the first 8 patients. The sample size determination software estimated that at least 12 patients were required for each patient group in this study.
Results
There were no statistically significant differences in age and sex distribution between the SCI patients and the CG, or between p-SCI and t-SCI patient subgroups.
Comparison of SMATT and HMAT Results Between SCI Patients and the Control Group
Compared to controls, SCI patients showed significantly lower FA values derived from SMATT in the right and left M1 and S1 tracts, the right pre-SMA tracts and the averaged mean values from bilateral M1 and S1, PMd, and pre-SMA tracts (Table 2).
Comparison of FA Values Between the SCI Patients and the Control Group.
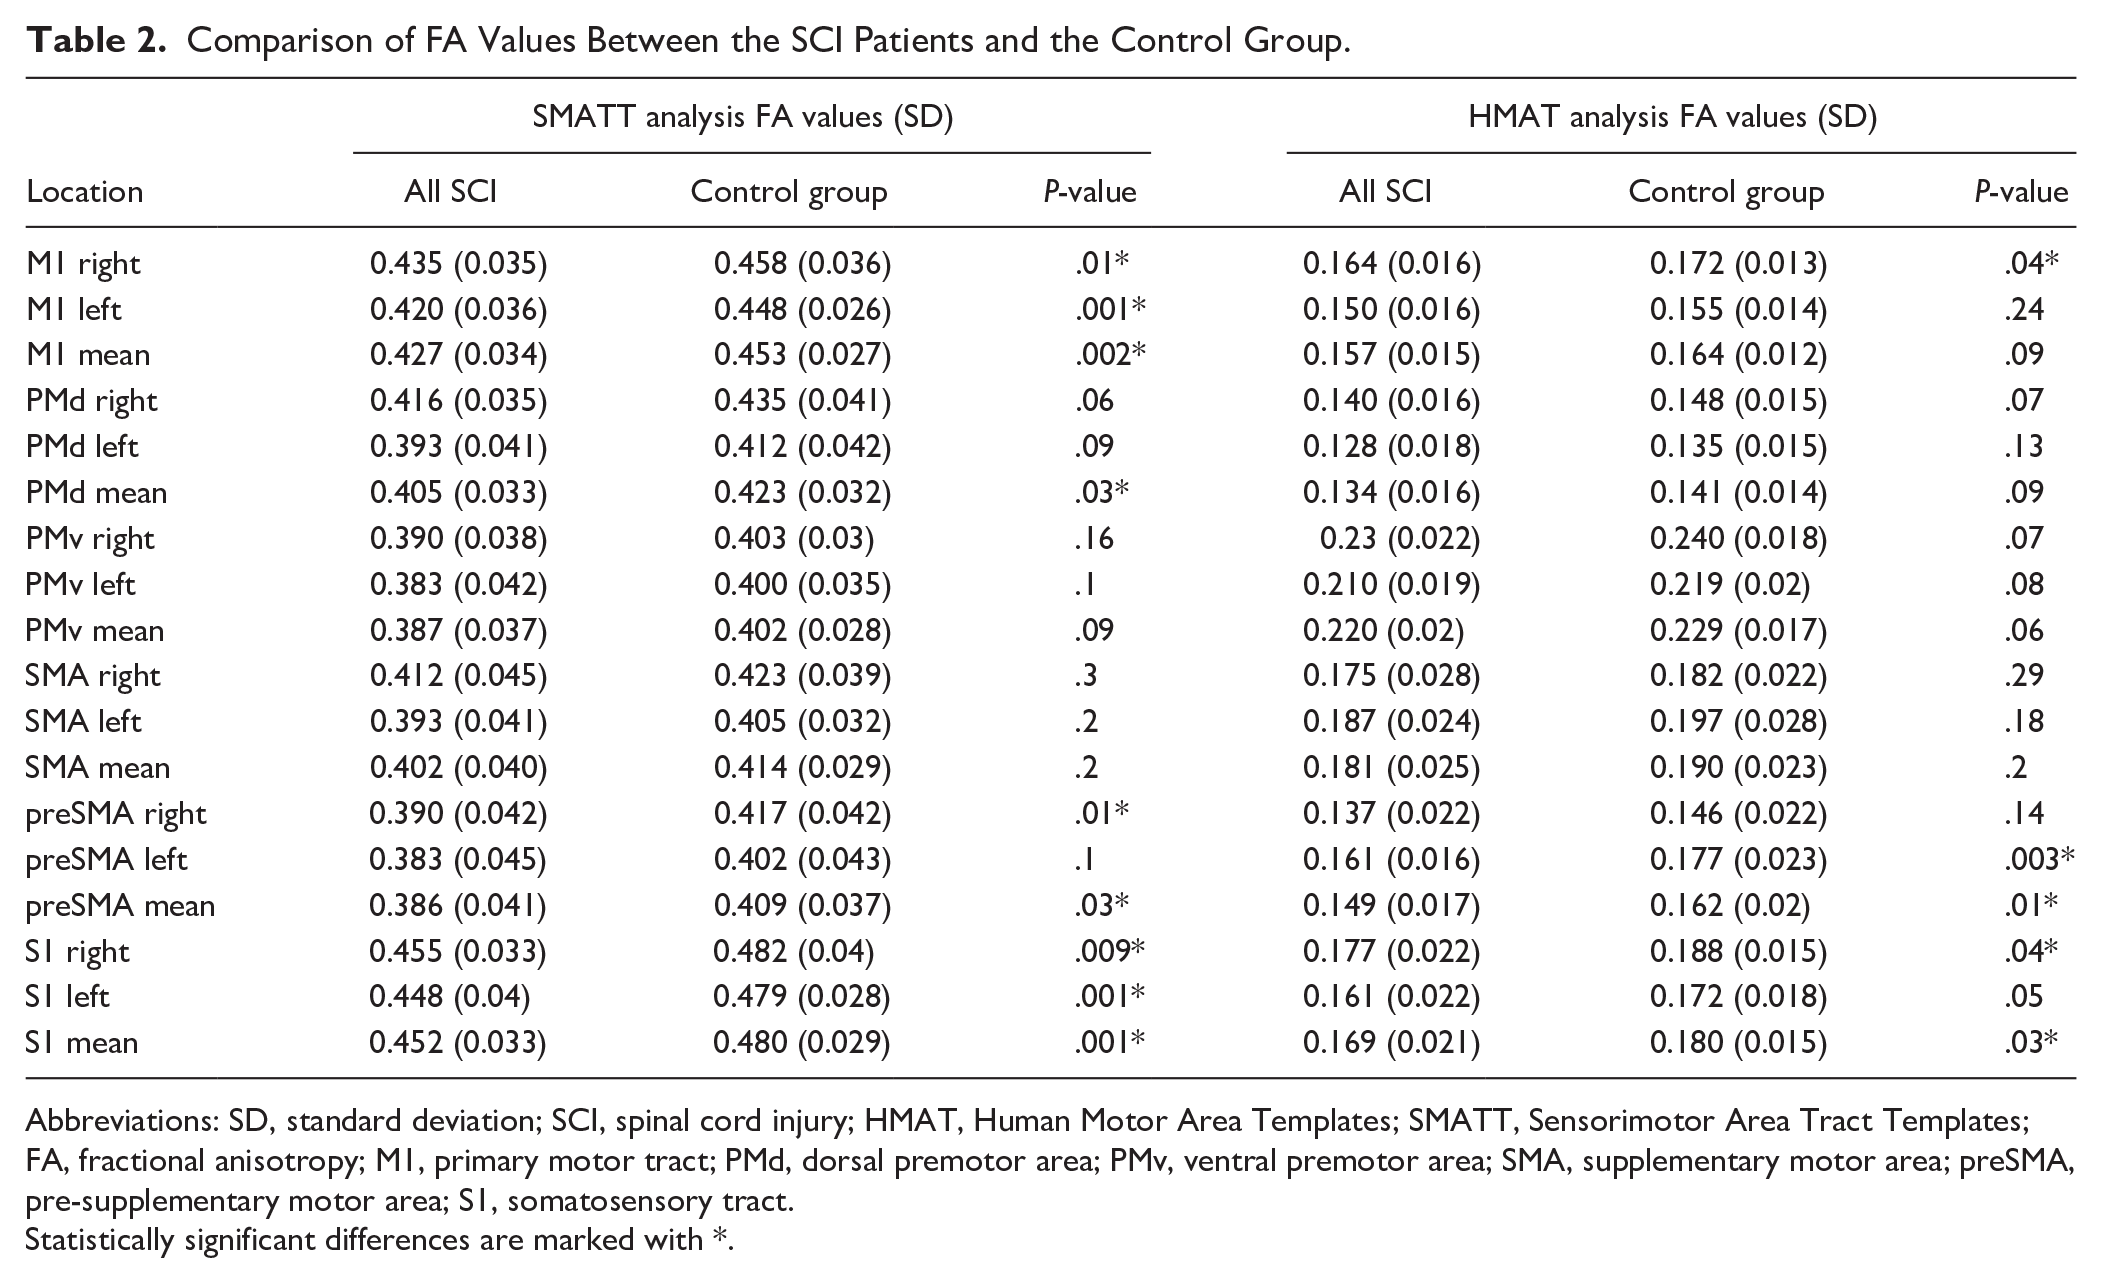
Abbreviations: SD, standard deviation; SCI, spinal cord injury; HMAT, Human Motor Area Templates; SMATT, Sensorimotor Area Tract Templates; FA, fractional anisotropy; M1, primary motor tract; PMd, dorsal premotor area; PMv, ventral premotor area; SMA, supplementary motor area; preSMA, pre-supplementary motor area; S1, somatosensory tract.
Statistically significant differences are marked with *.
Compared to controls, SCI patients also revealed significantly decreased FA values derived from HMAT within right M1 and S1 cortices, left pre-SMA cortex as well as the averaged mean values from bilateral pre-SMA and S1 cortices (Table 2). There were no differences between SCI and controls in parameters such as MD, AD, or RD derived from SMATT or HMAT in all evaluated locations. Comparisons of DTI parameters between p-SCI and t-SCI, or p-SCI and controls, as well as between c-SCI and i-SCI revealed no significant differences in FA, MD, AD, and RD derived from both SMATT and HMAT templates (P > .05).
However, compared to controls, t-SCI patients showed significantly decreased FA values in several locations within the white matter tracts derived from SMATT including the left M1 and left S1, as well as the averaged mean values from M1 and S1 (Table 3). There were no significant differences in FA values between t-SCI patients and the control group in cortical regions derived from HMAT.
Comparison of FA Values Derived From SMAT and HMAT Templates Between Paraplegic SCI (P-SCI), Tetraplegic SCI (t-SCI), and the Control Group.
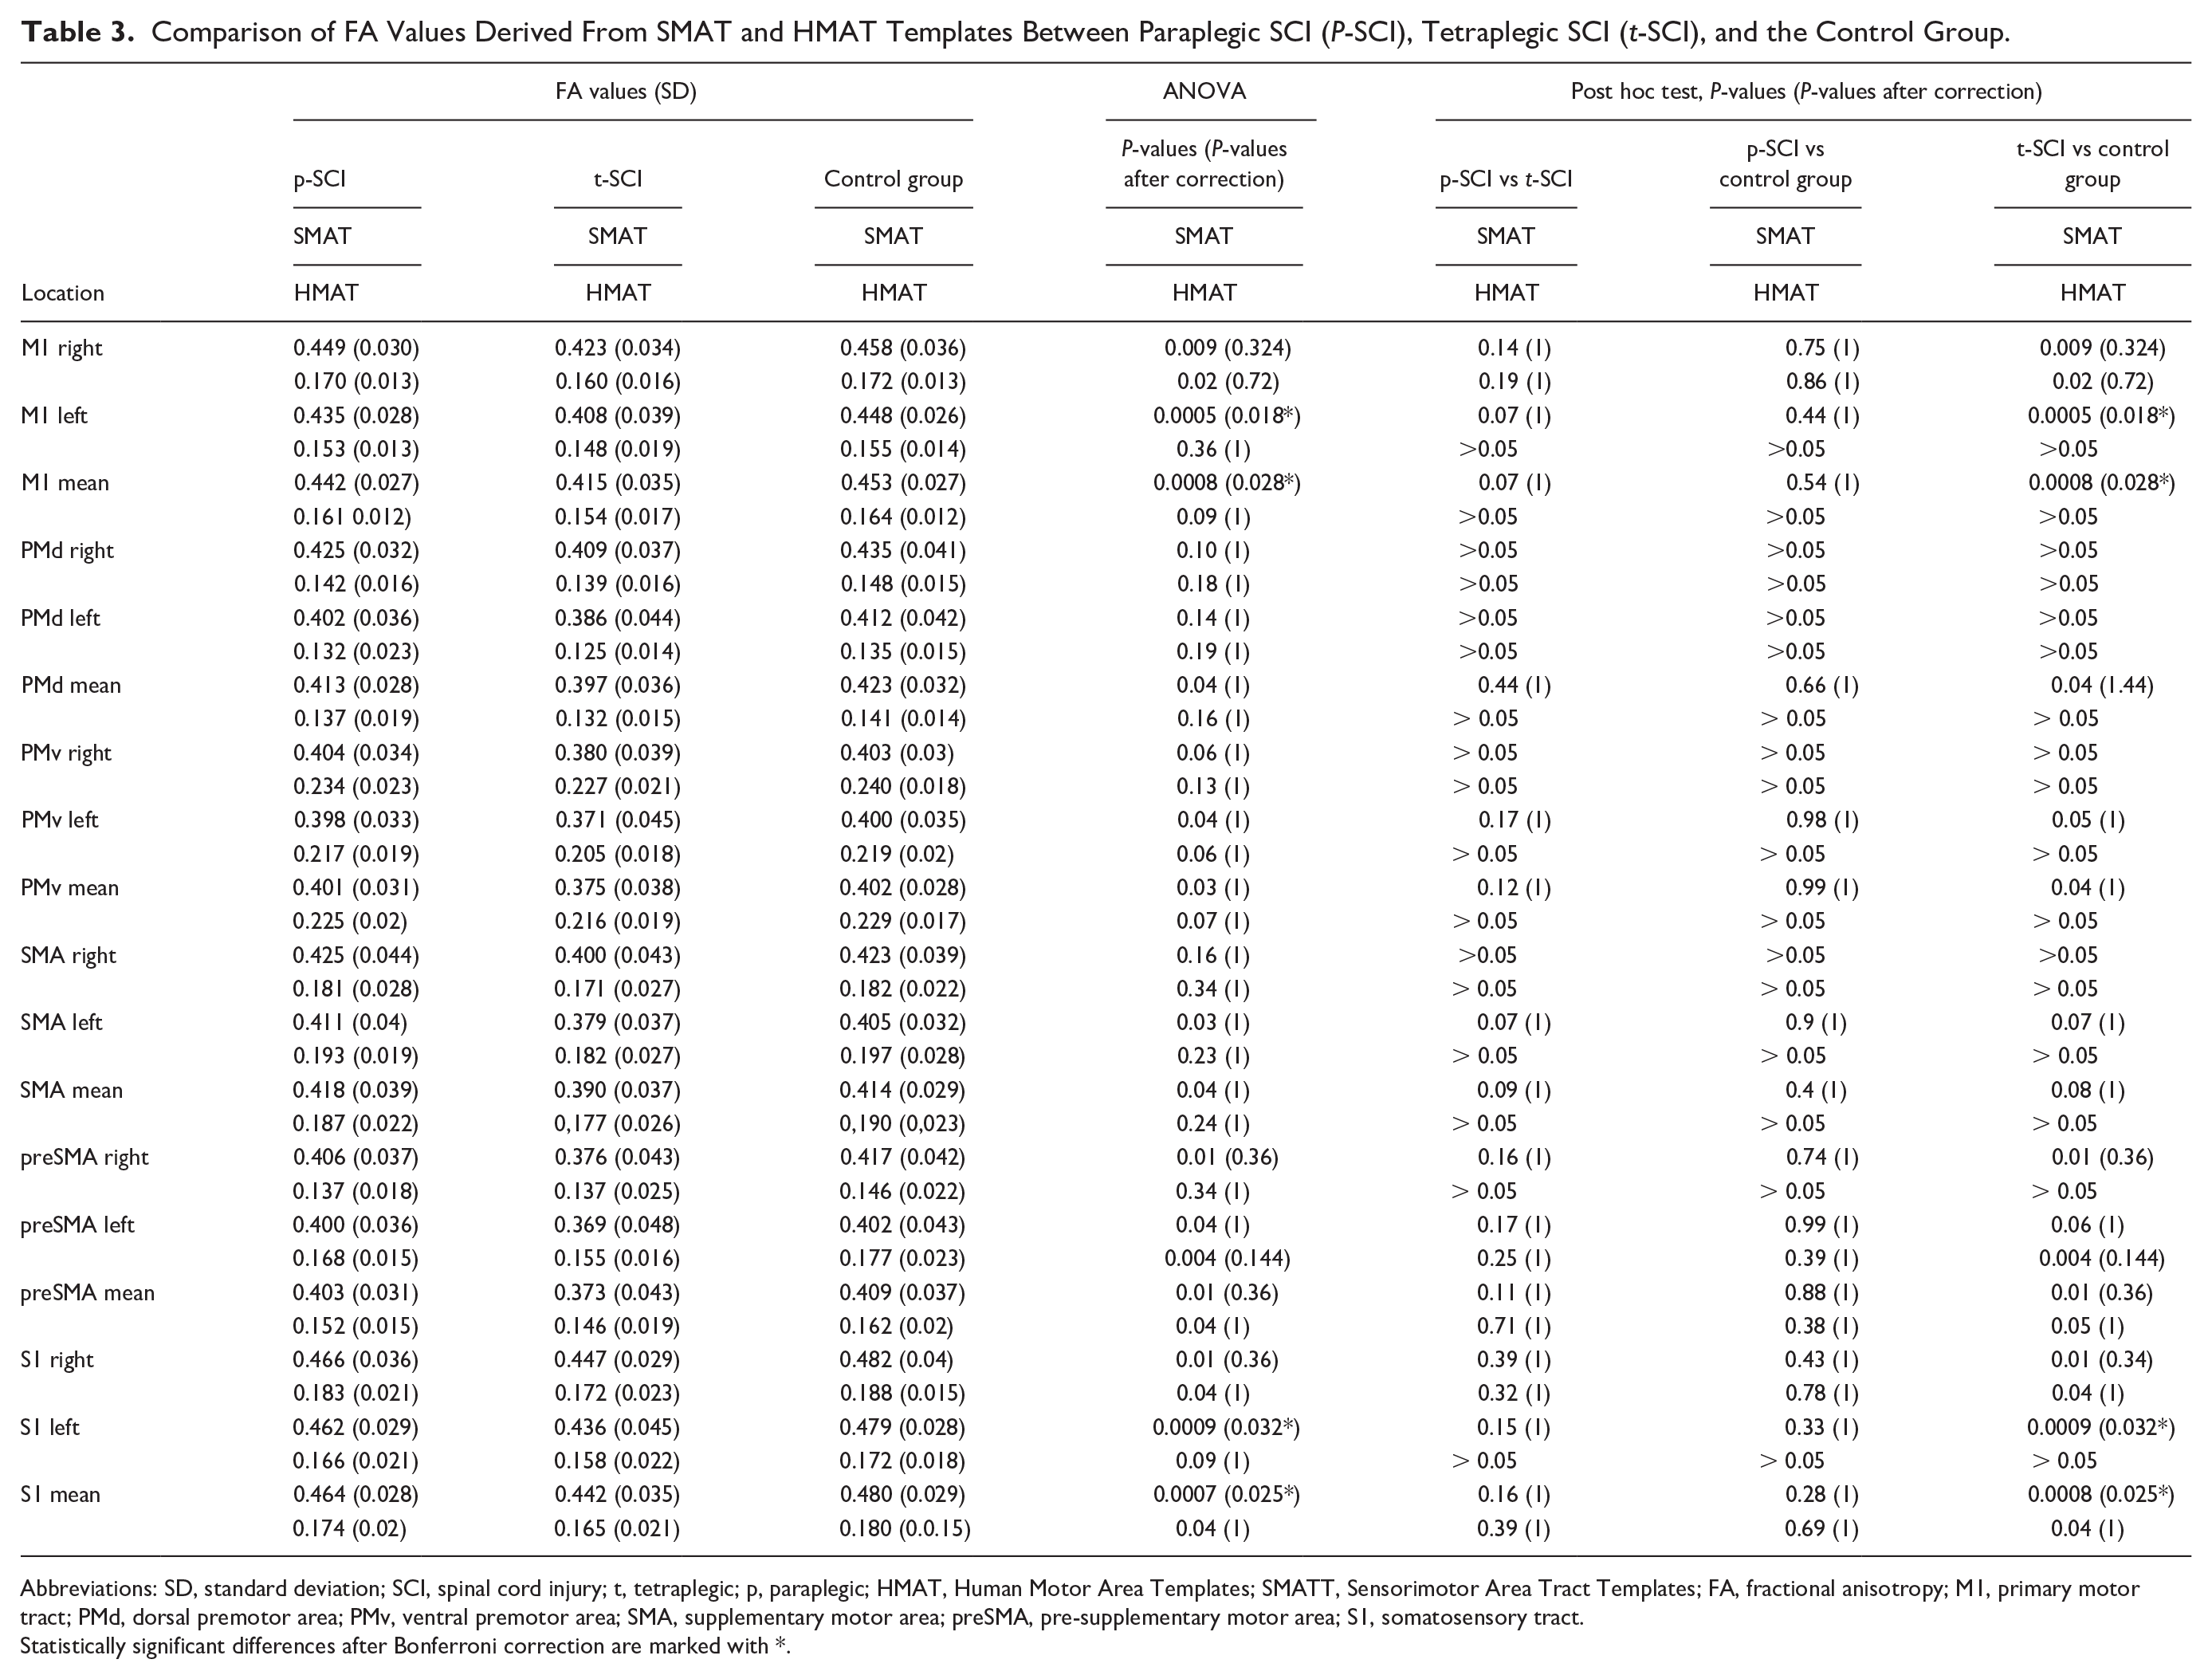
Abbreviations: SD, standard deviation; SCI, spinal cord injury; t, tetraplegic; p, paraplegic; HMAT, Human Motor Area Templates; SMATT, Sensorimotor Area Tract Templates; FA, fractional anisotropy; M1, primary motor tract; PMd, dorsal premotor area; PMv, ventral premotor area; SMA, supplementary motor area; preSMA, pre-supplementary motor area; S1, somatosensory tract.
Statistically significant differences after Bonferroni correction are marked with *.
Correlation of SMATT and HMAT Results With the Clinical Metrics
In all SCI patients, as well as in the separate groups of p-SCI and t-SCI no significant correlations were found (P ≤ .05) between FA values derived from tracts (SMATT) and cortex (HMAT), and lesion length or the level of injury on MRI, as well as time after injury, AIS score, sensory and motor levels based on the neurological assessment, UEMS, Pinprick test, SCIMt score, or MEP latencies. Significant positive correlations were found between FA values derived from SMATT and HMAT and several clinical and neurophysiological parameters including LEMS, Light Touch and Total Sensory Scores, SCIMm score, and MEP amplitudes recorded from bilateral Thenar and RF muscles (Table 4).
Correlations of DTI Parameters With Neurological Status and the Results of Neurophysiological Assessment in the SCI Patients.
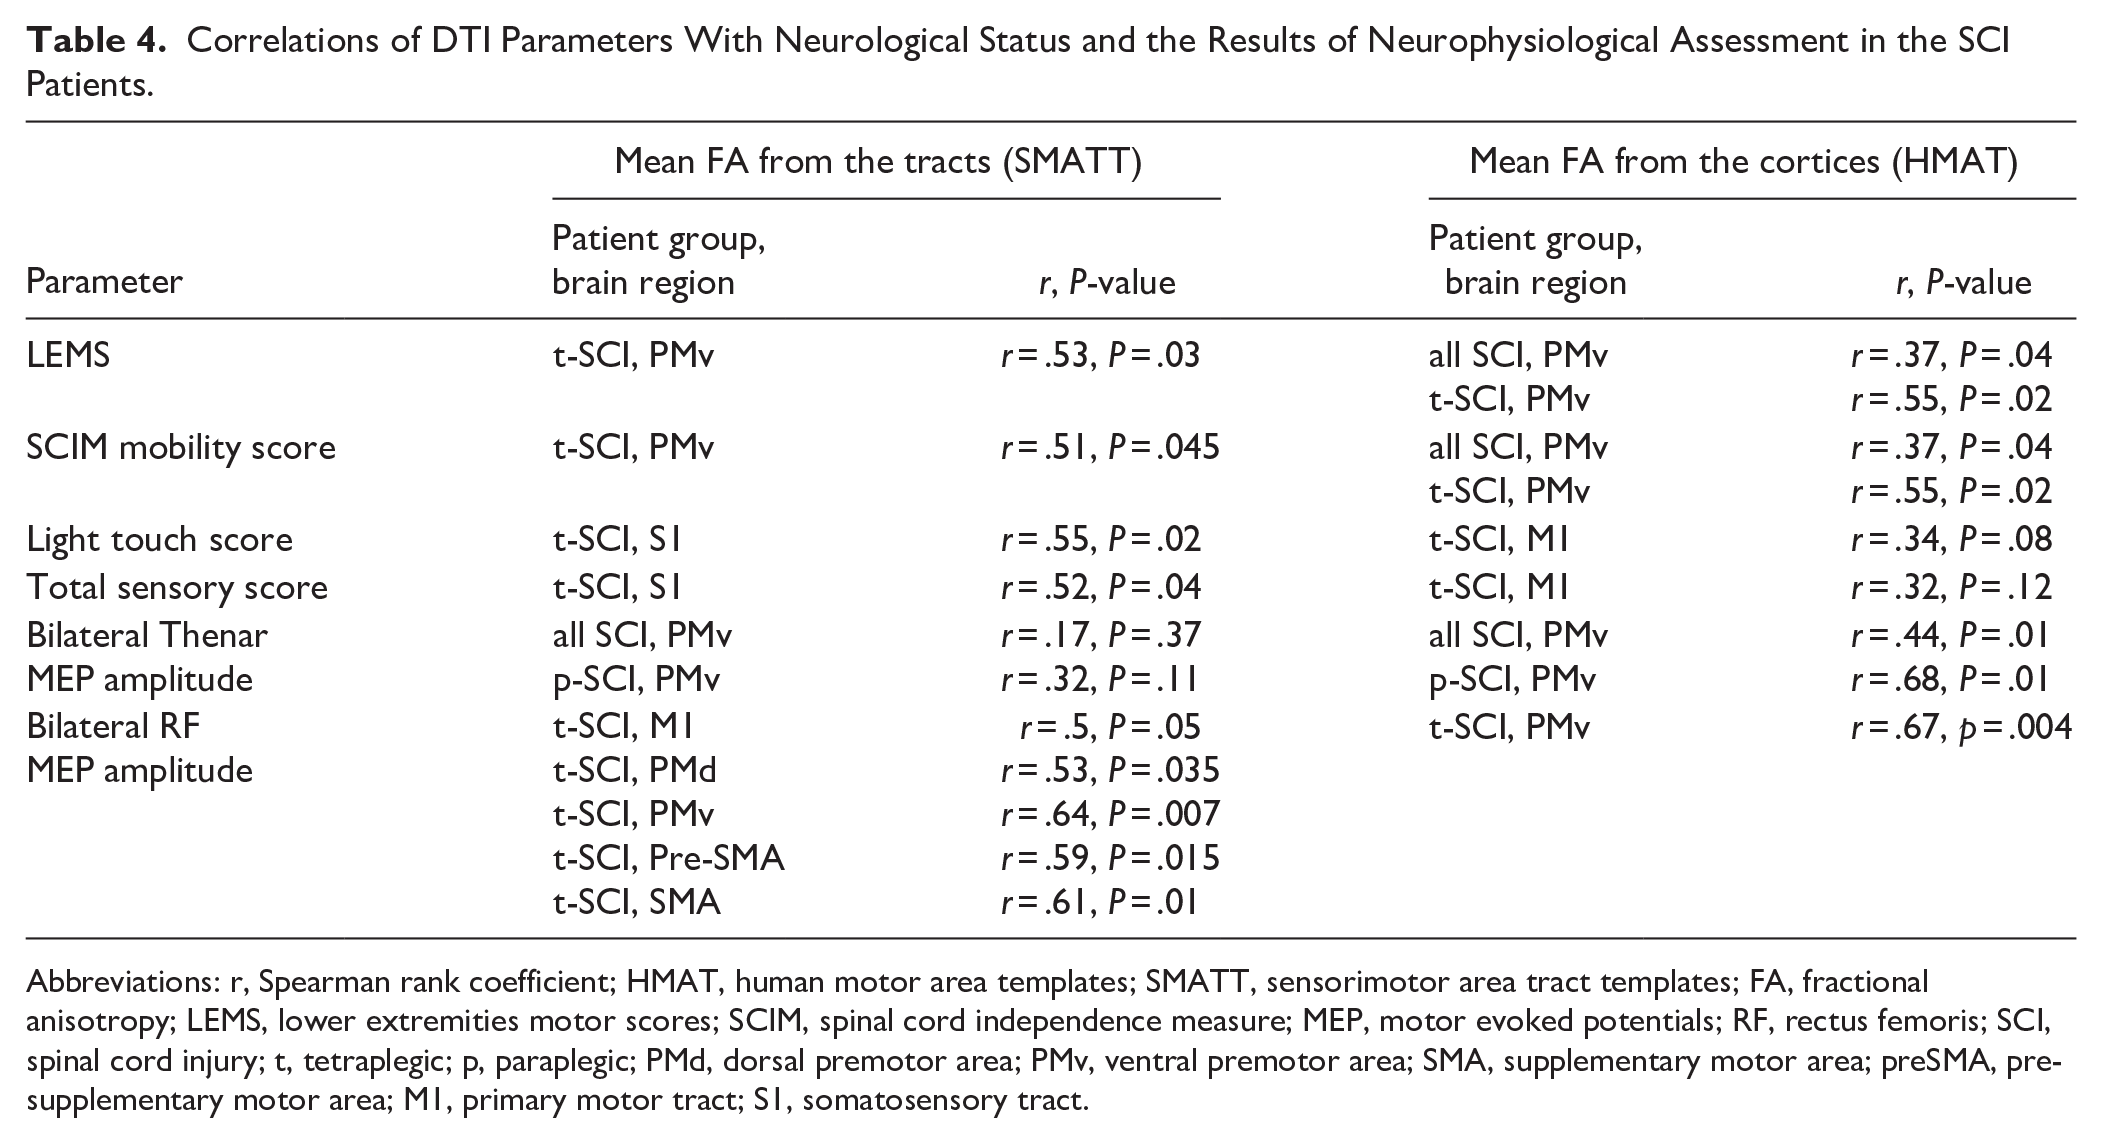
Abbreviations: r, Spearman rank coefficient; HMAT, human motor area templates; SMATT, sensorimotor area tract templates; FA, fractional anisotropy; LEMS, lower extremities motor scores; SCIM, spinal cord independence measure; MEP, motor evoked potentials; RF, rectus femoris; SCI, spinal cord injury; t, tetraplegic; p, paraplegic; PMd, dorsal premotor area; PMv, ventral premotor area; SMA, supplementary motor area; preSMA, pre-supplementary motor area; M1, primary motor tract; S1, somatosensory tract.
In the group of p-SCI patients, only a single positive correlation was found between mean FA from both PMv cortices and mean MEP amplitude from the Thenar muscles. In the group of t-SCI patients, the significant correlations were detected between cortical and white matter FA values and motor and sensory clinical parameters, as well as MEP amplitudes recorded bilaterally from the RF muscles (Table 4, Figure 2).
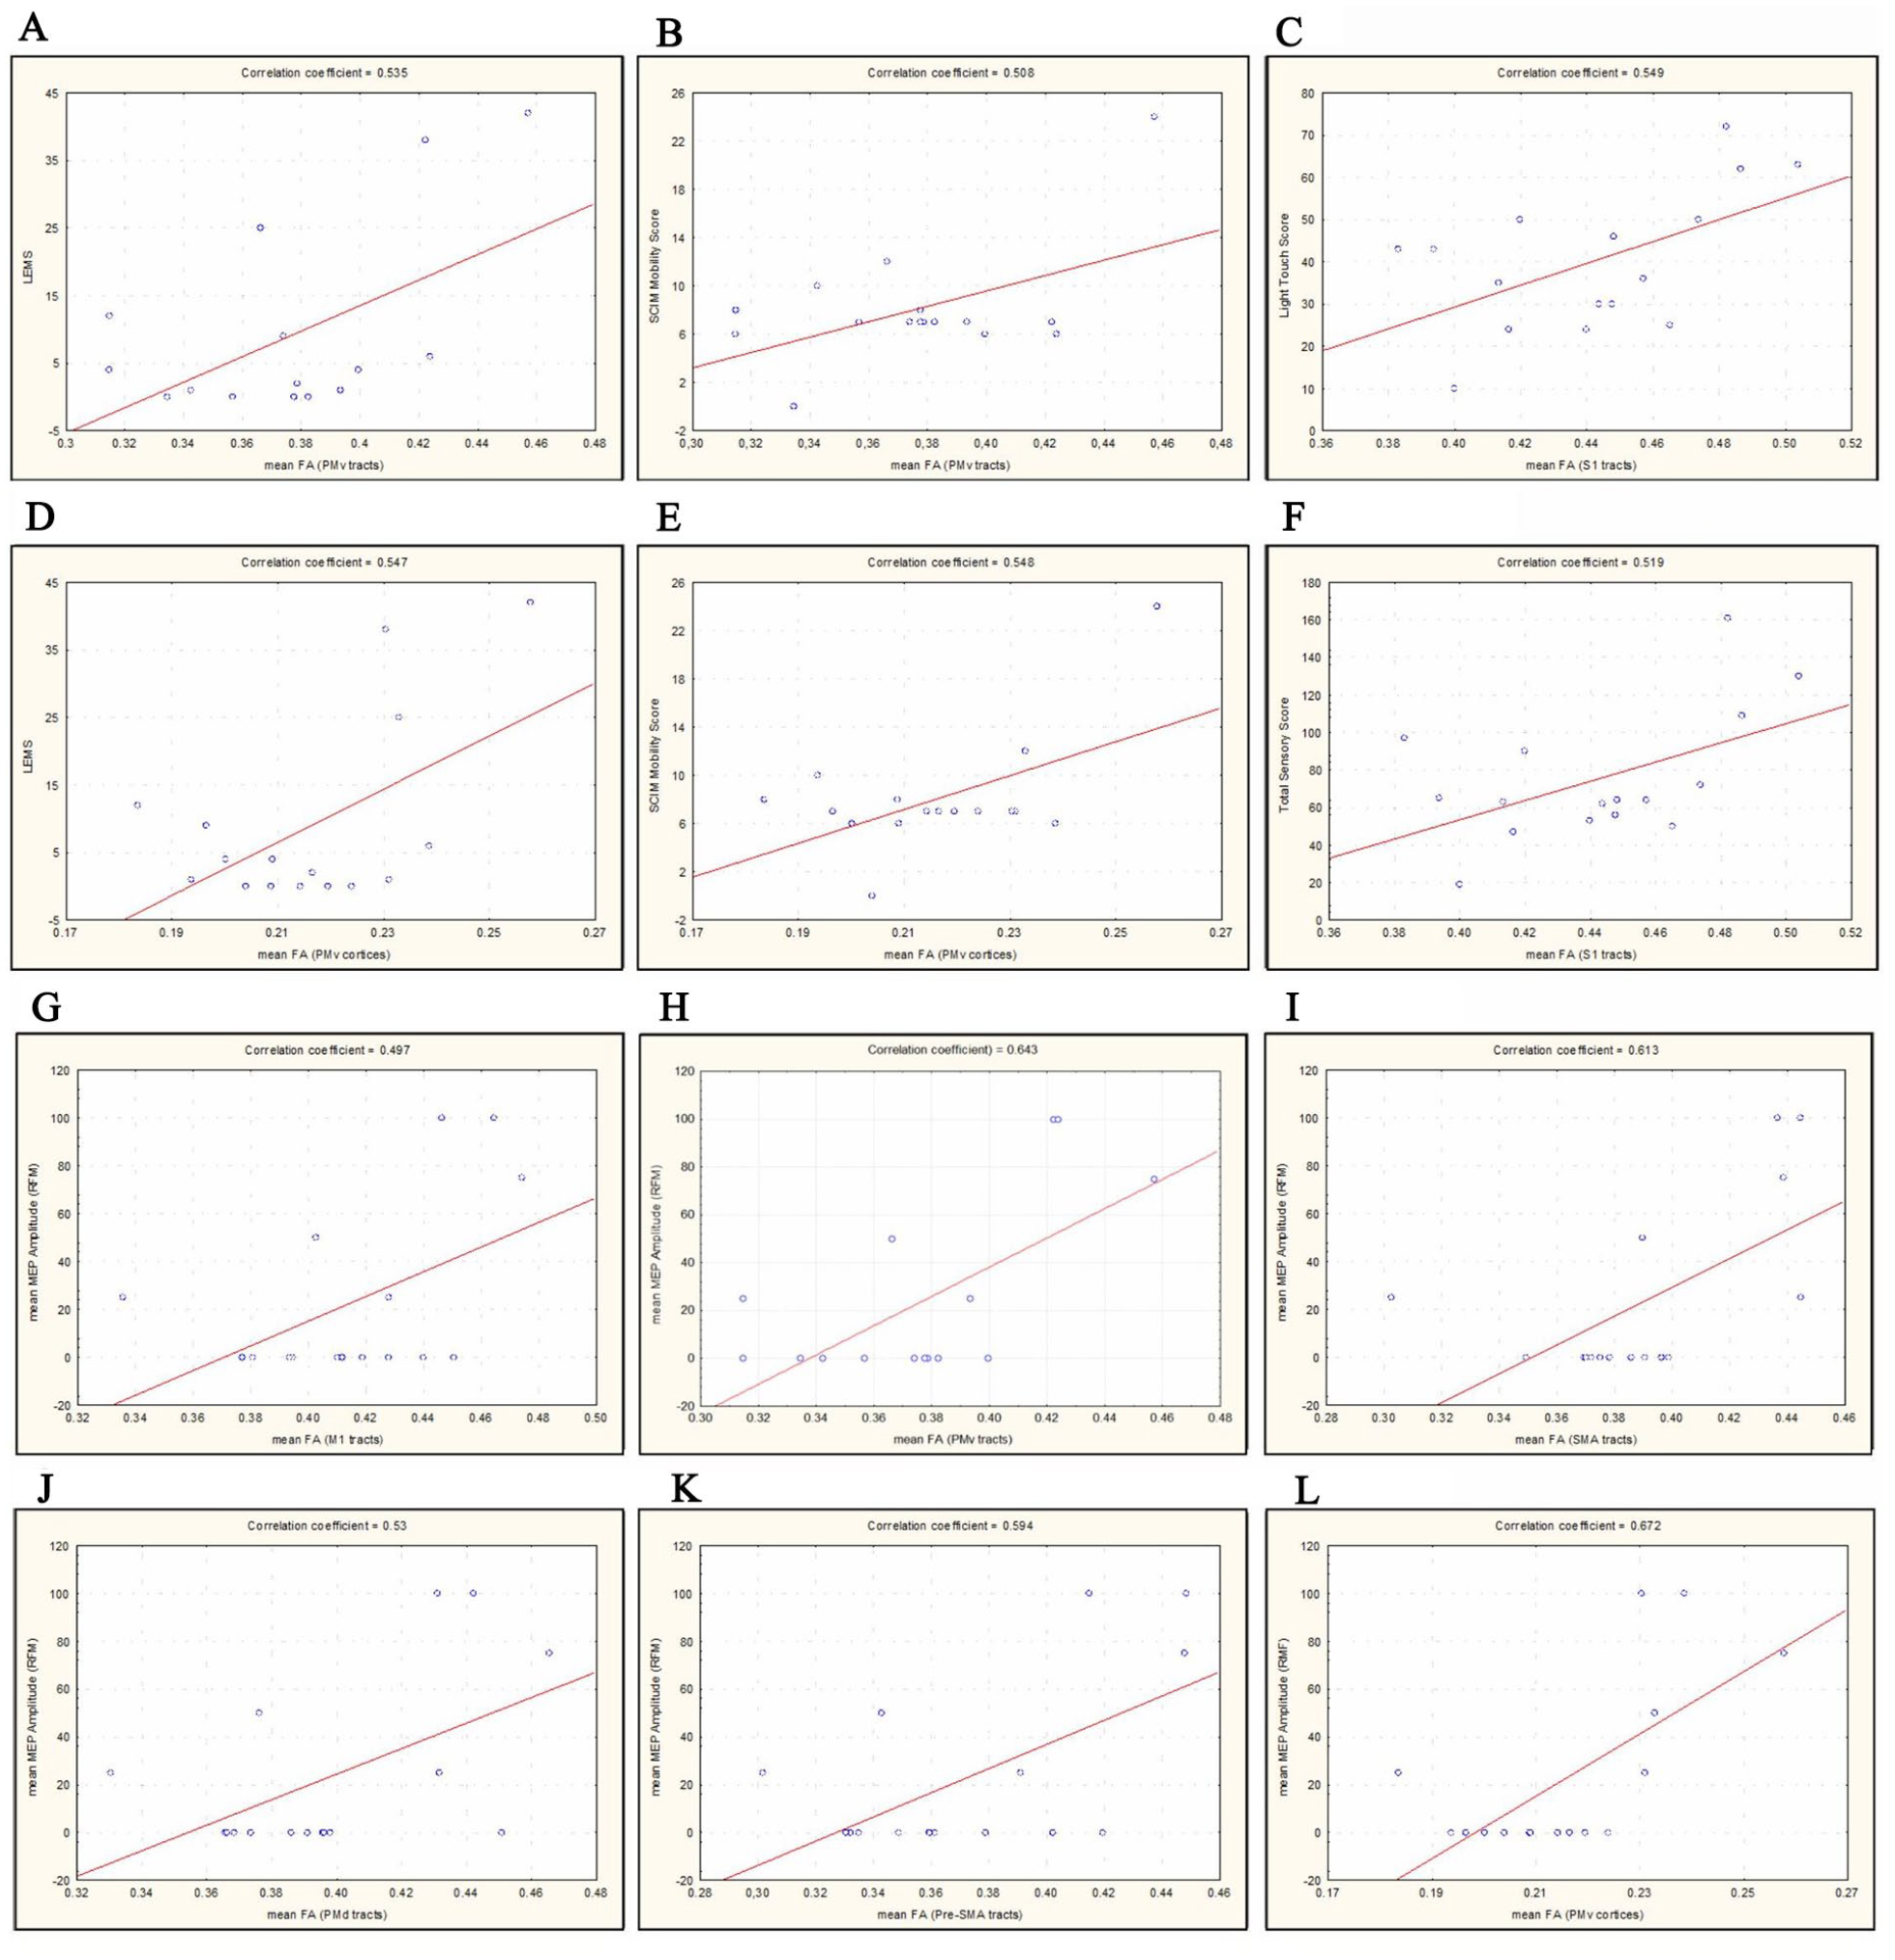
The graphical presentations of correlations between clinical motor and sensory scores and mean fractional anisotropy (FA) values from different cortical and white matter locations in t-SCI patients: (A) LEMS versus mean FA from PMv tracts, (B) SCIM Mobility Score versus mean FA from PMv tracts, (C) Light Touch Score versus mean FA from S1 tracts, (D) LEMS versus mean FA from PMv cortices, (E) SCIM Mobility Score versus mean FA from PMv cortices, and (F) Total Touch Score versus mean FA from S1 tracts as well as graphical presentations of correlations between motor evoked potential (MEP) amplitudes recorded from rectus femoris muscles (RFM) and mean fractional anisotropy (FA) values from different cortical and white matter locations in t-SCI patients: (G) mean MEP amplitude recorded from RFM versus mean FA from M1 tracts, (H) mean MEP amplitude recorded from RFM versus mean FA from PMv tracts, (I) mean MEP amplitude recorded from RFM versus mean FA from SMA tracts, (J) mean MEP amplitude recorded from RFM versus mean FA from PMd tracts, (K) mean MEP amplitude recorded from RFM versus mean FA from Pre-SMA tracts and (L) mean MEP amplitude recorded from RFM versus mean FA from PMv cortices.
Higher LEMS and SCIM mobility scores were associated with higher averaged FA values from PMv tracts and cortices. Sensory scores (Light Touch and Total Sensory Score) were associated with higher mean FA values from bilateral S1 tracts. The greatest number of positive correlations was found between MEP amplitudes recorded from both femoral muscles and mean FA values from all motor tracts (M1, PMd, PMv, pre-SMA, and SMA) as well as mean FA values from the PMv cortices. After combining all SCI patients in 1 group, significant positive correlations were found between motor scores (LEMS and SCIM mobility scores), MEP amplitudes recorded bilaterally from Thenar muscles, and mean FA values from the PMv cortices.
Discussion
The primary aim of the study was to quantitatively assess the extent of neurodegeneration in sensorimotor cortical areas and tracts in patients with chronic SCI using gray matter (HMAT) and white matter (SMAT) DTI templates, and to evaluate potential associations between microstructural injury and findings in neurological and neurophysiological examinations.
In our study, we found a significant decrease in FA values in the brains of SCI patients, both in white matter tracts and cortical areas, suggesting their remote degeneration. To our knowledge, the methodology using the SMATT and HMAT templates has not been applied before. Previous studies have reported lower FA values in the corticospinal tracts,28-31 cingulum,14,15 corpus callosum,14,15 thalamic radiation,15,30 and centrum semiovale 13 in various groups of patients with SCI. Neurodegeneration in SCI is believed to follow a specific gradient and is most pronounced in the locations closer to the site of the injury. 32 Our study supports this theory, showing a more pronounced decrease in FA within the white matter tracts and less severe changes in more remote cortical areas.
In our study, we have found that the only DTI parameter that showed differences between the evaluated subgroups was FA. Most previous studies also reported significant changes primarily in FA values, and much less frequently in other DTI metrics such as MD or AD.14,15,31 Additionally, in several previous reports there were also no significant changes found in parameters other than FA. 13 FA is the most extensively studied parameter and is believed to primarily relate to axonal count and myelin content. 33 On the other hand, AD and RD are thought to reflect rather the integrity of axons and myelin, respectively, 34 though this interpretation is still not supported by strong experimental evidence and should be approached with caution. 10
The lack of significant differences in diffusion parameters such as mean MD, AD, and RD between individuals with SCI and the control group may be attributed to several physiological mechanisms. One possible explanation is compensatory neural plasticity, which enables functional reorganization and strengthening of alternative neural pathways, potentially helping to preserve the integrity of white matter tracts.
In the chronic phase of SCI, the degenerative process may stabilize, resulting in MD, AD, and RD values that resemble those of healthy individuals.35,36 The limited sensitivity of these diffusivity metrics in detecting subtle changes in fiber coherence emphasizes the utility of FA in capturing such alterations. 37 Additionally, not all white matter tracts are equally affected by SCI, with some showing better preservation or repair, potentially explaining unchanged diffusivity values. 38 Technical factors such as partial volume effects and low spatial resolution may further obscure subtle changes. 39 These findings align with prior reports of preserved white matter integrity and neuroplastic stabilization in chronic SCI.35,38
When analyzing the larger group of all SCI patients in our study, we observed decreased FA primarily in white matter tracts such as M1, S1, PMd, or preSMA tracts and to a lesser degree in cortical regions such as M1, pre-SMA, and S1 cortices. In all subjects after SCI, the most severely affected gray and white matter regions were primary sensorimotor cortices and their associated tracts (M1 and S1). Nevertheless, microstructural damage was also present in the additional motor areas, such as PMd or preSMA, both in tracts and cortices, although the involvement was less severe than in the M1 and S1 locations. This suggests that microstructural injury may extend from the primary motor areas to broader brain cortical regions and additional tracts. Descending motor tracts undergo retrograde degeneration, which is most pronounced in the proximity of the site of the injury, while ascending tracts undergo Wallerian degeneration as their axon stumps are disconnected from their parental neuron. 40
On the other hand, our subgroup analysis revealed that only patients with tetraplegia showed significantly lower FA values compared to the control group. These changes were only detected in white matter tracts descending from M1 and ascending to S1, but not within the cortical regions.
In the literature, there are contradictory reports regarding the differences between different patient subgroups such as AIS A versus AIS B-D, c-SCI versus i-SCI, or p-SCI versus t-SCI subjects. Koskinen et al 13 reported no significant changes between the AIS A group with clinically complete injury compared to healthy controls, and Huynh et al 31 found only minor changes between ASIA-A and ASIA B-D in FA parameters in thalamic radiation. In our study, we did not find significant differences between p-SCI patients and healthy controls, which could be due to the fact that DTI parameters were measured from the entire M1 or S1 cortical regions or tracts, without distinguishing between areas responsible for upper and lower extremity function. Overall, higher FA values in p-SCI may result from the inclusion of normal FA results from unaffected upper extremities. It is not technically possible to perform more detailed parcellation of cortical regions or fiber tracts separately for upper and lower extremities using SMATT or HMAT templates. In our study we also did not find any significant alterations in the FA values within cortical regions even in the group of patients with tetraplegia, although such changes were observed in the combined SCI cohort. This may be explained by the small number of t-SCI subjects and the lower sensitivity of DTI in the assessment of cortical regions compared to white matter.
In the analysis of associations between DTI findings and clinical or neurophysiological metrics, we did not find any significant correlations between FA values and time since injury or injury level on MRI, AIS score, sensory and motor levels from neurological assessment, Upper Extremity Motor Score, Pinprick test, total SCIM score, or MEP latencies. However, we have revealed lower FA values in the cerebral white and gray matter of the sensorimotor regions were associated with lower LEMS and SCIM mobility scores, Light Touch and Total Sensory Scores, as well as reduced MEP amplitudes recorded from muscles of the upper and lower extremities. These findings may indicate more profound degeneration of sensorimotor structures in patients with more severe motor and sensory deficits as well as poorer outcomes of TMS stimulation in these patients. Patients with p-SCI showed only a single correlation of FA from the PMv cortex with Motor Scores and MEP amplitudes recorded from upper extremity muscles. The most notable findings were observed in the t-SCI subgroup, where lower motor scores were associated with lower FA values within PMv tracts and cortex, and lower sensory scores were associated with decreased FA values within S1 tracts. In this group we also revealed several positive correlations between MEP amplitudes from bilateral RF muscles and FA values within all motor tracts (including primary and supplementary motor areas) or from supplementary motor cortices such as PMv. The PMv is known to be involved in motor planning and has connections to various regions responsible for coordinating movement, including both the M1 and supplementary motor areas. Although the PMv is more prominently associated with upper limb control, it does have connections that can modulate lower extremity function indirectly, likely through broader motor networks. In cases of lower extremity impairment, structural changes, or decreased integrity in the PMv may reflect compensatory mechanisms or altered neural recruitment for lower limb function. 41
There are only a few reports evaluating the relationships between DTI metrics and various radiological or clinical parameters, with contradictory findings.13,15,31,42,43 In chronic SCI, no relationship between time since injury and DTI metrics has been reported in several previous studies.13,39,44 Some previous studies have reported that higher sensory scores were correlated with increased FA in the posterior thalamic radiation 15 and better motor scores were correlated with higher FA in the centrum semiovale 13 or corticospinal tracts. 31 To our knowledge, correlations between brain DTI parameters and MEP characteristics in patients with SCI have not been previously published. All previous studies correlated MEP results with DTI metrics from the spinal cord, not from the brain. Chen et al 45 found correlations between FA and ADC values from the injured spinal cord and MEP amplitudes, although their study was conducted on rats. On the other hand, Petersen et al 46 did not find any significant correlations between spinal cord DTI parameters, specifically between FA and ADC values, and MEP results in human subjects after SCI.
Our findings indicate that the response to TMS stimulation strongly depends on the quality of the efferent white matter tracts in the brain and, to a lesser extent, on the quality of the motor cortical regions. This is an important observation in terms of planning of physiotherapy interventions with rTMS in SCI patients which has become popular in recent years.19,21 Repetitive magnetic stimulation targeting specific regions and pathways within the central nervous system—such as the M1 cortex, corticospinal tract, and rubrospinal tract—has been shown to enhance functional recovery of the spinal cord. It appears to reduce spasticity and improve motor, and to a lesser degree, sensory functions in patients with SCI.22,47,48 The studies on effectiveness of rTMS in SCI patients show considerable variability, which may be not only due to technical issues of rTMS but also due to the inappropriate selection of patients with severely injured or degenerated cerebral white matter tracts or cortex, which may impair effective transmission of TMS impulses along descending spinal pathways. Evaluation of cerebral DTI parameters may serve as a predictor of favorable outcomes of rTMS therapy in subjects with good quality sensorimotor tracts and cortices at the microstructural level. Future studies are necessary to evaluate correlations between the outcome of applied TMS rehabilitation and initial DTI results from the cerebral motor tracts and cortices.
An important strength of our study is the use of 2 DTI templates, SMATT and HMAT, for the parcellation and evaluation of sensory and motor white matter tracts and cortices, covering both primary and supplementary motor areas. This approach has not previously been applied in the studies of SCI patients. Furthermore, the study was conducted on well-matched patient and control subgroups in terms of age and sex, ensuring robust group comparisons. The radiologist, neurologist, and neurophysiologist were blinded during patient evaluation and data acquisition, which further enhances the reliability of the findings. The DTI results were correlated with a wide range of radiological and clinical parameters, including MEP characteristics from TMS, which have not previously been evaluated in this context.
The main limitations of the study include its cross-sectional design and relatively small sample size, particularly when divided into subgroups of p-SCI and t-SCI or c-SCI and i-SCI. This limited sample size may have reduced the statistical power of the analyses, potentially increasing variability in results and underestimating the true effect sizes associated with the p-SCI group. Most studies involving SCI subjects face similar challenges with small sample sizes, which may limit the generalizability of findings. While the present study offers initial insights into the role of cortical degeneration in stratifying patients in interventional trials or as a potential outcome measure, the results should be considered preliminary. The observed patterns, although suggestive, are not definitive due to the limited sample size. Larger, prospective studies are needed to confirm these findings and further explore the clinical applicability of cortical degeneration measures. Such research will also help clarify whether these markers can reliably predict treatment response or disease progression, thereby contributing more robustly to future interventional studies.
Another limitation of the study is the inability to perform separate parcellations for upper and lower extremities using the SMATT and HMAT templates, which resulted in averaged DTI metrics. The HMAT, in particular, focuses on the lateral regions of the M1 and S1 cortices, which are primarily associated with the representation of the upper limbs. This focus on lateral cortical regions means that medial areas, including those representing the lower limbs, are less emphasized and potentially underrepresented in this template. As a result, there may be limitations in distinguishing between the cortical projections of the upper and lower extremities, particularly when comparing cervical and thoracic regions. This could partly explain why the UEMS shows relatively high amplitudes in the p-SCI group, despite comprising approximately one-third of the t-SCI group.
Conclusions
This is the first study to demonstrate extensive microstructural alterations within different areas of the sensorimotor cortex and associated white matter tracts in the primary, premotor, and supplementary motor areas in SCI patients. These changes can be assessed using the FA parameter from DTI, with parcellation based on SMATT and HMAT templates for white matter and cortical regions, respectively. Microstructural changes detected by DTI follow the neurodegeneration gradient and are more pronounced within the white matter tracts than in the cortex. These changes are most severe in t-SCI patients, where they also correlate with multiple clinical motor and sensory scores, as well as MEP amplitudes recorded from lower extremity muscles. The results of this DTI study enhance our understanding of cerebral pathology in SCI and offer potential biomarkers which could be used for in vivo assessment of microstructural cerebral abnormalities and remote neurodegeneration in SCI patients. While DTI metrics may hold promise as potential biomarkers for the in vivo assessment of these abnormalities, their sensitivity, and limitations warrant cautious interpretation. Further research is necessary to establish their utility in therapeutic monitoring, prediction of recovery, and stratifying patients for interventions such as rTMS.
Footnotes
Abbreviations (in Order of Appearance)
DTI diffusion tensor imaging
SCI spinal cord injury
p-SCI paraplegic patients
t-SCI tetraplegic patients
i-SCI incomplete spinal cord injury
c-SCI complete spinal cord injury
MEP motor evoked potentials
HMAT Human Motor Area Template
SMATT Sensorimotor Area Tract Template
FA fractional anisotropy
M1 primary motor cortex
S1 primary somatosensory cortex
Pre-SMA pre-supplementary motor area
SMA supplementary motor area
PMv ventral premotor area
mv car or bike accident
ft post-fall trauma;
RF rectus femoris
PMd dorsal premotor area
MD mean diffusivity
AD axial diffusivity
RD or radial diffusivity
qMRI quantitative MRI
TMS transcranial magnetic stimulation
rTMS repetitive transcranial magnetic stimulation
AIS ASIA Impairment Scale
SCIMt Spinal Cord Independence Measure Total Score
SCIMm Spinal Cord Independence Measure Mobility Score
UEMS Upper Extremity Motor Score
LEMS Lower Extremity Motor Score
Author Contributions
Anna Zimny: Conceptualization; Formal analysis; and Writing—original draft. Przemysław Podgórski: Data curation; Investigation; and Writing—review & editing. Weronika Machaj: Formal analysis and Writing—review & editing. Wojciech Fortuna: Investigation; Supervision; and Writing—review & editing. Juliusz Huber: Formal analysis; Investigation; Supervision; and Writing—review & editing. Barbara Bobek-Billewicz : Data curation; Supervision; and Writing—review & editing. Paweł Tabakow: Conceptualization; Project administration; Supervision; and Writing—review & editing.
Declaration of Conflicting Interests
The author(s) declared no potential conflicts of interest with respect to the research, authorship, and/or publication of this article.
Funding
The author(s) disclosed receipt of the following financial support for the research, authorship, and/or publication of this article: The study was supported by grant NCBiR ERA-NET-NEURON/13/2018 and Wroclaw Medical University grant SUBZ.C270.25.092.