
Abstract
Background:
In humans, most spontaneous recovery from motor impairment after stroke occurs in the first 3 months. Studies in animal models show higher responsiveness to training over a similar time-period. Both phenomena are often attributed to a milieu of heightened plasticity, which may share some mechanistic overlap with plasticity associated with normal motor learning.
Objective:
Given that neurorehabilitation approaches are frequently predicated on motor learning principles, here we asked if the sensitivity of trial-to-trial learning for 2 kinds of motor learning processes often involved during rehabilitation is also enhanced early post-stroke. In a cross-sectional design, we compared (1) reinforcement and (2) error-based learning in 2 groups: 1 tested within 3 months after stroke (early group, N = 35) another tested more than 6 months after stroke (late group, N = 30). These 2 forms of motor learning were assessed with variations of the same visuomotor rotation task. Critically, motor execution was matched between the 2 groups.
Results:
Reinforcement learning was impaired in the early but not the late group, whereas error-based learning was unimpaired in either group. These findings could not be attributed to differences in baseline execution, cognitive impairment, gender, age, or lesion volume and location.
Discussion:
The presence of a deficit in reinforcement motor learning in the first 3 months after stroke has important implications for rehabilitation.
Conclusion:
It might be necessary to either increase reinforcement feedback given early after stroke, increase the dose of rehabilitation to compensate, or delay onset of rehabilitation approaches that may rely on reinforcement, for example, constraint-induced movement therapy, and instead emphasize other forms of motor training in the subacute time period.
Introduction
Most upper limb motor recovery in humans and non-human animal models takes place early after stroke (~1-3 months in humans and ~1-3 weeks in rodents), a phenomenon that has been termed “spontaneous biological recovery.” It has also been observed that the response to training seems to be greatest within this early time window in both animal models and humans.1,2 Animal models suggest that specific stroke-induced plasticity changes in cortex overlap with those seen during motor learning.3,4 For instance, different groups have described an enhancement of long-term potentiation (LTP) in the peri-infarct tissue early after stroke.5-7 Motor skill learning also depends on LTP-mediated strengthening of synapses.8-10 These 2 sets of observations in animals raise the possibility that motor learning capacity might be enhanced during the period of spontaneous biological recovery in humans.
Most studies investigating motor learning after stroke probe subjects in the chronic stage and in general fail to find learning deficits in supratentorial strokes if performance confounds are corrected for. 11 Those studies that examined motor learning in the acute or subacute stage did not include a chronic group for comparison,12,13 or did not separate post-stroke stage in their analysis.14,15
Overall, it remains unknown whether motor learning is enhanced over the time-period when spontaneous biological recovery and a heightened response to training occur. Here, we investigated whether patients with stroke have an increased capacity for 2 types of motor learning (reinforcement and error-based) that play significant roles in rehabilitation therapy approaches early and late after stroke.16,17-19
Error-based adaptation of movements can be defined as adaptive changes that are driven by sensory-prediction and target errors. Reinforcement learning on the other hand can be defined as adaptive changes driven by binary success or failure. 20
Both adaptation and reinforcement learning are associated with plastic changes in cortico-cerebellar and cortico-basal ganglia loops, respectively. We hypothesized that enhanced post-stroke plasticity in the sub-acute stroke period might extend to both circuits. However, given that hyperplasticity might be a localized phenomenon it is possible that 1 learning mechanism might be more affected than the other. Critically, to assess learning in patients early and late after their stroke, we had to use a cross-sectional design to carefully match baseline execution ability at each time point to avoid the performance confound. 21 This matching would not have been possible if we had studied the same patients longitudinally, as normal recovery would have changed their impairment level at different time points, and they would no longer be naïve to the tasks on subsequent exposure.
Methods
Participants
We recruited 70 participants for the Physiology and Learning After Stroke study either within the first 2 months after stroke (sub-acute period; early group), or ≥6 months after stroke (late group) and 17 age-matched healthy control participants from 2 centers (Johns Hopkins University, USA and Cereneo Centre for Neurology and Rehabilitation, CH). The recruitment of patients for the early group occurred within the first 2 months post-stroke to ensure that all assessments were conducted within the critical 3-month period. All patients met the following inclusion criteria: First-ever ischemic stroke with motor symptoms confirmed by imaging, supratentorial lesion location, and 1-sided upper extremity weakness (MRC < 5).
We excluded patients with minimal motor deficits in the first evaluation, defined as Fugl-Meyer Score (FMS) of the upper extremity >63/66 at recruitment (at the time point of testing 2 participants had recovered to FMS of 64 and 1 participant to a FMS of 65), age <21 years, hemorrhagic stroke or space-occupying hemorrhagic transformation, global inattention, visual field cut > quadrantanopia, receptive aphasia, inability to give informed consent or understand the tasks, and other neurological or psychiatric illness that could confound execution/recovery. See Table 1 for details of patient characteristics.
Clinical Characteristics and Reaching Parameters.
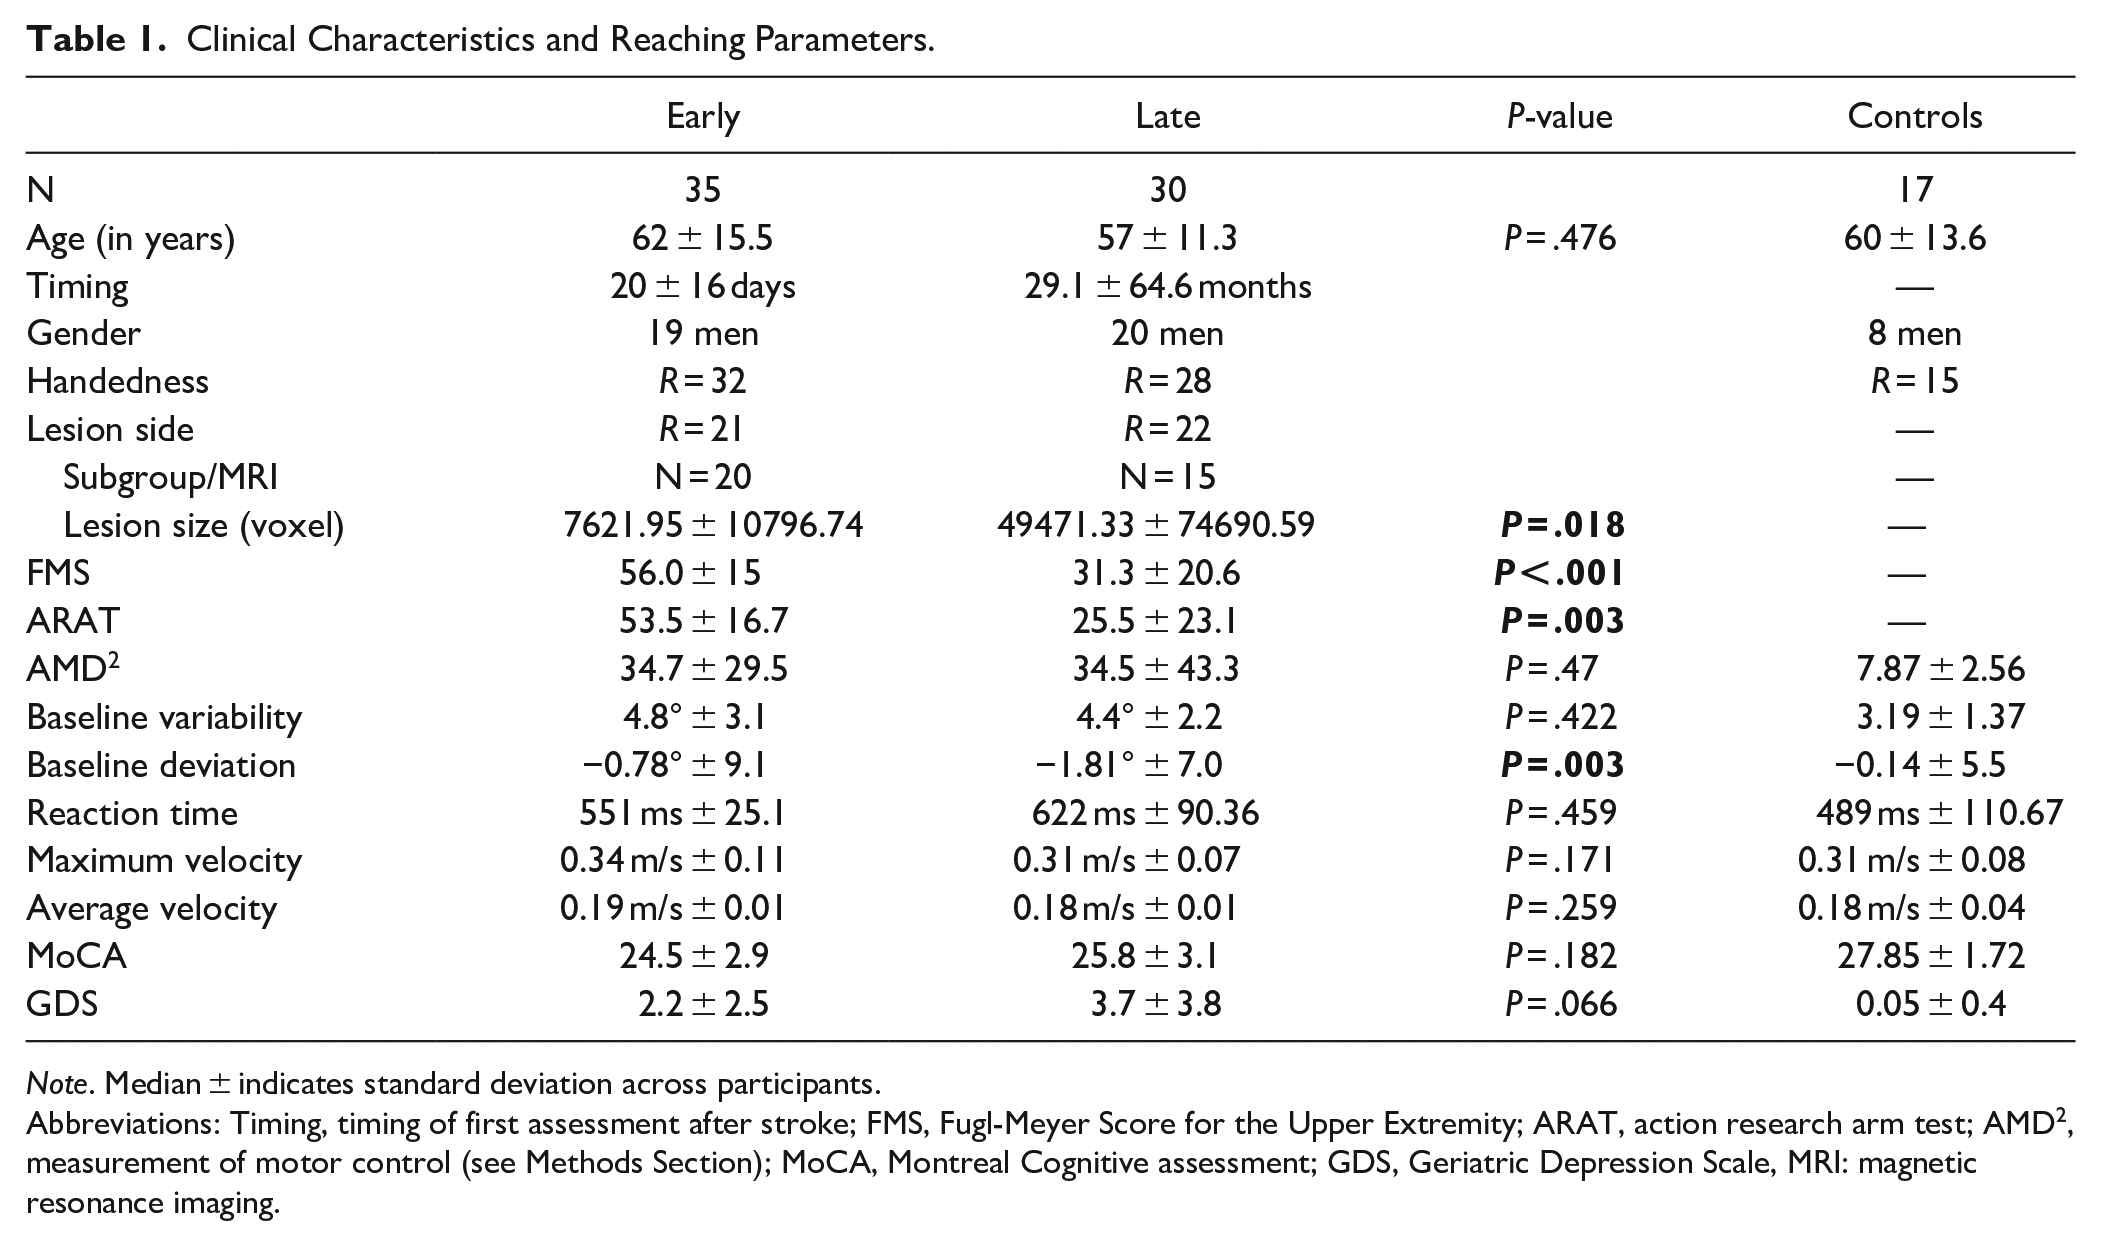
Note. Median ± indicates standard deviation across participants.
Abbreviations: Timing, timing of first assessment after stroke; FMS, Fugl-Meyer Score for the Upper Extremity; ARAT, action research arm test; AMD 2 , measurement of motor control (see Methods Section); MoCA, Montreal Cognitive assessment; GDS, Geriatric Depression Scale, MRI: magnetic resonance imaging.
The Ethics boards at Johns Hopkins School of Medicine Institutional Review Board and the Ethics Committee of Northwest and Central Switzerland approved the experiments in accordance with the Declaration of Helsinki. All participants provided written informed consent.
Study Design
We chose a cross-sectional approach between early versus late recovery periods to be able to match the participants’ ability to execute the motor tasks at baseline. This is critical in studies of motor learning in patients with stroke since it avoids differences in execution before training starts as well as the changes that might occur over time due to motor recovery. Within each group and controls, we tested outcome metrics at 2 time points 1 month apart (T1 and T2). This was done to determine if rapid recovery changes that can be observed over a few weeks’ period affected learning. At each time point, we collected clinical and motor task data for the reinforcement task; the error-based task was only performed at T1 (see Figure 1). T1 entailed multiple days of testing wherein the reinforcement and error-based learning tasks were randomly assigned on different days. We completed testing at T1 within 7 days (max of 5 days between the 2 motor tasks) and within 1 day for T2. To determine the total magnitude of learning that can be expected by a population in the same age group as our individuals with stroke, we also assessed 17 age-matched, healthy participants with the same 2 reaching tasks at T1 & T2.
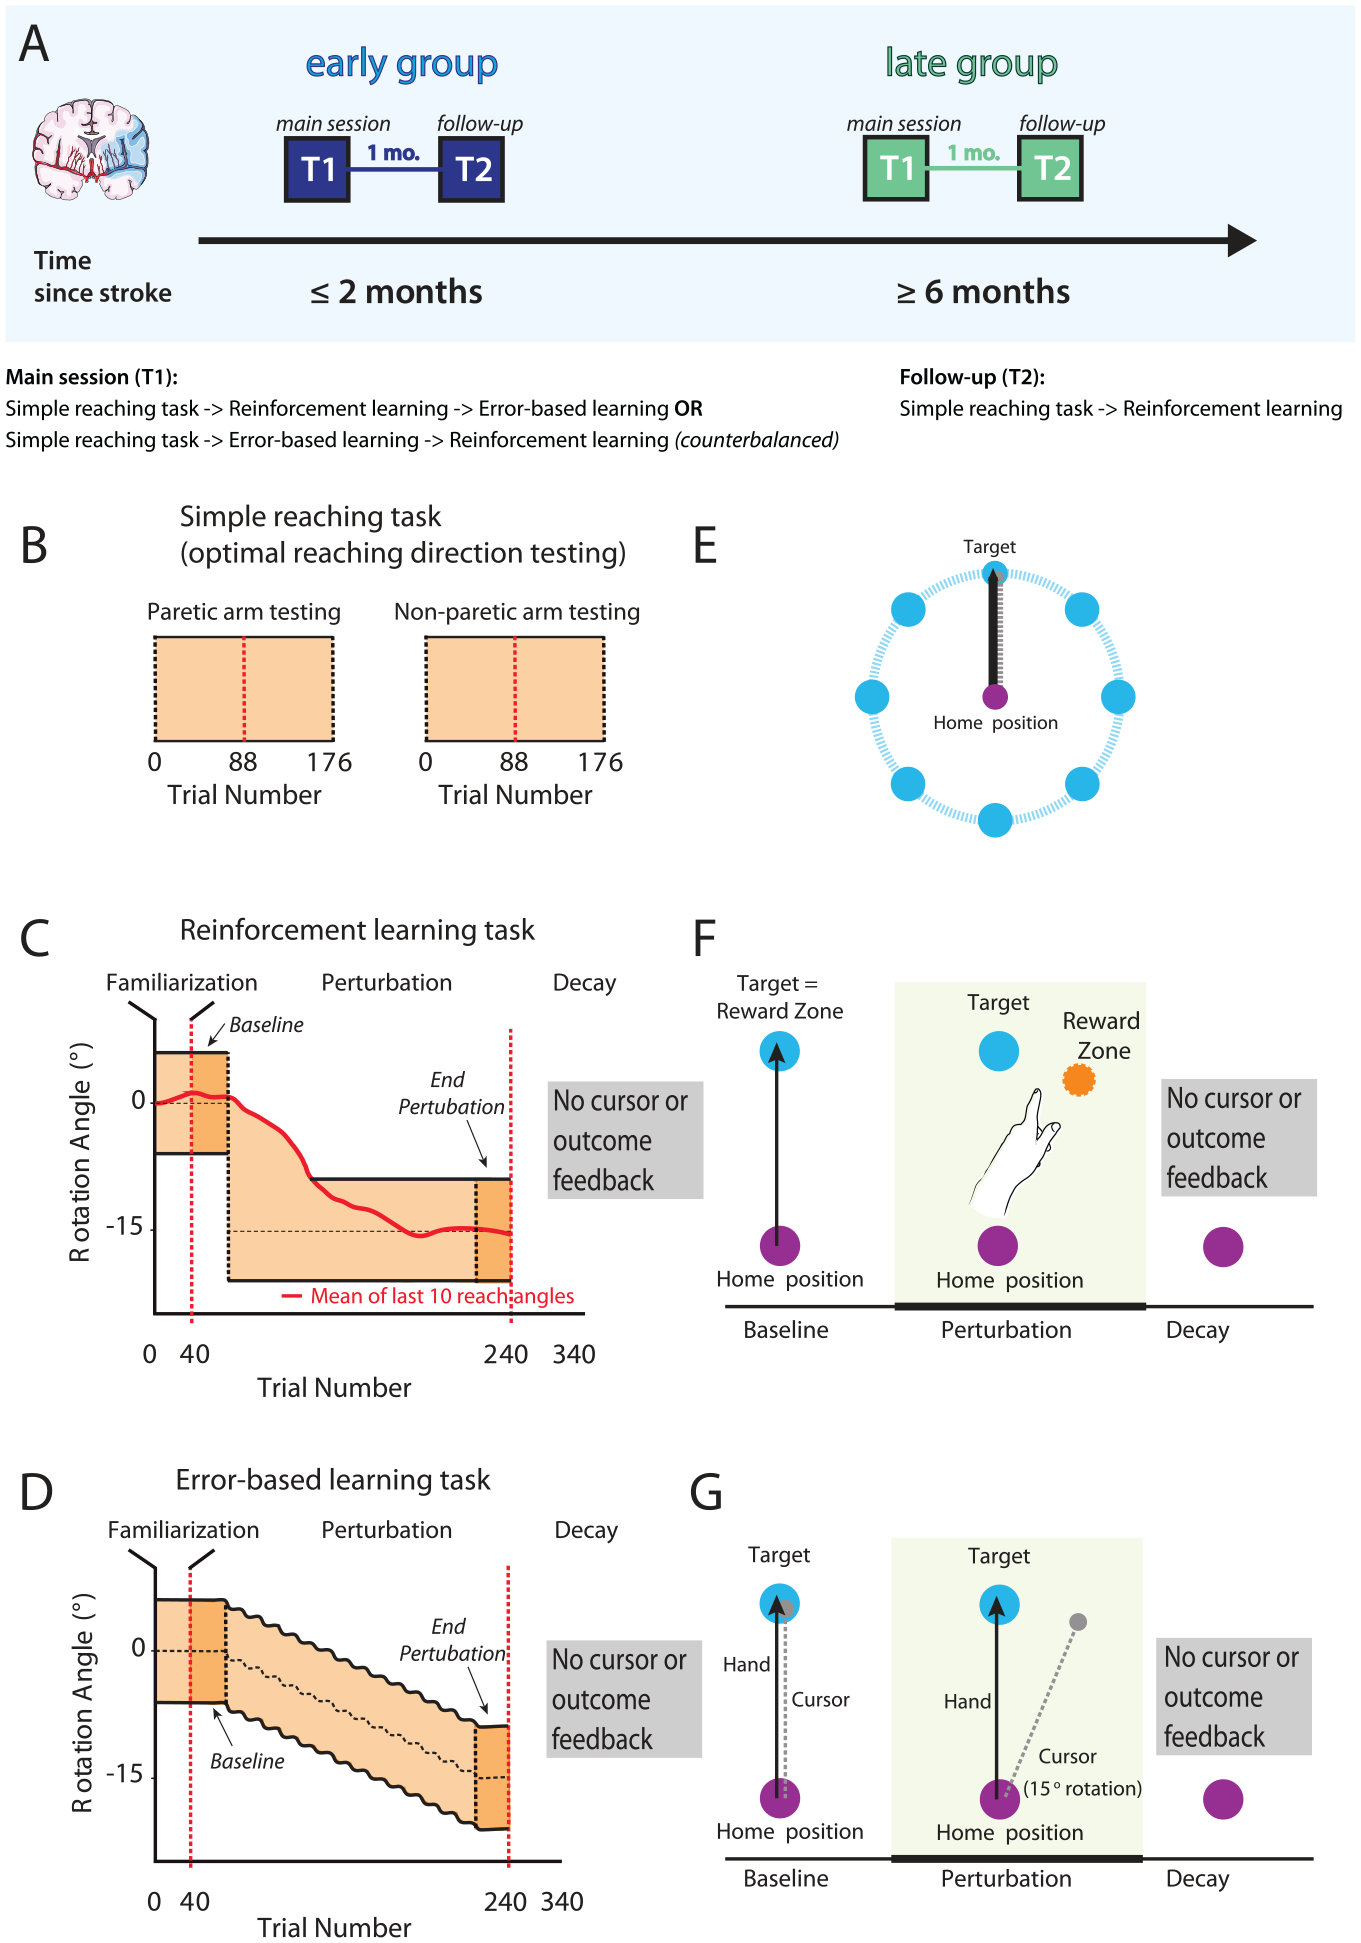
Study design and task overview with feedback conditions. (A) We recruited 2 separate groups of patients with stroke; 1 at the subacute stage (≤3 months, early group) and another 1 in the chronic period (≥6 months, late group). Participants performed 2 different motor learning tasks, a reinforcement-based and a visuomotor error-based task, with the reinforcement being conducted at 2 time points separated by a month (T1 and T2). (B and E) Prior to the learning tasks, participants were tested for their motor execution ability. They performed point-to-point reaching movements from the home position to 8 different targets radially arranged at a distance of 10 cm from the home position. The 2 adjacent movement directions with the best motor execution ability were then used for the subsequent learning tasks. (C and F) After a baseline period to familiarize participants with the task, cursor rotation was gradually introduced until −15°. In the reinforcement task no cursor feedback was provided, instead participants received only binary feedback about task success or failure if their reaches fell between the mean of the participant’s previous 10 reaches and the outer bound of the reward zone to −15°. (D and G) In the error-based learning task participants received online feedback on the cursor trajectory. After the baseline 40-trial period, a visuomotor rotation of 1° was imposed, and kept increasing by 2° every 20 trials. Reward zone in both tasks is marked in light orange. To assess learning we compared performance in the Baseline and End perturbation trials (first and last 40 trials of task). Within both groups clockwise or counter-clockwise rotation was counterbalanced, but later flipped for analysis. Image adapted after Therrien et al. 22 The red dashed vertical lines in B, C, and D indicate within-task rest breaks.
Clinical Data
We used the Fugl-Meyer Upper extremity score (max. score 66), and the Action Research Arm Test (ARAT, max. score 57) to assess impairment or functional deficits.23,24 Both measures were video recorded and graded by 2 trained assessors independently. Additionally, we collected the Montreal Cognitive Assessment (MoCA, max. score 30), and the Geriatric Depression scale (max. score 15), to capture cognitive impairment or depression, respectively.25,26
Motor Learning Tasks
Set-up
To assess learning capacity, we investigated changes in performance in 2 different previously-published motor tasks; a reinforcement and an error-based task.22,27 Participants executed reaching movements with their paretic arm on a two-dimensional plane while sitting in a KINARM exoskeleton robot (B-KIN Technologies) or the KINEREACH apparatus which provides antigravity support. 28 We concealed arm movements with a screen and all visual feedback was projected onto the screen’s surface at the level of hand movement.
Matching of Baseline Reaching Execution Ability Across Groups
To ensure the ability to execute movements across groups was similar and avoid a performance confound, we matched patients’ motor control abilities at baseline using a global kinematic measure developed from a 2-dimensional reaching task in a previous study.29,30 The task was designed to minimize the need for antigravity strength and prevent compensatory strategies.
Patients performed 10 cm point-to-point reaching movements from a home position to 8 surrounding targets (176 reaches total/22 reaches per target in random order, target diameter 1 cm, arrayed radially, see Figure 1B and E). The 2 adjacent target directions with the best execution (based on length of reach and successful target acquisition) were assigned as target directions for the motor learning tasks to optimize the ability to learn the tasks. This test was performed prior to the motor learning tasks. Note that this motor control task examined both paretic and non-paretic motor performance as part of a separate study; however, the motor learning tasks were only assessed in the paretic upper extremity. Here, we only used the motor control task data from the paretic arm to select target directions for our learning tasks.
Using the same reaching data, we assessed motor control by using functional principal component analysis combined with the squared Mahalanobis distance (see Cortes et al 30 for a detailed description). This method computes a metric of the similarity between patients’ movement trajectories to those of a healthy, age-matched control group. The average squared Mahalanobis distance (AMD 2 ) was then calculated for each individual and each target; we later used this metric to account for any execution confounder in our learning tasks. AMD 2 itself represents how far away patients’ trajectories are from the average trajectories of the control population, normalized by the variability within the control population. Given within-control variability, the AMD 2 will be nonzero for controls themselves. To estimate this baseline AMD 2 for controls, to serve as reference to the AMD 2 values reported for the patient groups, we calculated the AMD 2 between the trajectories of each control versus the average trajectory of all other controls.
Tasks Procedure
The reinforcement and error-based learning task used in this study have been adapted from Therrien et al. 26 Instructions for both tasks were read to participants for standardization. All participants completed both tasks using only their paretic arm. The control group also used the same arm for both tasks, but arm selection was randomized to balance the number of right-arm and left-arm control datasets (N = 9 right arm and N = 8 left arm). Participants performed the first learning task (error-based or reinforcement, the order was balanced) on the same day as the direction testing task (separated by a rest break) or on a subsequent day.
We instructed participants to make quick, 10-cm shooting movements from the home position through a single target. All participants performed a block to familiarize with the task (40 trials). At this familiarization phase a white cursor represented the position of the index finger. To start a trial, the cursor had to be held stable in the start position (purple, radius 1 cm) before the target appeared (light blue circle, radius 1 cm). The trials ended when the participant exceeded a distance of 10 cm. To match movement times across both patient groups, we indicated too fast and too slow trials by a color change of the target (<200 ms = orange and >800 ms = dark blue). Participants completed 340 reaches overall, over 3 blocks (Familiarization: 40 trials; Learning block: 40 Baseline and 160 Perturbation trials, Decay block: 100 trials).
In the perturbation phase, we introduced a gradual 15° rotation over 160 trials unbeknownst to the participant. Within each group clockwise or counter clockwise rotations were counterbalanced. The rotation started after 40 trials. In both tasks, we did not provide any cursor or outcome feedback during the Decay phase. Within each experiment, blocks were separated by rest breaks that were a minimum of 1 minute long, though they could be extended if the participant needed more rest. There was 1 break between the 2 blocks examining paretic movement in the simple reaching task, and 2 between-block breaks for each learning task (see Figure 1).
Reinforcement Task
Here, participants did not get online cursor feedback, but only binary feedback for the trial outcome (the target turned green for successful hits and red for missed trials) based on the rotation angle. Outcome was based on comparing the reaching angle on the current trial with the moving average from the previous 10 trials. We provided reinforcement (green target) if the reaching angle was within the perturbed target direction (15° ± target width), or if the reaching angle was closer to the trained 15° perturbation compared to the moving average (Figure 1C). We provided failure signals (red target) if the opposite were true. Because no online cursor feedback was available in these and all subsequent trials, the only information provided at the end of each trial was the successful acquisition of reward (R+) or failure (R−). Trials that were too fast or too slow were given feedback unrelated to success/failure (the target turned light blue for trials that were too slow, and orange for trials that were too fast), discarded, and then repeated.
Error-based Task
Here, participants received online feedback on the cursor trajectory. After the baseline 40-trial period, a visuomotor rotation of 1° was imposed and kept increasing by 2° every 20 trials up to 15°.
Importantly, the magnitude of behavioral change expected after training (a 15° shift in reaching direction) was the same across tasks. Task order and perturbation direction were counterbalanced within groups. Like in the reinforcement task, at the end of each trial, the target turned dark blue or orange for trials that were too slow or too fast, respectively, in order to encourage timing that matches that of the reinforcement task. Unlike the reinforcement task, however, these trials were not discarded or repeated, since error-based feedback (online cursor) for that trial was nevertheless received. If the timing was within the ideal range, the target would turn green if the movement had passed through the target and would disappear if it missed it. We chose to give this neutral cue in the case of miss in order to minimize the likelihood of a potential negative reward signal, with the limitation that omission of an endpoint signal could be perceived as a (weak) negative reward signal.
Explicit endpoint feedback (in addition to online cursor feedback) is typical in error-based learning tasks (eg, Therrien et al, 22 de Brouwer et al, 31 Diedrichsen et al, 32 and Quattrocchi et al 33 ). This type of feedback may appear similar to what given for reinforcement-based learning; moreover, reaching the target may be itself implicitly rewarding. In spite of these apparently reward-like task outcome elements, however, research has shown that learning in error-based tasks is principally driven by the sensorimotor error. Learning from sensorimotor error proceeds even if doing so increases task performance error—that is missing the target by larger and larger margins34,35—or has no effect upon it. 36 While recent research has shown secondary interactions between task errors and error-based learning, these have very limited effects in the magnitude of learning, and task errors are unable to induce error-based learning on their own.37,38
Data Analysis
We flipped data from counter-clockwise sessions to analyze together with clockwise sessions. Both groups showed comparable numbers of trials that were repeated due to time violations in the reinforcement learning task.
We recorded hand position and velocity at the fingertip at 1000 Hz (KINARM) or 420 Hz (KINEREACH) and analyzed offline with MATLAB. Following previous work, we chose to measure reach angle degree as the primary outcome metric.22,27,33,39 We measured this from the start position to when the cursor crossed the target distance (10 cm away).
For both tasks, we assessed learning in 2 different ways. First, we measured the difference between Baseline and End perturbation (average reaching angle for the last 40 trials of perturbation minus the first 40 trials of the baseline, Total Learning). Second, we assessed the total reaching angle deviation during End perturbation across groups.
Since motor learning can be defined by 2 distinct characteristics, acquisition and forgetting, we also assessed whether the time after stroke affected the magnitude of acquisition and its subsequent decay across groups. To this end, we computed the difference in average reaching angle between the End perturbation and Early Decay trials (D = last 40 trials of End perturbation − first 40 trials of Decay) for the whole group and the baseline matched subgroup.
To rule out other execution factors that can result in learning differences across groups, we assessed movement direction deviation and variability at baseline (average reaching angle compared to 0° and average standard deviation of reaching angles at Baseline), reaction time, average, and maximum velocity for all trials during the perturbation phase.
Imaging
In the subset of patients that underwent clinical magnetic resonance imaging (MRI), we performed a post-hoc analysis of lesion volume and location. A trained neurologist manually delineated lesion boundaries on each axial slice of a subject’s T2-weighted FLAIR or DWI image using MRICron software (http://www.mricro.com/mricron), see Figure 5 for averaged lesion distribution map. All imaging data was flipped to the left hemisphere for further analysis. We normalized the obtained volume of interest (VOI) to the Montreal Neurological Institute (MNI) template using the clinical toolbox (http://www.nitrc.org/projects/clinicaltbx) with SPM12 (http//fil.ion.ucl.ac.uk/spm). We co-registered the T2 image to the T1 image and use these parameters to reslice the lesion into the native T1 space. We parcellated the brain in different regions (ie, regions of interest [ROIs]) using the JHU-MNI atlas. 40 This atlas is implemented in the NiiStat software and contains 185 different ROIs covering the whole brain. To calculate the percentage of damage of the VOI for specific ROI that have been implicated in reinforcement learning (orbitofrontal cortex, amygdala, caudate, putamen, nucleus accumbens, and substantia nigra) we used NiiStat (https://www.nitrc.org/projects/niistat).
Statistics
Because the assumption for normality was not fulfilled for most reaching related variables, we used permutation testing to assess differences between groups. 41 We reassigned participants randomly to either the “early” or “late” group, and the difference between the resampled groups was computed. This procedure was repeated 10 000 times, allowing us to generate a null distribution that assumes no group differences. The proportion of resampled values that exceeded the true observed difference was used to compute P-values and determine statistical significance (alpha-level 0.05, corrected for multicomparison using the Bonferroni correction method).
Under the null hypothesis, the true difference between the 2 groups should lie within the distribution of these randomly generated differences, with extreme values providing evidence against the null hypothesis. We used this approach for all outcome variables unless explicitly stated differently. We used the same methods for the comparison of both stroke groups and the healthy control participants. Permutation testing was used for all group comparisons presented in the result section, if not stated differently.
Total lesion volume as well as percentage of damage for the different ROI implicated in reinforcement learning was compared between groups using a simple 2-sided Student’s t-test and, where appropriate, multiple testing correction was performed. All data are expressed as median ± standard deviation unless stated otherwise. Statistical analyses were performed using custom-written MATLAB and R routines.
Data Availability
Data and custom-written code is available at https://github.com/MeretBransch/Palas.git.
Results
We enrolled a total of 70 patients in the study. We excluded 5 patients (1 because of a MoCA score below 20, indicating significant cognitive impairment, 2 because of protocol time violation, and 2 because of technical problems). The early group included 35 participants (median = 20 days after the insult, range = 6-58 days), whereas the late group included 30 participants (median = 29.1 months after stroke, range = 7 months-30 years). We also collected data from healthy control participants (N = 17; see Table 1 for clinical characteristics per group and Supplemental Table 2 per individual participant). Handedness and stroke side were evenly distributed among both the Early and Late group; this holds significance because recent research suggests that lesion lateralization is associated with distinct deficits in visuomotor adaptation.42-44
Data collection problems occurred during the reinforcement task in 2 patients from the early group and in the error-based task for 1 person from the late group (note the exact N of participants for each task in Figures 2 and 3). For an overview of all results see also Supplemental Table 3.
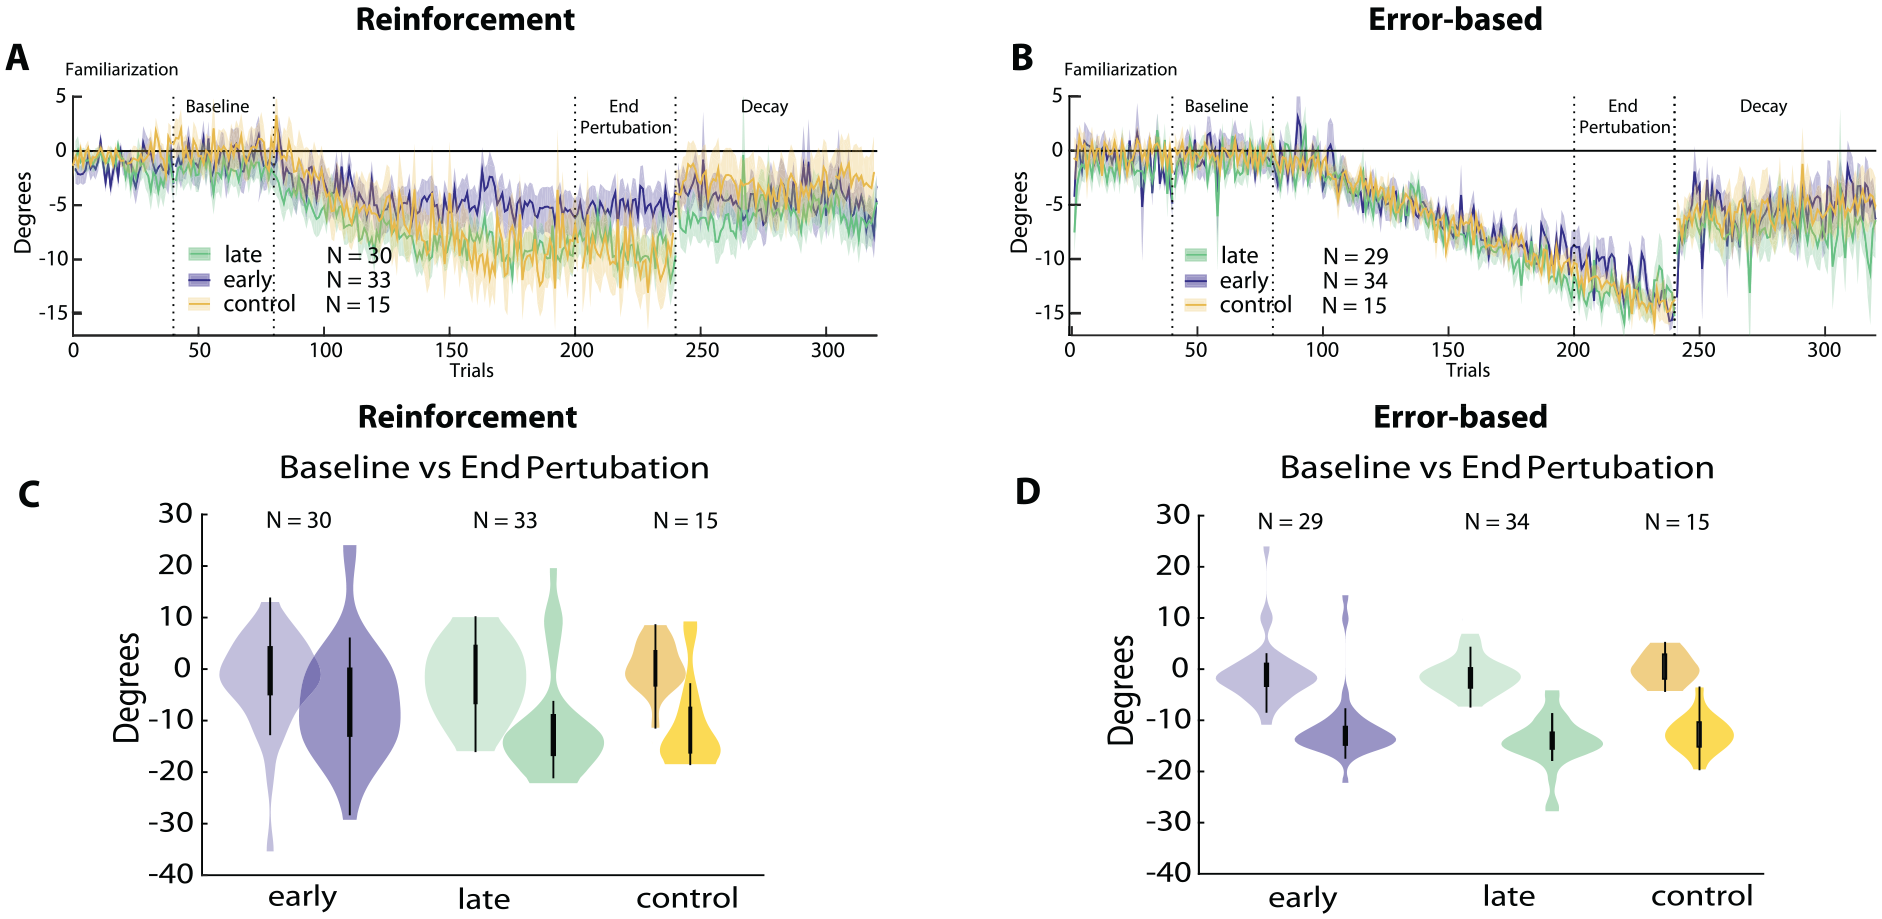
Reinforcement versus error-based learning at 2 stages after stroke. Results for the reinforcement task are shown on the left, error-based task on the right. (A and B) Changes in reaching angle over trials. (Familiarization = 40 trials, Baseline = 40 trials before introducing rotation, End perturbation = last 40 trials of rotation, Decay = 100 trials without any feedback). Plain lines indicate mean values, shading indicates standard error of mean. Early group in blue, late group in green, and controls in yellow. (C and D) Comparison for Baseline versus End perturbation across all groups. In the violin plots thick central lines represent the median of data, thin lines indicate interquartile range, and the width of the shaded area covers the distribution density of the data points.
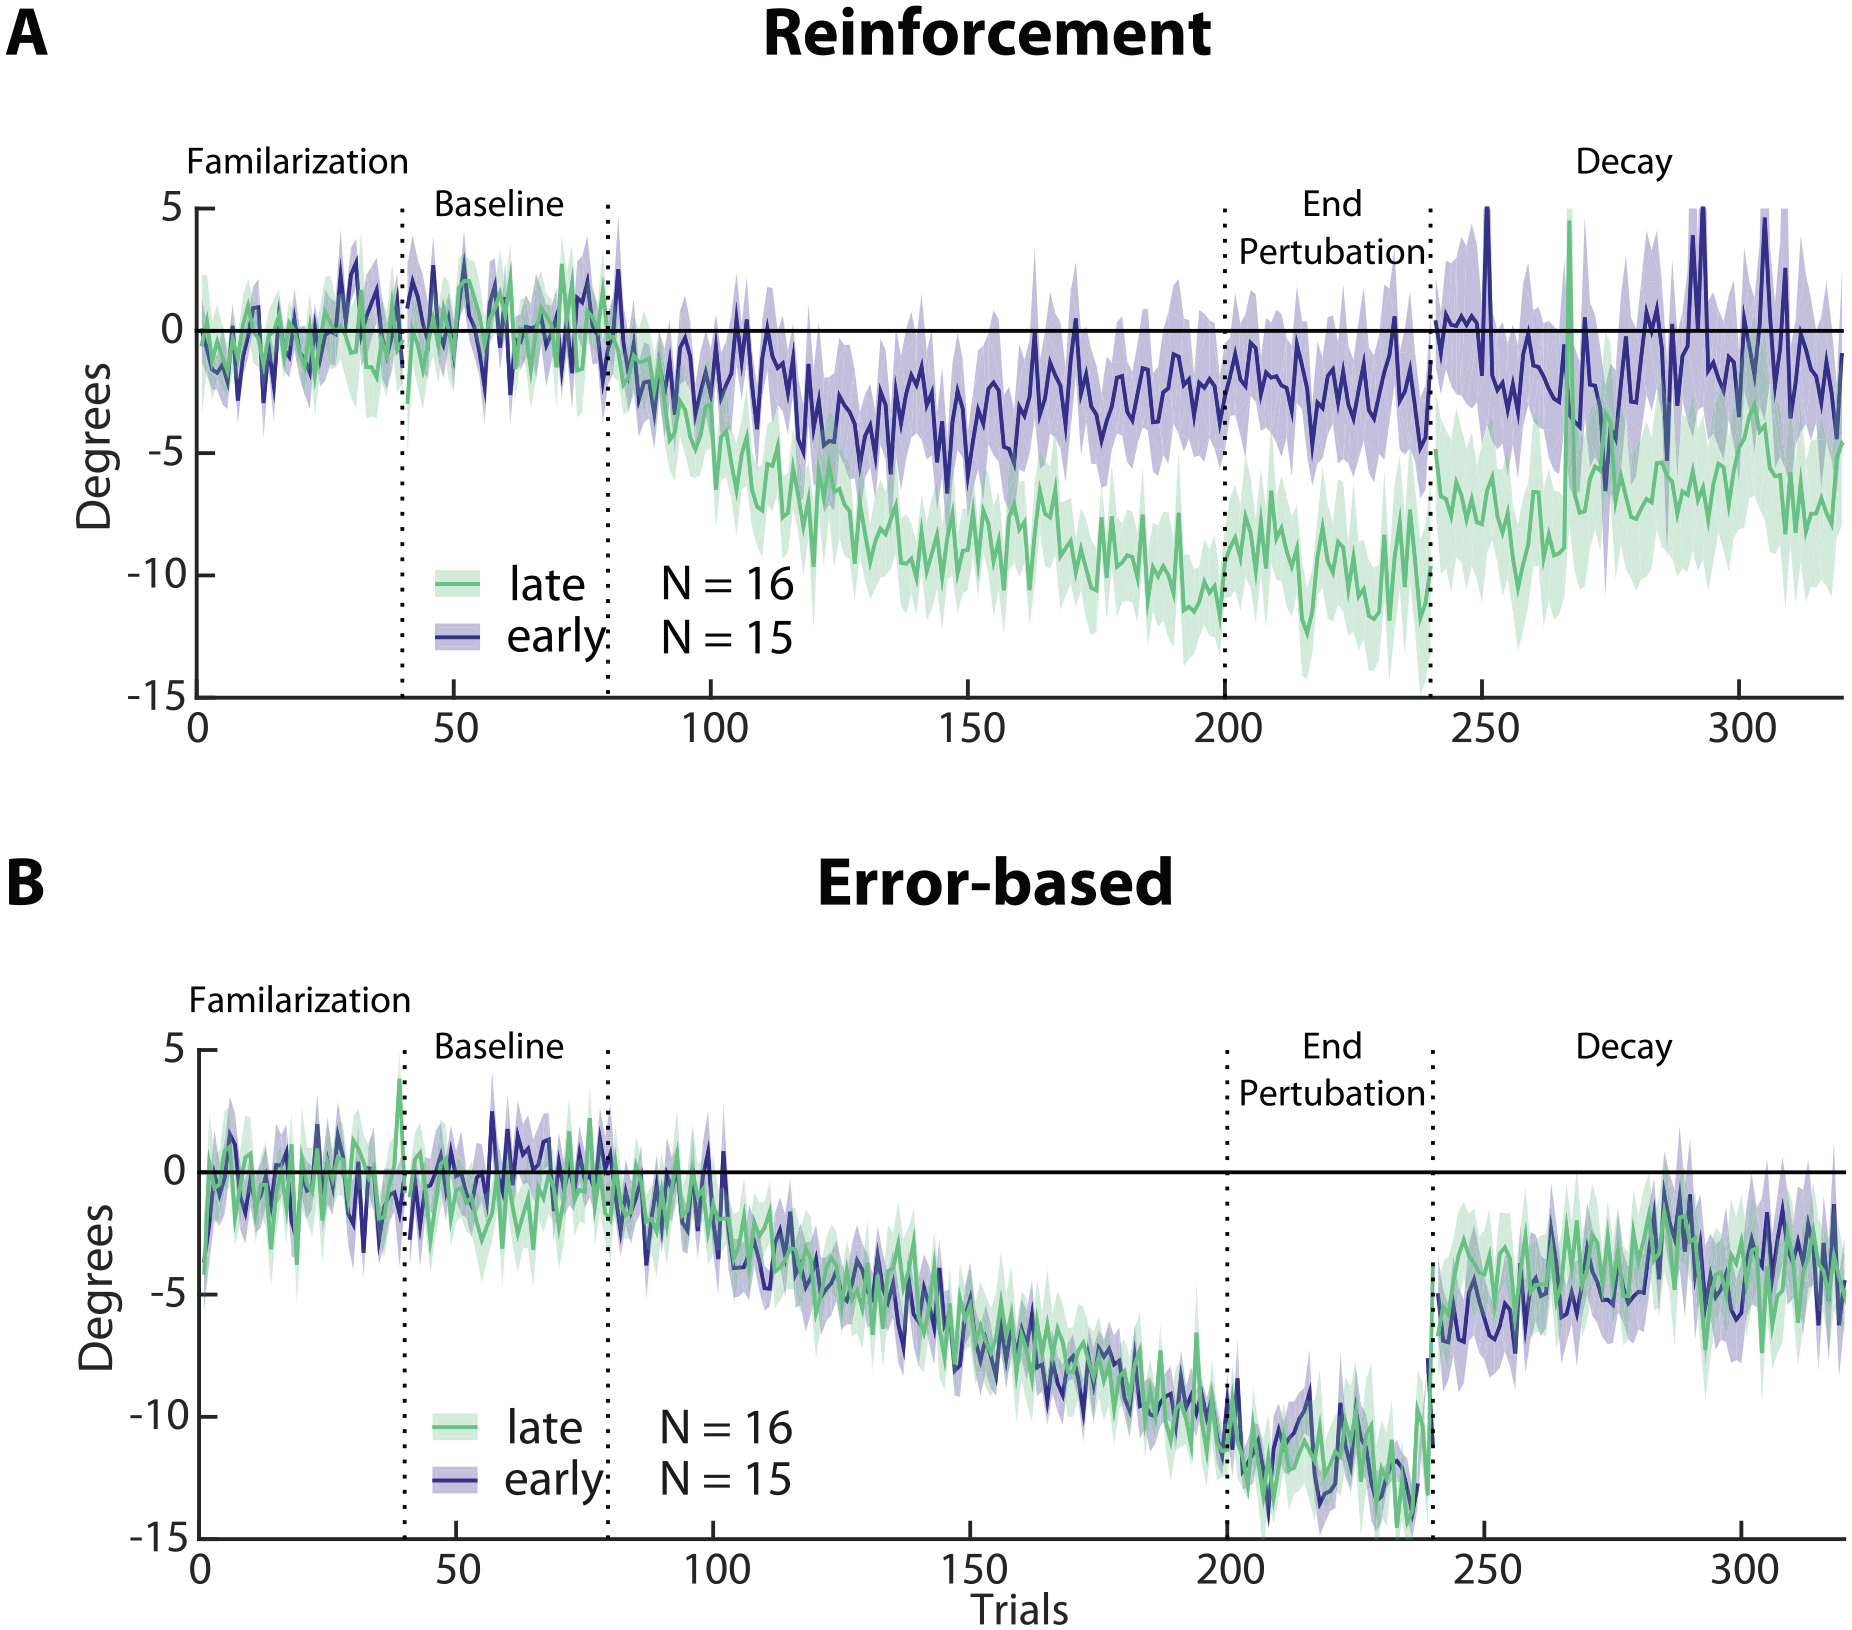
Subgroup analysis of reinforcement versus error-based learning in the early (blue, N = 15) and late (green, N = 16) groups. (A and B) Changes in reaching angle over trials. (Familiarization = 40 trials, Baseline = 40 trials before introducing rotation, End perturbation = last 40 trials of rotation, Decay = 100 trials without any feedback). Please note the reduced learning in the early versus late group in the reinforcement task only. Shading indicates SEM.
Of note, the percentage of trials that were repeated because of timing issues was under 10% and did not differ between groups (early: 7%, late 5%, t (50) = 1.21, P = .23).
Learning Via Reinforcement Was Impaired Early After Stroke
There was significantly less learning in the reinforcement task at the End perturbation in the early versus the late group and healthy controls (early: −5.7° ± 11.1 vs late: −9.3° ± 10.3, P = .035; early vs controls −13.1° ± 9.3, P = .049). In addition, Total Learning was lower in the early versus the late group and controls (early: −4.9° ± 9.4 vs late −7.5° ± 9.1, P = .033; early vs controls −11.1° ± 8.3, P = .048).
Despite patients being matched for motor performance at baseline (see Methods Section) and displaying no difference in other factors that could possibly affect task execution (see under Clinical and Kinematic variables cannot explain learning differences), the 2 patient groups differed significantly in their average reaching angles at Baseline (early: −0.78° ± 9.1, late: −1.81° ± 7.0, P = .003). This means that the Total Learning difference across groups could have been driven by this difference at baseline. Thus, to account for reaching angle execution at baseline, we conducted a subgroup analysis that included participants from both groups with matched Baseline execution (average reaching angle ±5°, resulting in N = 16 in the early group and N = 15 in late group). This subgroup analysis confirmed that the early group had markedly less Total Learning compared to the late group (see Figure 3A; early: −2.7° ± 9.4 vs late: −9.6° ± 7.0, P = .03). Indeed, matching baseline execution also highlighted the difference in End perturbation angles between groups (early: −2.4° ± 9.2 vs late: −9.9° ±8, P = .025).
For the reinforcement task, we found no significant difference in D across groups (D = differences in average reaching angle End perturbation—Decay; early: 1.1° ± 5.5 vs late: 1.9° ± 7.0, P = .43), even when matched for baseline reaching angle deviation (early: 0.8° ± 4.3 vs late: 1.9° ± 5.5, P = .49). Compared to healthy controls, the Early group had a significantly smaller D (control: 3.4° ± 7.8, P = .041). However, this effect could be attributed to the smaller deviation in End perturbation for the Early group in the first place. The Late group was not significantly different from healthy controls (control vs late: P = .29). Overall, decay characteristics for the patients were similar: neither the Early nor the Late groups showed evidence of (further) decay as the Decay block progressed. This pattern is characteristic of reinforcement learning and therefore provides corroboration that both stroke groups learned via the same learning mechanism but to different degrees.22,45
Error-based Motor Learning Was Not Affected at Any Time After Stroke
There was a comparable average shift in reach angles at End perturbation between groups in the error-based task (early: −12.54° ± 2.1 vs late: −13.44° ± 3.9, P = .18; early vs controls −13.1° ± 3.5, P = .56). Total Learning in this task was similar between the early, the late and the control groups (early: −10.82° ± 4.9 vs late: −12.1° ± 7.2, P = .18; early vs control: −13° ± 1.9, P = .21). Importantly, the subgroup analysis in the matched-baseline group also did not show statistical difference (early: −12.11° ± 3.6 vs late: −12.87° ± 4.8, P = .191; Figure 3B).
In the error-based learning task all groups showed a similar decay (D; early: 4.5° ± 8.8 vs late: 6.1° ± 8.6, P = 0.23, control: 7.2° ± 6.4 vs early, P = .83, control vs late: P = .86).
It should be noted that all groups demonstrated a movement direction bias toward the learned adaptation direction during the Decay block. This could be considered a form of use-dependent learning that induces directional biases toward the repeated movement.32,46 This mechanism can be disambiguated from error-based learning by examining biases on neighboring target directions. However, due to our task being limited to reaching only 1 target, it remains unclear whether the residual directional biases during Decay signify a decay-resistant component of the error-based learning process or a use-dependent bias due to the repetition of the learned movement direction. We do note, however, that, because the visuomotor rotation was gradually introduced, the repetition of 1 specific movement direction was limited, suggesting that, in this case, the residual biases we observe may indeed be due to a decay-resistant component of the error-based learning process, rather than due to use-dependent learning whereby directional biases arise because of the repetition of movement along 1 specific direction.
Group Differences in Clinical and Kinematic Variables Could Not Explain the Differential Effect of Stroke on Reinforcement and Error-based Learning
To determine whether differences in learning capacity at the early versus late stage after stroke were due to other variables beyond learning capacity, we assessed factors that could possibly affect task execution. Despite all participants having similar abilities in executing the reaching tasks (AMD 2 , baseline variability, and reaching execution parameters, see Methods Section), the early group had less overall motor impairment (measured by the FMS scores) and lower functional deficits (measured by the ARAT) than those in the late group. Importantly, neither FMS (R = .09, P = .09) nor ARAT (R = −.02, P = .41) correlated with Total Learning.
Finally, cognitive function and mood disturbances were similar across both groups (Table 1).
Motor Recovery Followed the Expected Longitudinal Time-course
To ensure our participants followed the expected normal recovery pattern of rapid motor impairment changes early but not late (>6 months) after stroke we compared FMS scores at the time of the motor learning testing (T1) and a second time point 1 month later (T2). As expected, the early group showed a significant increase in FMS scores over time, while the late group remained stable (see Figure 4, please note that only patients with both time point measures were included; early N= 23, late N = 28; FMS, median plus standard deviation, early T1: 56 ± 14.9, T2: 62.3 ± 14.4, t = −5.324, P < .001; late T1: 31.2 ± 20.6, T2: 34.8 ± 20.7, t = −0.51, P = .614).
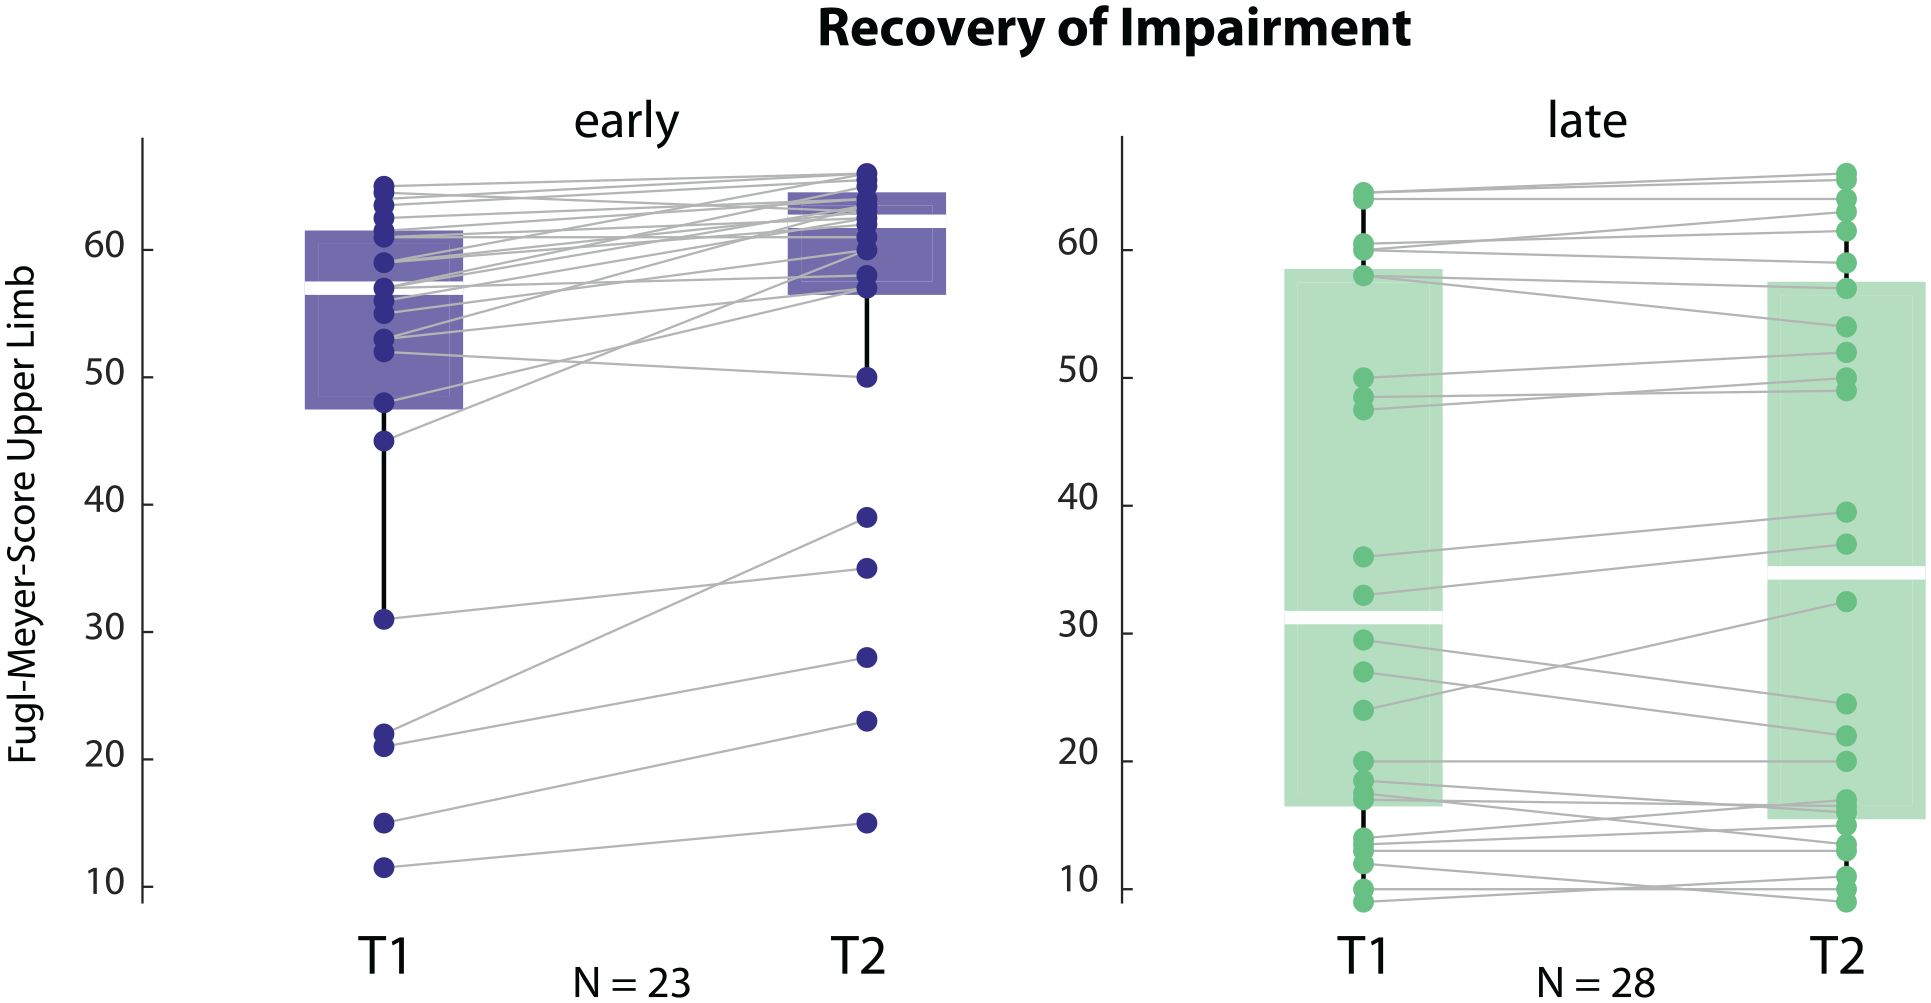
Recovery trajectory for impairment, measured by Fugl-Meyer Score for the upper limb at T1 and T2, in the early and the late groups. The early group improved over time and had overall lower impairment. Please note that only patients with both time points were included.
The Reinforcement Learning Deficit Improved Over Time
We also assessed learning in the reinforcement task in both groups at T2. Total Learning and End perturbation 1 month later were still on average lower in the early compared to the late group, though these changes were not statistically significant anymore (Total Learning: early −6.2° ± 7.6 vs late −10.2° ± 7.8, P = .285; End perturbation: early −7.7° ± 10.8 vs late −8.5° ± 9.0, P = .257; T1 vs T2 Total Learning: early P = .489, late P = .971, control P = .578). Importantly, since one-third of the participants were lost to follow-up, this comparison across the whole group needs to be taken with caution.
Imaging Analysis
To test whether lesion location could explain the abnormal performances in the reinforcement task, we performed a post-hoc analysis on total lesion volume and lesion volume of regions of interest (ROI) known to be involved in reinforcement processing between the 2 groups. As this imaging analysis was not part of the original study protocol, MRI data was only available for a subset of participants; 20 participants in the early and 15 participants in the late group. Overall lesion volume was statistically larger in the late group compared to the early group (P = .018, Figure 5), a finding consistent with the higher motor impairment (worse FM scores) in the late group.
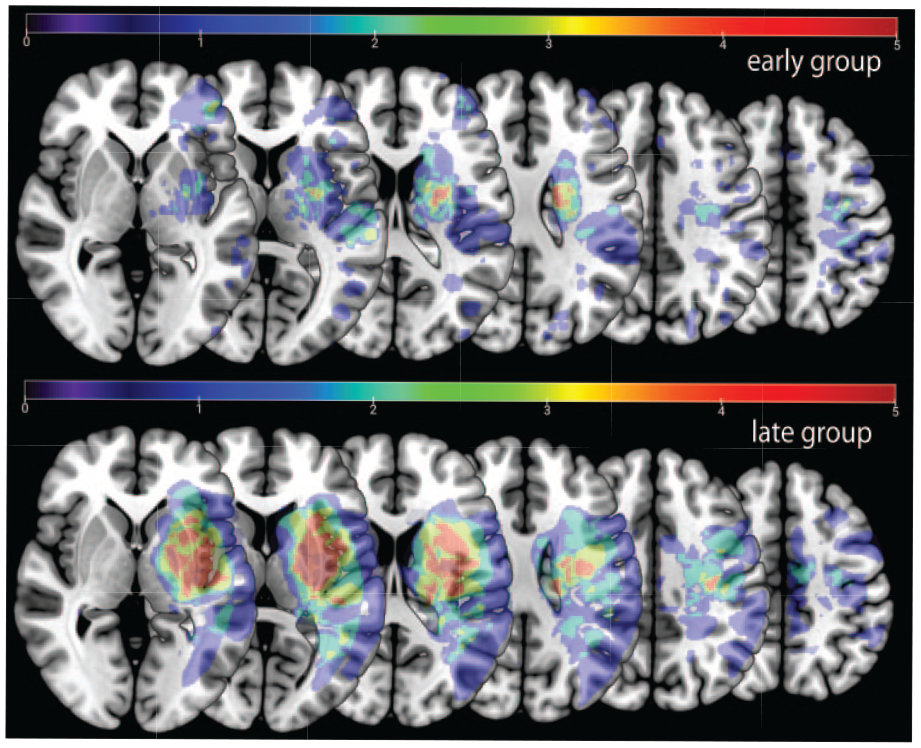
Stroke lesion overlay. Upper row lesion location for the early group. Lower row lesion location for the late group. Note that the late group had an overall larger lesion volume than the early group.
To determine the potential impact of damage in the regions of interest implicated in the neural circuitry underlying reinforcement learning, we assessed the percentage lesion load in 6 ROIs: orbitofrontal cortex, amygdala, caudate nucleus, putamen, nucleus accumbens, and substantia nigra. In each of these brain regions percentage lesion load was higher in the late compared to the early group because of matching performance at baseline (same unrecovered performance deficit = higher lesion load), making it very unlikely that unbalanced lesion distribution could account for the differences in reinforcement learning (early vs late group, orbitofrontal: N = 3 vs 3, amygdala: N = 1 vs 4, caudate nucleus N = 6 vs 8, putamen N = 10 vs 7, nucleus accumbens N = 0 vs 2, and substantia nigra N = 1 vs 2).
Discussion
Spontaneous recovery of the upper extremity mostly occurs in the first 3 months after stroke, which suggests a time-limited period of enhanced plasticity. Here, we asked whether the capacity for motor learning is also increased during this early period. Specifically, we evaluated the sensitivity of trial-by-trial motor learning through 2 types of feedback—reinforcement learning and error-based learning—both of which are key components commonly used in rehabilitation training.
We found that in the sub-acute post-stroke period, reinforcement learning capacity was impaired, but then normalized in the chronic period, that is, the late group performed more like the healthy age-matched group. Error-based learning in contrast was comparable at both time points, indicating that the observed deficit in reinforcement learning could not be attributed to a more generalized learning impairment. Importantly, the motor learning findings could not be explained by differences in baseline ability to execute the 2 tasks, as patients in the 2 groups were carefully matched and able to execute the tasks. Reinforcement, unlike error-based learning, exhibited a time-dependent change (between T1 and T2) during post-stroke recovery. This pattern was opposite to the typical earlier-better-than-later characteristic of both spontaneous biological recovery and response to rehabilitative training documented in both animal models and recent human studies.2,47-49
A particular consideration in our study design was to avoid the performance confound, whereby learning performance may appear impaired due to differences in motor execution, rather than impairment in the underlying learning mechanism. 21 For example, increased motor noise has been shown to affect the speed and amount of learning even for healthy individuals and (partly) explains apparent learning impairments in patient populations. 22 Moreover, if baseline performance is biased toward or away from the learned task, this could lead to apparently faster or slower acquisition, correspondingly, even if the learning parameters themselves are the same. We want to stress, however, this is not to dismiss work that does not take performance confounds into account, if those studies focus on general impairment of task execution rather than trying to isolate impairment in specific learning mechanisms. It should be also noted that we tested acquisition and decay processes, yet there are other phenomena that are associated with motor learning, such as consolidation and savings, that were not explored here.
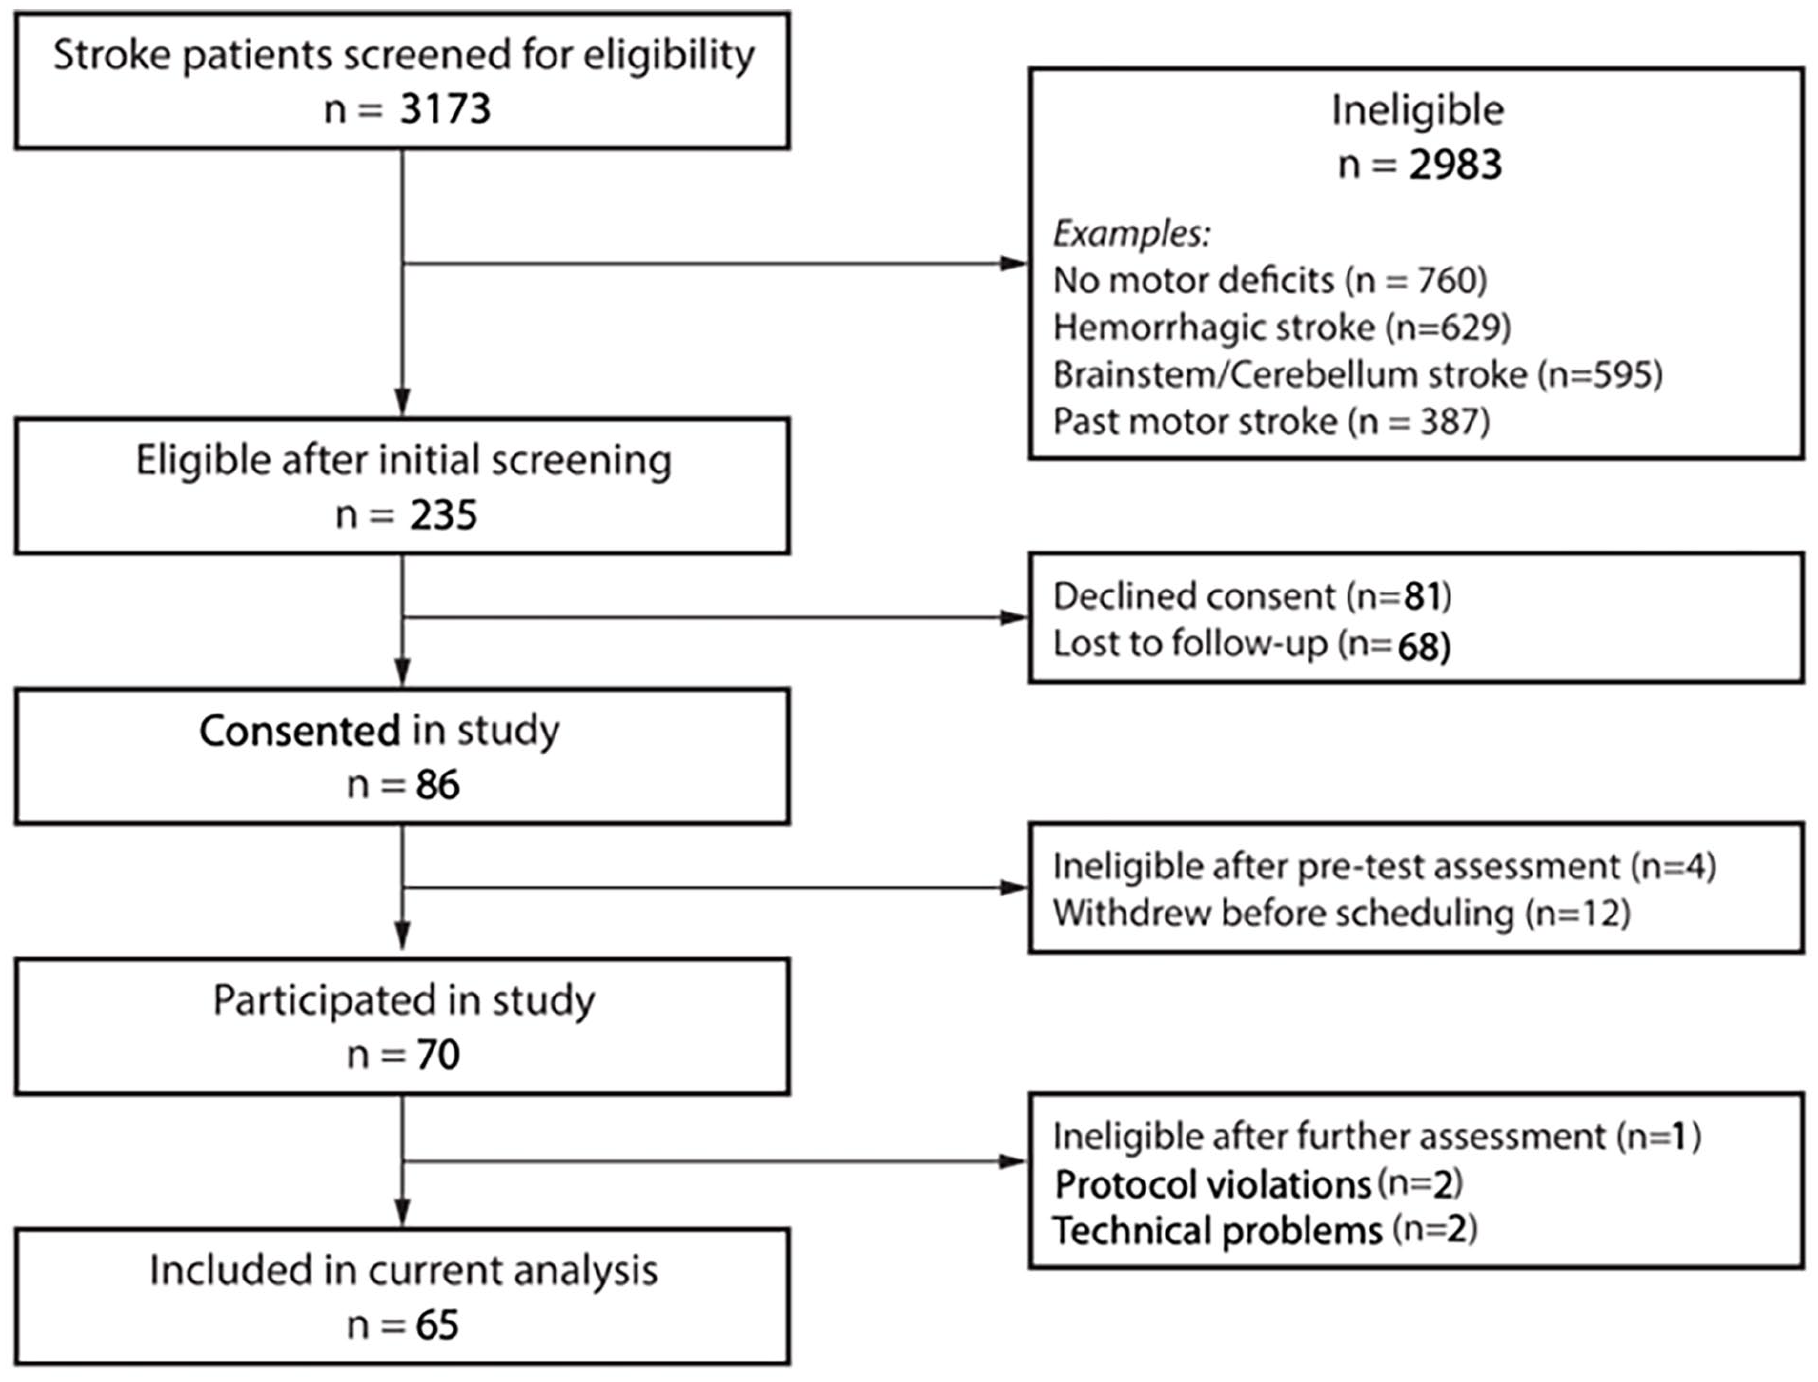
CONSORT flowchart.
Potential Underlying Mechanisms
It can only be speculated as to why reinforcement learning is impaired early after stroke. As we have seen, this could not be attributed to either lesion location or to the baseline motor execution deficit. Approximately one-third of stroke survivors experience symptoms of apathy or anhedonia, leading to diminished motivation and a notable decrease in goal-directed behaviors.50-52 These symptoms, reflecting potential disruptions in the reward system post-stroke, can adversely impact rehabilitation outcomes.52-54 Intriguingly, recent studies, such as by Wagner et al, 55 have identified reward network dysfunction in acute stroke, independent of lesion localization. This disruption in frontal networks might be linked to the diminished capacity for reinforcement learning, as opposed to error-based learning, observed in our study. Additionally, recent data suggest that some patients have unexpected cognitive deficits even after small subcortical strokes, 56 and these could also play a role here. We did not perform formal neuropsychological testing of sufficient granularity to investigate this possibility.
Although patients post-stroke typically demonstrate the most significant recovery gains during the early to subacute recovery phase, 57 it is this same timeframe in which they demonstrate pronounced reinforcement learning deficits. This apparent contradiction suggests that there is an important distinction to be made between motor learning and motor training. Adaptation and reinforcement learning tasks stress movement selection: subjects must converge on the right action but execution of that action is already over-learned. 58 In contrast, reduction in impairment after stroke requires improvement in the quality of execution of any selected action. The sites of plasticity, and attendant mechanisms, for movement selection and execution can uncouple. 20 Our results would suggest that the mechanisms that lead to enhanced plasticity and responsivity to training in the sub-acute stroke period may be circumscribed to those areas or processes responsible for motor control and strength, namely areas contributing to descending pathways to the spinal cord. 59 Higher order motor learning circuits do not seem to be getting similar enhancement.
Error-based Learning Performance and Time After Stroke
Here, we found no apparent difference between early and late groups regarding the error-based, visuomotor rotation learning task. A recent study of visuomotor rotation adaptation by Moore et al 15 in stroke patients found that time since stroke correlated (weakly) with the first few trials of learning, though not with steady-state adaptation. This study used an abruptly introduced rotation paradigm, which favors explicit strategies that peak during the first trials of learning.60,61 In contrast, gradual adaptation paradigms like ours tend to limit awareness of the rotation, effectively isolating implicit adaptation.62-65 Comparing the Moore et al 15 findings with ours thus suggests that explicit learning might be more strongly impaired early compared to late after stroke, whereas implicit learning might be relatively unimpaired both early and late after stroke.
Our tasks were designed to study reinforcement and error-based learning mechanisms in isolation following stroke, contrasting with other research that explored their combination: Previous work found that both reward and punishment can enhance error-based motor adaptation in chronic stroke patients, whereas reward, but not punishment, increased retention 33 ; mirroring similar findings in healthy individuals.45,66 Moreover, Widmer et al 67 found that reward can enhance the performance of subacute stroke patients in a motor skill learning task. Our study isolated these 2 learning types, finding that reinforcement learning’s effectiveness returns to normal with time post-stroke. Additionally, while lesion side was evenly distributed across groups, the impact of lesion location, particularly given its potential effects on visuomotor adaptation, warrants further investigation in future research.
Implications for Rehabilitation
All motor learning and motor training must follow some kind of performance gradient. The errors can be explicit or implicit, 61 and rewards can be endogenous or exogenous.66,68 Reward is a central component of any physical therapy session—either to encourage particular movements (selection) or to spend more time on task training a particular movement once it is selected (execution quality). Thus, given the blunted reinforcement learning found in this study it would be critical to either increase the saliency of rewards, for instance as done in gaming rehabilitation, 69 or to increase the dose and intensity of therapy so that patients eventually converge on the action required.
The results of the EXPLICIT and EXCITE trials, which investigated the effects of Constrained-induced movement therapy on upper limb recovery after stroke, may appear to contradict our current findings of reduced reinforcement learning in the sub-acute stroke period. However, the reported positive effects of early constraint-induced movement therapy (CIMT) training after stroke in these trials are likely explained by the higher rehabilitation training dose given compared to usual care rather than the operant component of CIMT per se. 27 In EXCITE, patients fell into a period (3 to 9 months post-stroke) that combines the early and late group time points tested in our study, which might have diluted out any differences at the 2 time points. Again, as in EXPLICIT, the considerably higher dose of therapy could have offset the reduced sensitivity to reward. In general, rehabilitation training extends for periods much longer than the short time it takes to assay a specific learning mechanism, as was done in this study.
Conclusion
Impaired reinforcement learning in the sub-acute stroke period is a novel finding. Our findings have both scientific and clinical implications. From a scientific standpoint, the lack of any enhancement of either of the 2 learning mechanisms assayed suggests that the post-stroke critical period seems quite focal in its plasticity effects (eg, affects training but not learning). The reduction in reinforcement learning ability is puzzling given that hemiparesis is predominantly due to lesions in motor regions and in descending pathways. It parallels recent findings of more general cognitive problems in some stroke patients despite no obvious involvement of the requisite cognitive cortical areas. 56 Clinically, the result reported here might suggest that rehabilitation approaches explicitly based on reinforcement will need to either increase reward saliency and/or training dose, or be delayed until after the sub-acute period.
Supplemental Material
sj-docx-1-nnr-10.1177_15459683241304352 – Supplemental material for Reinforcement Learning is Impaired in the Sub-acute Post-stroke Period
Supplemental material, sj-docx-1-nnr-10.1177_15459683241304352 for Reinforcement Learning is Impaired in the Sub-acute Post-stroke Period by Meret Branscheidt, Alkis M. Hadjiosif, Manuel A. Anaya, Jennifer Keller, Mario Widmer, Keith D. Runnalls, Andreas R. Luft, Amy J. Bastian, John W. Krakauer and Pablo A. Celnik in Neurorehabilitation and Neural Repair
Footnotes
Acknowledgements
We would like to thank our patients willing to participate in this research.
Author Contributions
Meret Branscheidt: Conceptualization; Data curation; Formal analysis; Investigation; Methodology; Visualization; Writing—original draft. Alkis Hadjiosif: Conceptualization; Data curation; Formal analysis; Investigation; Methodology; Visualization; Writing—original draft. Manuel A. Anaya: Data curation; Visualization; Writing—original draft. Jennifer Keller: Data curation. Mario Widmer: Investigation. Keith Runnalls: Investigation. Andreas R Luft: Supervision; Writing—review & editing. Amy J. Bastian: Supervision; Writing—review & editing. John W. Krakauer: Conceptualization; Funding acquisition; Writing—review & editing. Pablo Celnik: Conceptualization; Funding acquisition; Writing—review & editing.
Declaration of Conflicting Interests
The author(s) declared no potential conflicts of interest with respect to the research, authorship, and/or publication of this article.
Funding
The author(s) disclosed receipt of the following financial support for the research, authorship, and/or publication of this article: This work was supported by NIH grant 5R01HD053793.
Supplementary material for this article is available on the Neurorehabilitation & Neural Repair website along with the online version of this article.
References
Supplementary Material
Please find the following supplemental material available below.
For Open Access articles published under a Creative Commons License, all supplemental material carries the same license as the article it is associated with.
For non-Open Access articles published, all supplemental material carries a non-exclusive license, and permission requests for re-use of supplemental material or any part of supplemental material shall be sent directly to the copyright owner as specified in the copyright notice associated with the article.