
Abstract
Background
Previous studies have established that increased Sample Entropy (SampEn) of cadence, a measure of non-linear variability, during dynamic cycling leads to greater improvements in motor function for individuals with Parkinson’s disease (PD). However, there is significant variability in responses among individuals with PD due to symptoms and disease progression.
Objectives
The aim of this study was to develop and test a paradigm for adapting a cycling exercise intervention using SampEn of cadence and rider effort to improve motor function.
Methods
Twenty-two participants were randomized into either patient-specific adaptive dynamic cycling (PSADC) or non-adaptive (NA) group. SampEn of cadence was calculated after each of the 12 sessions, and motor function was evaluated using the Kinesia test. Pearson’s correlation coefficient was used to analyze the relationship between SampEn of cadence and motor function improvement. Multiple linear regression (MLR) was used to identify the strongest predictors of motor function improvement.
Results
Pearson’s correlation coefficient revealed a significant correlation between SampEn of cadence and motor function improvements (R2 = −.545, P = .009), suggesting that higher SampEn of cadence led to greater motor function improvement. MLR demonstrated that SampEn of cadence was the strongest predictor of motor function improvement (β = −8.923, t = −2.632, P = .018) over the BMI, Levodopa equivalent daily dose, and effort.
Conclusions
The findings show that PSADC paradigm promoted a greater improvement in motor function than NA dynamic cycling. These data will be used to develop a predictive model to optimize motor function improvement after cycling in individuals with PD.
Introduction
Parkinson’s disease (PD) is a progressive neurological disorder characterized by the loss of dopaminergic neurons in the basal ganglia, 1 and is the second most common neurological disorder after Alzheimer’s disease. 2 In the United States, roughly 930 000 individuals or 1% of the population over the age of 60, have PD. By 2030, the number of Americans predicted to have PD is 1.3 million. 3 The cardinal symptoms of PD are bradykinesia, resting tremor, rigidity, and postural instability. 4 Each one can negatively affect activities of daily living, but in combination, these symptoms increase fall risk and significantly decrease overall quality of life. 5
Growing evidence shows that exercise improves PD-related motor and non-motor symptoms and can potentially slow the progression of PD.6-8 Several different modes of exercise can improve PD motor symptoms, as measured by the unified Parkinson’s disease rating scale (UPDRS) Motor III score, functional performance, walking speed, balance, and quality of life.9-13 Over the past several years our lab has focused on the benefits of high-cadence dynamic cycling.14-16 The dynamic cycle, which was built to mimic forced cycling on a tandem bike, 17 is a stationary motorized bike where motor speed (cadence) can be set at up to 90 revolutions/minute. The internal motor adjusts to changes in pedaling force and cadence, and is controlled to simulate the dynamic interaction between 2 riders on a tandem bike. 17 Three sessions of dynamic cycling in 1 week led to a 13.9% improvement in UPDRS Motor III scores and a 16.5% improvement in the Timed Up and Go (TUG) test. 17 Moreover, 6 bouts of dynamic cycling over 2 weeks increased UPDRS Motor III scores by 17%, rapid alternating movement speed by 23%, hand-movement amplitude by 36%, and TUG test scores by 13%. 18 Specifically, UPDRS Motor III score improvements after 3 sessions and 6 sessions of dynamic cycling were 4.0 points and 2.5 points, respectively, which meets the minimum clinically important difference of UPDRS Motor III score ranges of 2.3 to 2.7 points. 19 One of the other benefits of dynamic cycling is that it is low to moderate intensity (heart rate [HR] ranging from 50% to 60% of the age-predicted maximum), due to the motor assist requiring less effort of the rider. This exercise modality is particularly beneficial for people with severe PD symptoms or those who are deconditioned, as they may not be able to safely begin high-intensity exercise and need time to condition. In addition, dynamic cycling incorporates velocity motor training components with an increased cadence, which are highly beneficial for populations with neurological conditions.18,20 Although the intensity is considered low to moderate, this exercise modality improves motor function without causing excessive cardiovascular or muscular stress. According to our previous research, 17 participants’ HR during high-cadence cycling averaged 91 beats/minute, and they exhibited improved UPDRS Motor III scores.
Although high-cadence dynamic cycling has significant benefits for individuals with PD, there are still several gaps in the literature. First, the exercise intervention period in these studies was relatively short (1 and 2 week respectively), and the long-term effects on PD motor symptoms remain unknown. 18 Second, the programming used to simulate tandem cycling on the dynamic cycle was initially uniform for all participants and not adjusted during or between intervention sessions. 15 This lack of individualized programming means that the resistance settings remained constant and were not tailored to the specific needs of individual participants. As a result, the interventions did not provide personalized exercise prescriptions that could be advanced or progressed over time based on each participant’s responses to exercise. Consequently, some individuals experienced greater benefits than others due to this standardized approach. 21
In order to maximize the treatment effects of dynamic cycling, and potentially other exercise modes in individuals with PD, exercise parameters should be customized to address the unique characteristics of each individual. Individuals with PD are known to have abnormal movement variability, 22 potentially having a negative impact on their motor function.21,22 To augment movement variability, exercise programs need to incorporate more complex and variable movements. 22 One promising approach is to use an entropy calculation to guide the progression of individualized exercise programs.15,20 Approximate and Sample Entropy (SampEn) are widely accepted methods for quantifying variability and predictability in physiological signals, making them valuable tool for evaluating movement and physiological variability in individuals with PD. 23 While SampEn analysis is a common approach in medical diagnostics,24,25 its potential benefits for exercise prescription have not been investigated.
Previous studies in our lab suggest that high values of Approximate/Sample Entropy of cadence are key indicators of improvement in PD motor function20,26,27 and that Approximate/Sample Entropy of cadence can predict motor function improvement during dynamic cycling.15,27 In the context of our study, higher entropy of cadence is considered beneficial as it reflects more complex and adaptive movement patterns. This increased variability of cadence can enhance physiological feedback and potentially maximize the therapeutic effects of high-cadence dynamic cycling for individuals with PD. For these reasons, manipulation of Approximate/Sample Entropy of cadence during high cadence dynamic cycling sessions could be useful in the development of individually tailored exercise prescriptions that promote continued treatment effects over time.20,26,27
The first aim of this study was to establish a patient-specific adaptive dynamic cycling (PSADC) protocol utilizing SampEn of cadence and effort variables. To achieve this goal, we examined the relationship between resistance settings, SampEn of cadence and effort during a single session of dynamic cycling in healthy, young adults. These results served as a template for determining the rules for adjustment of the resistance settings of the dynamic cycle. This information was utilized to create the adaptive paradigm applied to individuals with PD. The second aim was to evaluate how changes in SampEn of cadence and effort values during high cadence dynamic cycling predicted motor function changes in individuals with PD. We hypothesized that both an increase, within limits, in SampEn of cadence and effort would promote greater improvements in motor function in individuals with PD. These findings will then be used to develop an optimized model for the PSADC paradigm that will be tested in future studies.
Methods
Study Design and Ethics Approval
The first aim examined the correlation between resistance and SampEn entropy of cadence from a single session of dynamic cycling and the variables (resistance setting, SampEn entropy of cadence) collected during the cycling sessions were used for the analysis. Young healthy adults were recruited for this aim which was approved by the Institutional Review Board (IRB) at Kent State University (IRB #100).
The second aim was addressed using a single-blinded randomized controlled trial with two arms: (a) PSADC group and (b) NA dynamic cycling group. Individuals with PD were blinded to their assigned group. This study was registered with ClinicalTrials.gov (NCT05361200), was open between April 2022 and July 2023 and was approved by the IRB at Kent State University (IRB #87).
Participants
The first study recruited a sample of healthy, young adults (ages 20-32) who rode the dynamic cycle for 5 minutes at each of 6 different resistance settings (1-6). Inclusion criteria were (a) 18 to 39 years old, (b) no medical conditions such as cardiovascular disease or stroke, and (c) ability to follow simple instructions. Exclusion criteria included any history of neurological (stroke, multiple sclerosis), cardiovascular (recent heart surgery, pacemaker), or orthopedic condition (broken bone, bone fracture) that limits the ability to participant in exercise without physician approval.
The second study recruited individuals with PD. Inclusion criteria were: (a) diagnosed with idiopathic PD according to the UK Brain Bank Criteria, (b) 50 to 79 years old, (c) being on a stable regimen of antiparkinsonian medication for at least 6 months, and (d) able to give informed consent. Exclusion criteria included (a) any signs or symptoms of cardiovascular, metabolic, and/or renal disease without medical clearance from a physician, and (b) secondary neurological or orthopedic conditions that would interfere with their ability to ride a high cadence dynamic bicycle were excluded from the study.
Sample Size Calculation
To determine the appropriate sample size for this research, we performed an a priori power analysis using G*Power software (version 3.1). This analysis was based on a paired samples t-test for the difference between 2 dependent means. The means and standard deviations for the 2 groups were derived from previous research. 17 The alpha level was set at .05 and the power was set at 0.8. The required sample size was determined to be 20 participants. Thus, this study aimed to recruit at least 20 participants to ensure adequate statistical power to detect a significant difference between the 2 conditions.
Study Protocol
Participants were randomly assigned to either the PSADC or NA groups according to Hoehn & Yahr stage using the Research Electronic Data Capture randomization module. Figure 1 shows the group allocation process and protocol. Both the PSADC group and the NA group completed 12 dynamic cycling sessions (3× week) over 4 weeks. Each session consisted of a 5-minute warm-up at a cadence of 60 rpm, a 30-minute period of dynamic high cadence cycling at a cadence of 80 rpm, and a 5-minute cool-down at a cadence of 60 rpm. Participants rested at least 48 hours between each session. Individuals were blind to their assigned group, exercise sessions were scheduled at the same time, and the dosage and timing of PD medication was consistent throughout the intervention.
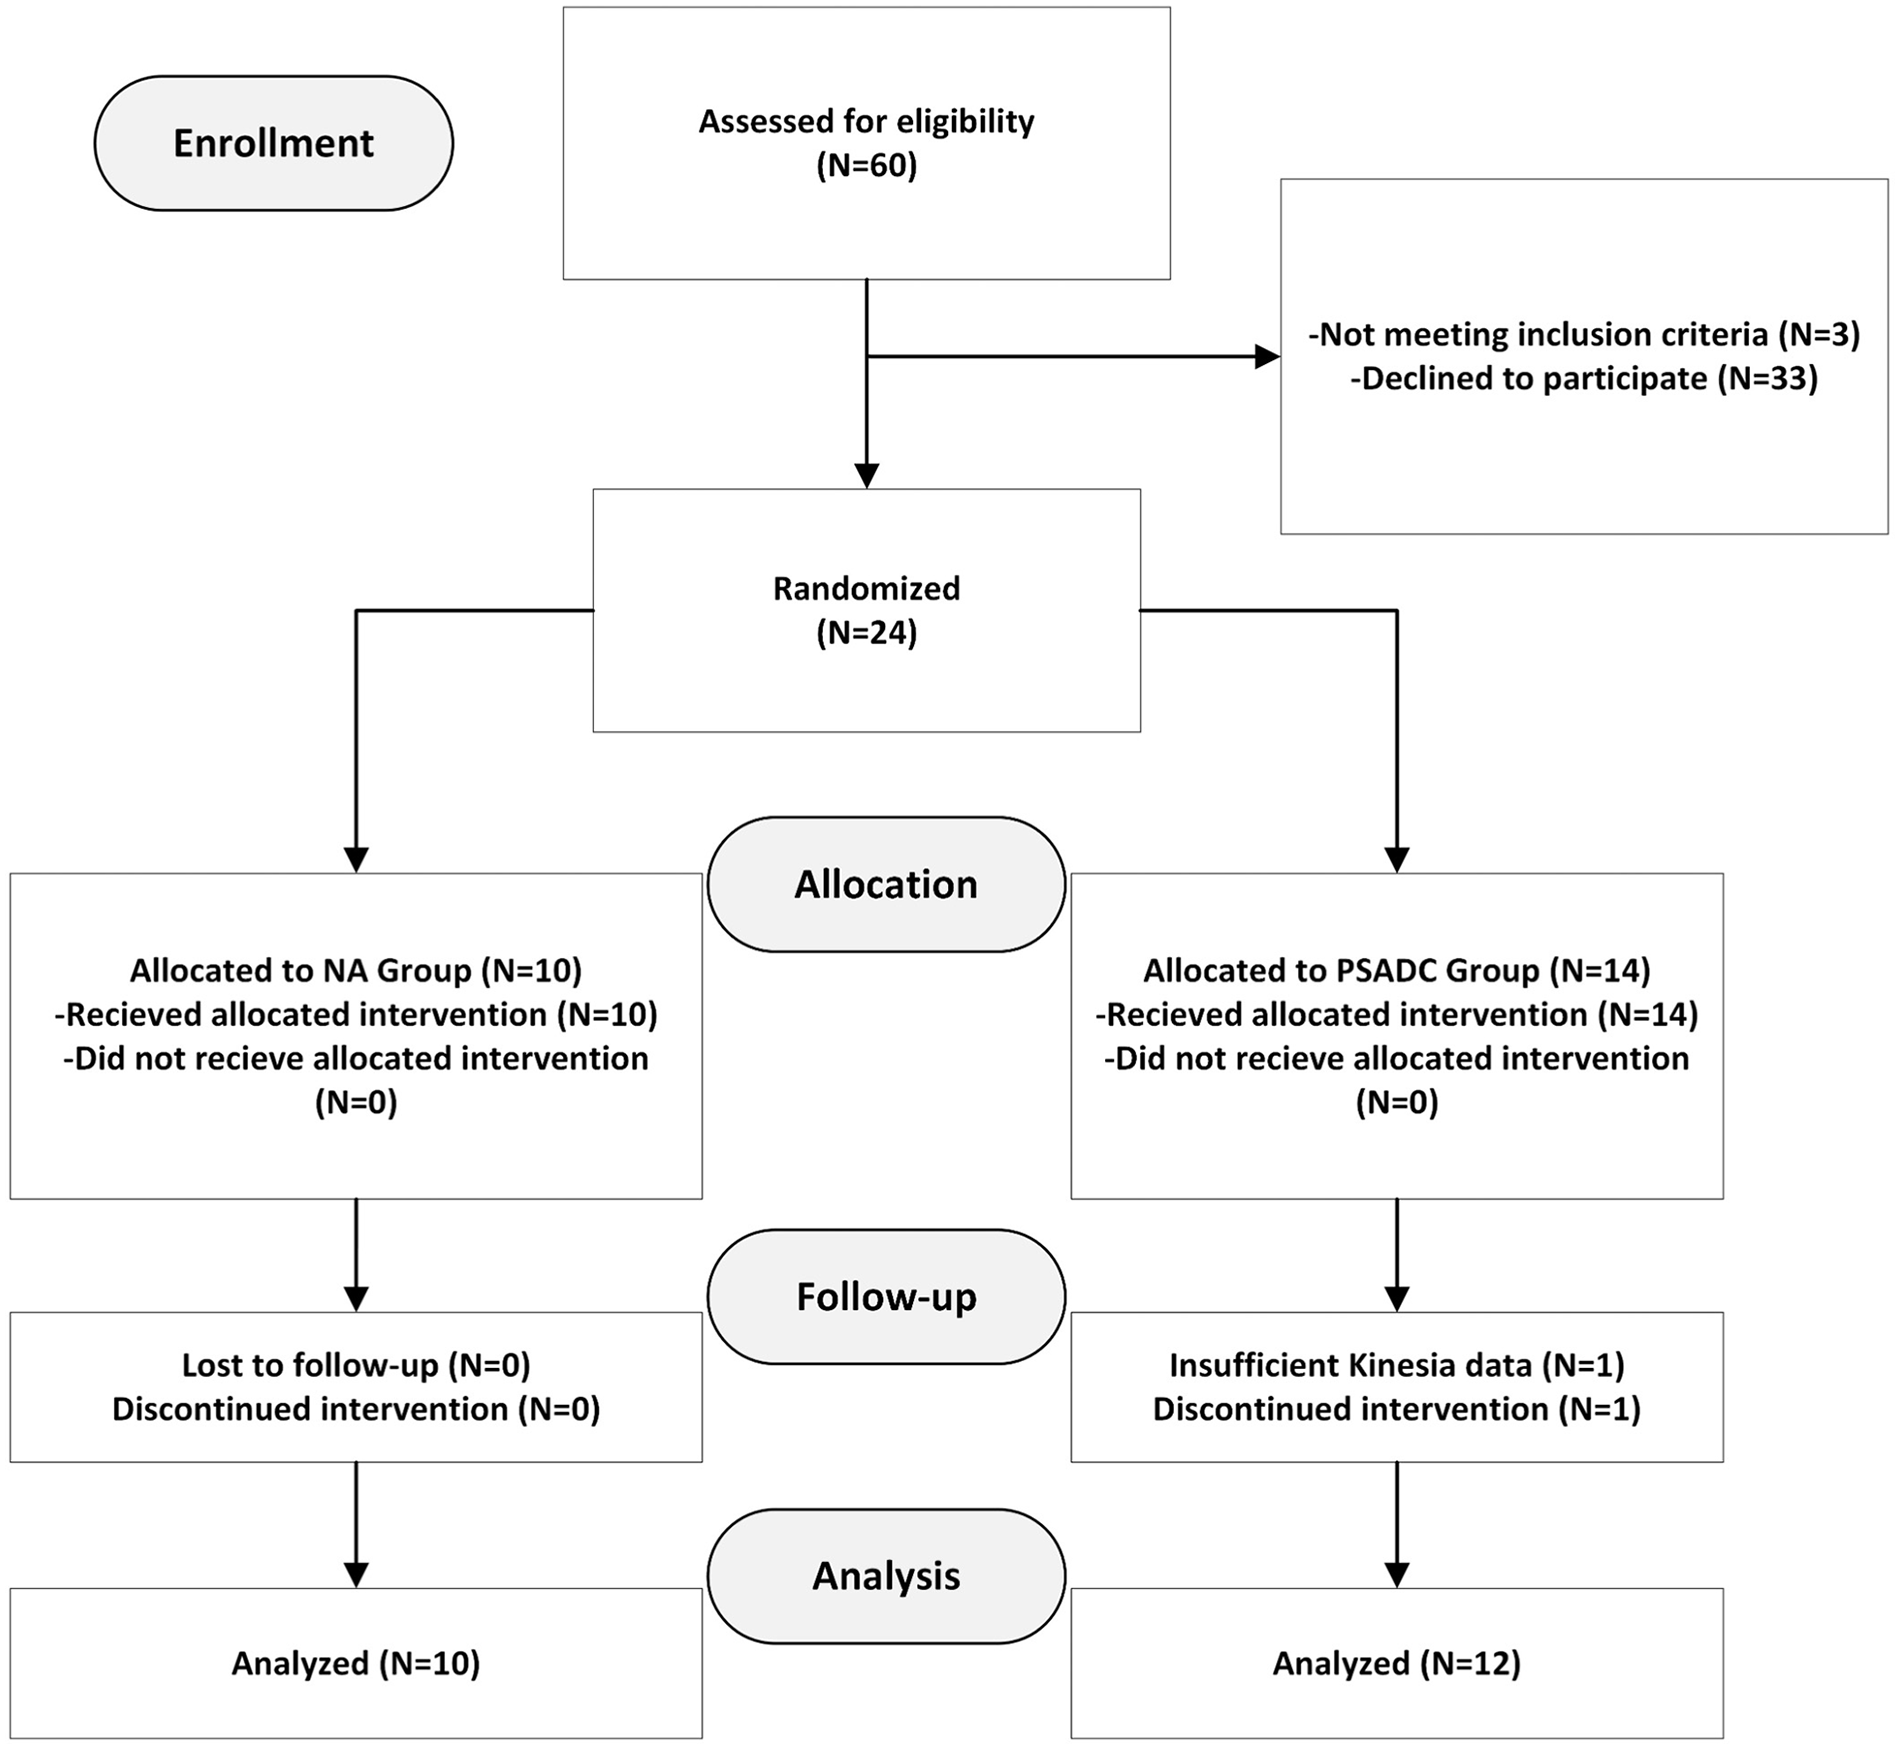
Consort diagram. Ten participants were randomized into NA dynamic cycling group, and 12 participants were randomized into the PSADC group.
For the PSADC condition, participants completed the first 3 sessions using the same settings of cadence and resistance. To determine the settings for each individual, SampEn entropy of cadence and effort variables were calculated for each session. 21 After 3 sessions, the resistance settings were adjusted following the PSADC algorithm (Figure 2A), prior to the next 3 sessions. This analysis was repeated after the third, sixth, and ninth sessions. The advantage of this algorithm is that it accounted for the patient’s individual performance during exercise. 21 Figure 2B illustrates the PSADC intervention procedure. For the NA dynamic cycling group, settings were pre-determined and constant throughout the intervention.
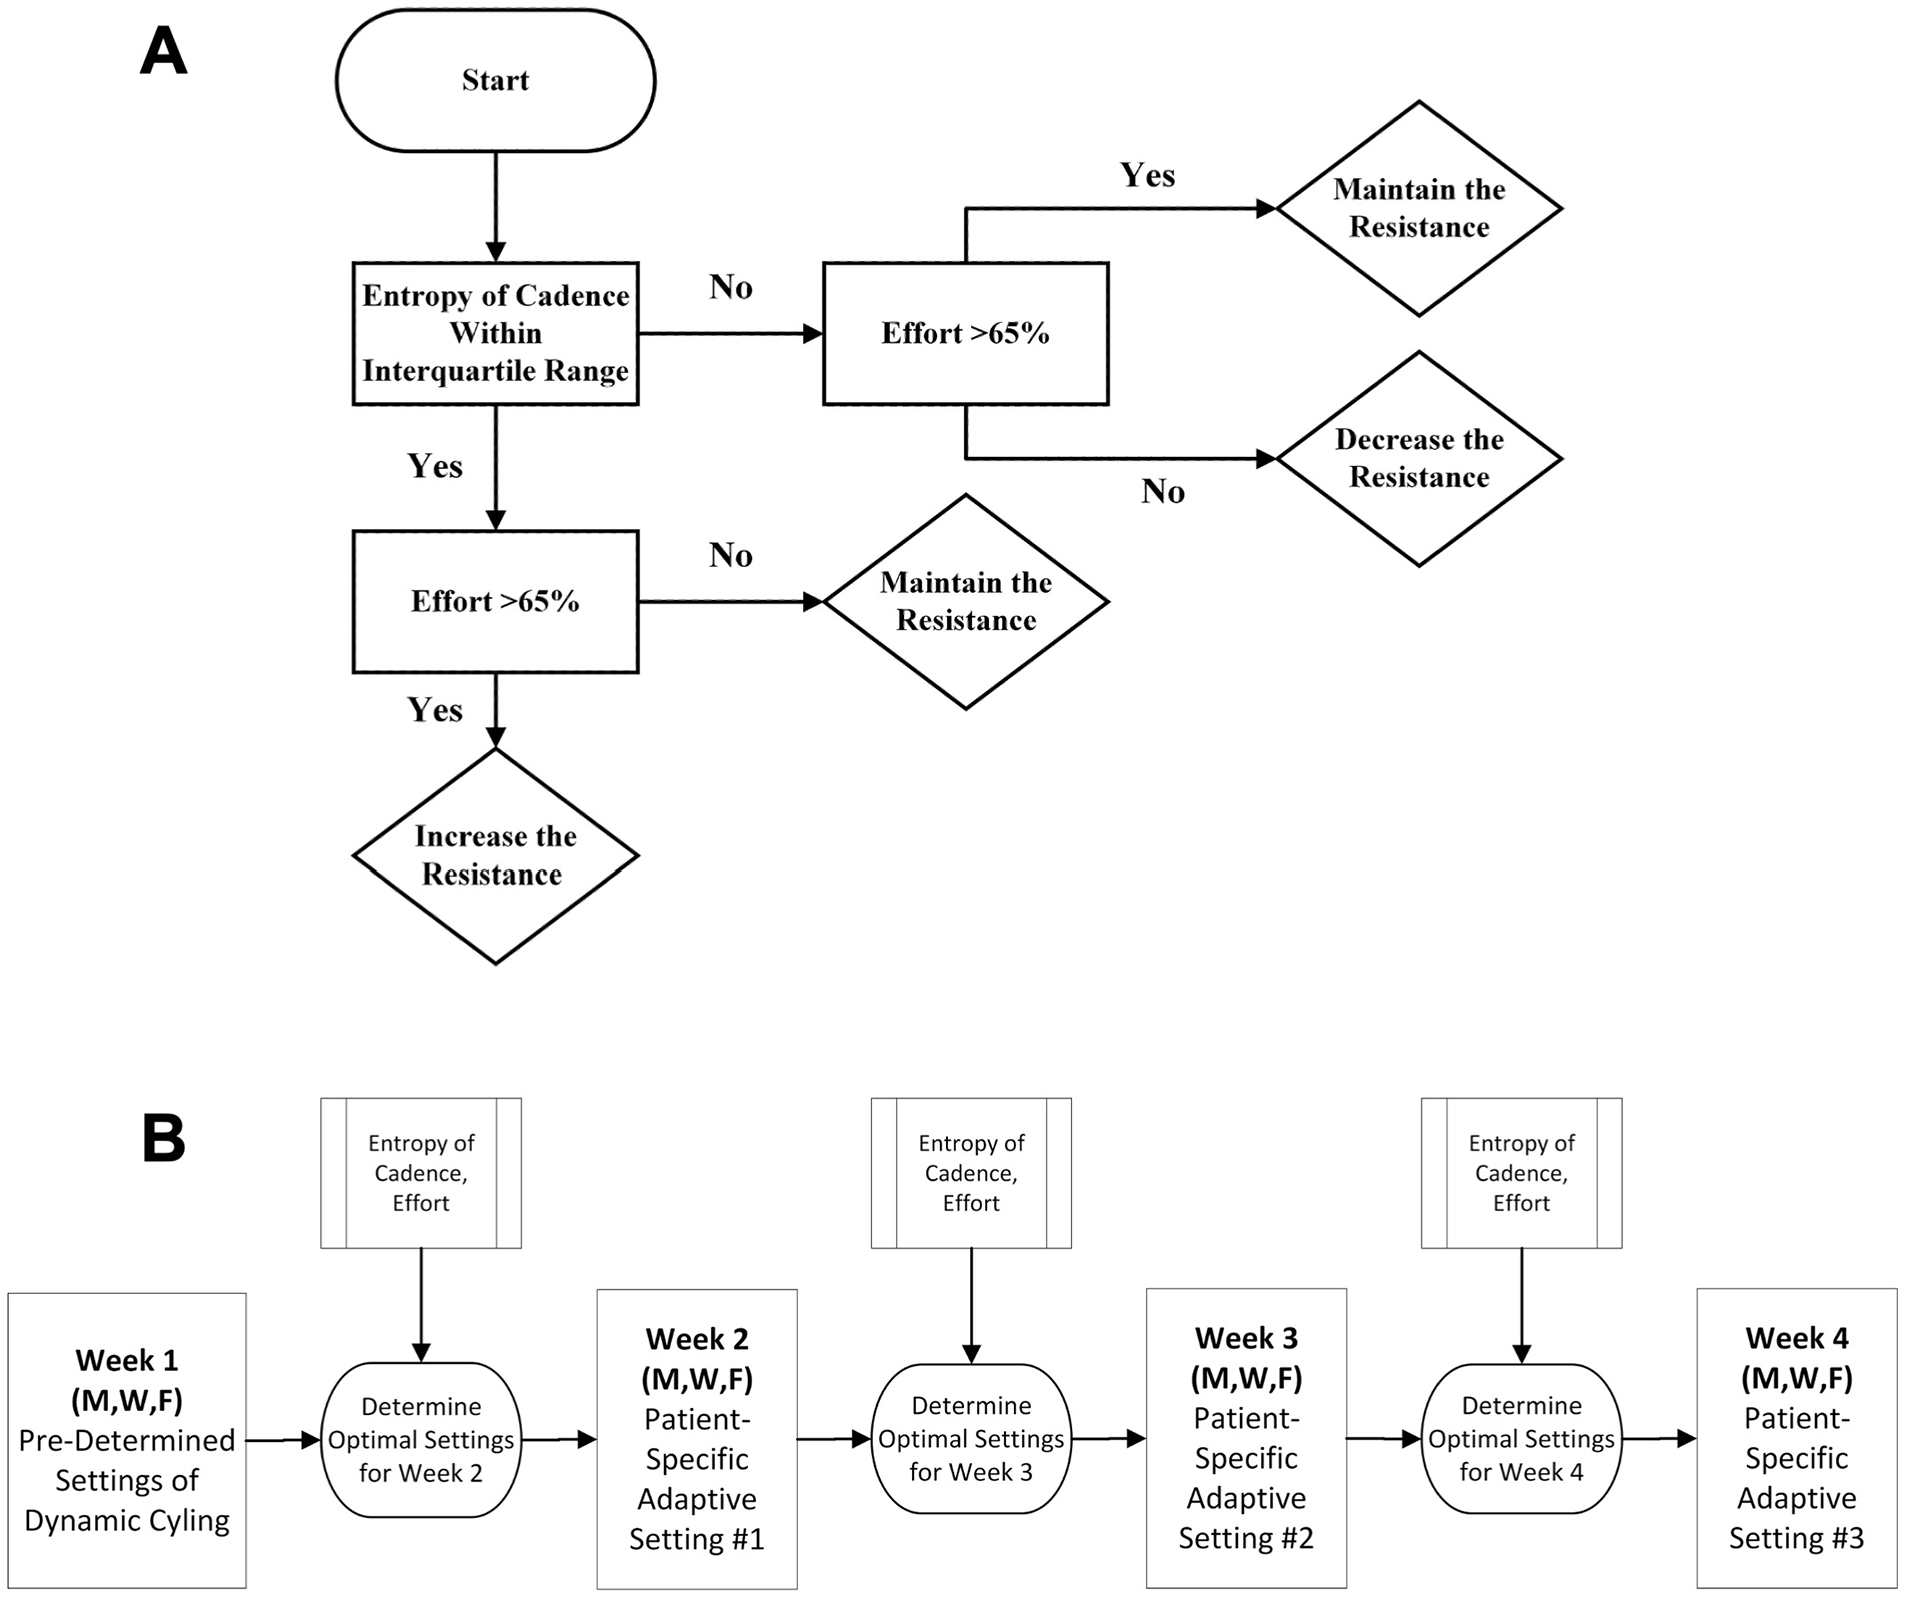
(A) PSADC Algorithm was developed based on participants’ entropy of cadence and effort variables. (B) Protocol Optimization Process for PSADC Group. The optimization process for the PSADC group was completed after the third, sixth, and ninth sessions.
SampEn of Cadence Calculation
SampEn of cadence was calculated for each of the 12 exercise sessions, yielding 12 values for each participant. A micro controller on the dynamic cycle captured cadence values every second and converted them into a text file that could be downloaded after each exercise session. SampEn of cadence for each experiment was calculated using a custom MATLAB script created by Mohammadi-Abdar et al 20 and modified by Gates. 21 For the final data analysis, we calculated the average of 12 SampEn of cadence for each participant. Finally, in order to further understand how SampEn of cadence affected changes in the Kinesia™ motor function score, SampEn of cadence data was divided into a high SampEn of cadence group (above average; HE) and low SampEn of cadence group (below average; LE) based on the average of SampEn of cadence during all 12 sessions.
Effort Calculation
Effort was calculated during each session based on the measure power level during the exercise period. Because dynamic cycling involved a motorized bike, power was calculated from the motor output. A negative power value indicated that the rider was not producing effort and that the motor was performing the work to maintain the preset cadence. A power value of 0 indicated that the participant and the motor shared equally in maintaining the cadence with the given resistance, and a positive power value indicated that the participant was producing effort to override the resistance provided by the motor. During each session, power values were recorded every second. Effort was the percentage of time a participant produced positive power during the session. The equation for calculating effort was the following:

Effort level is an important variable in exercise prescription because it can predict motor function improvement (MDS-UPDRS Motor III) after cycling intervention. Gates and Ridgel 22 found a significant correlation between post-UPDRS Motor III score and mean effort (R2 = −.44, P = .02).
Changes of Dynamic Cycling Settings for PSADC Group
PSADC dynamic cycling settings were based on SampEn of cadence and effort values calculated from the previous 3 dynamic cycling sessions. If the average SampEn of cadence from the previous 3 sessions was within the interquartile range of healthy, young adults (calculated in Aim 1) and effort was greater than 65%, the resistance level was increased by one for the next 3 sessions. If SampEn of cadence was within the interquartile range of healthy, young adults but effort was less than 65% or if SampEn of cadence was below the interquartile range, but effort was greater than 65%, we used the same resistance level for the next 3 sessions. When SampEn of cadence was below the interquartile range and effort was below 65%, we used a lower resistance level for the next 3 sessions. Table 1 illustrates the dynamic cycling settings in the PSADC group throughout the intervention period.
PSADC Dynamic Cycling Settings for 12 Sessions (PSADC Group).
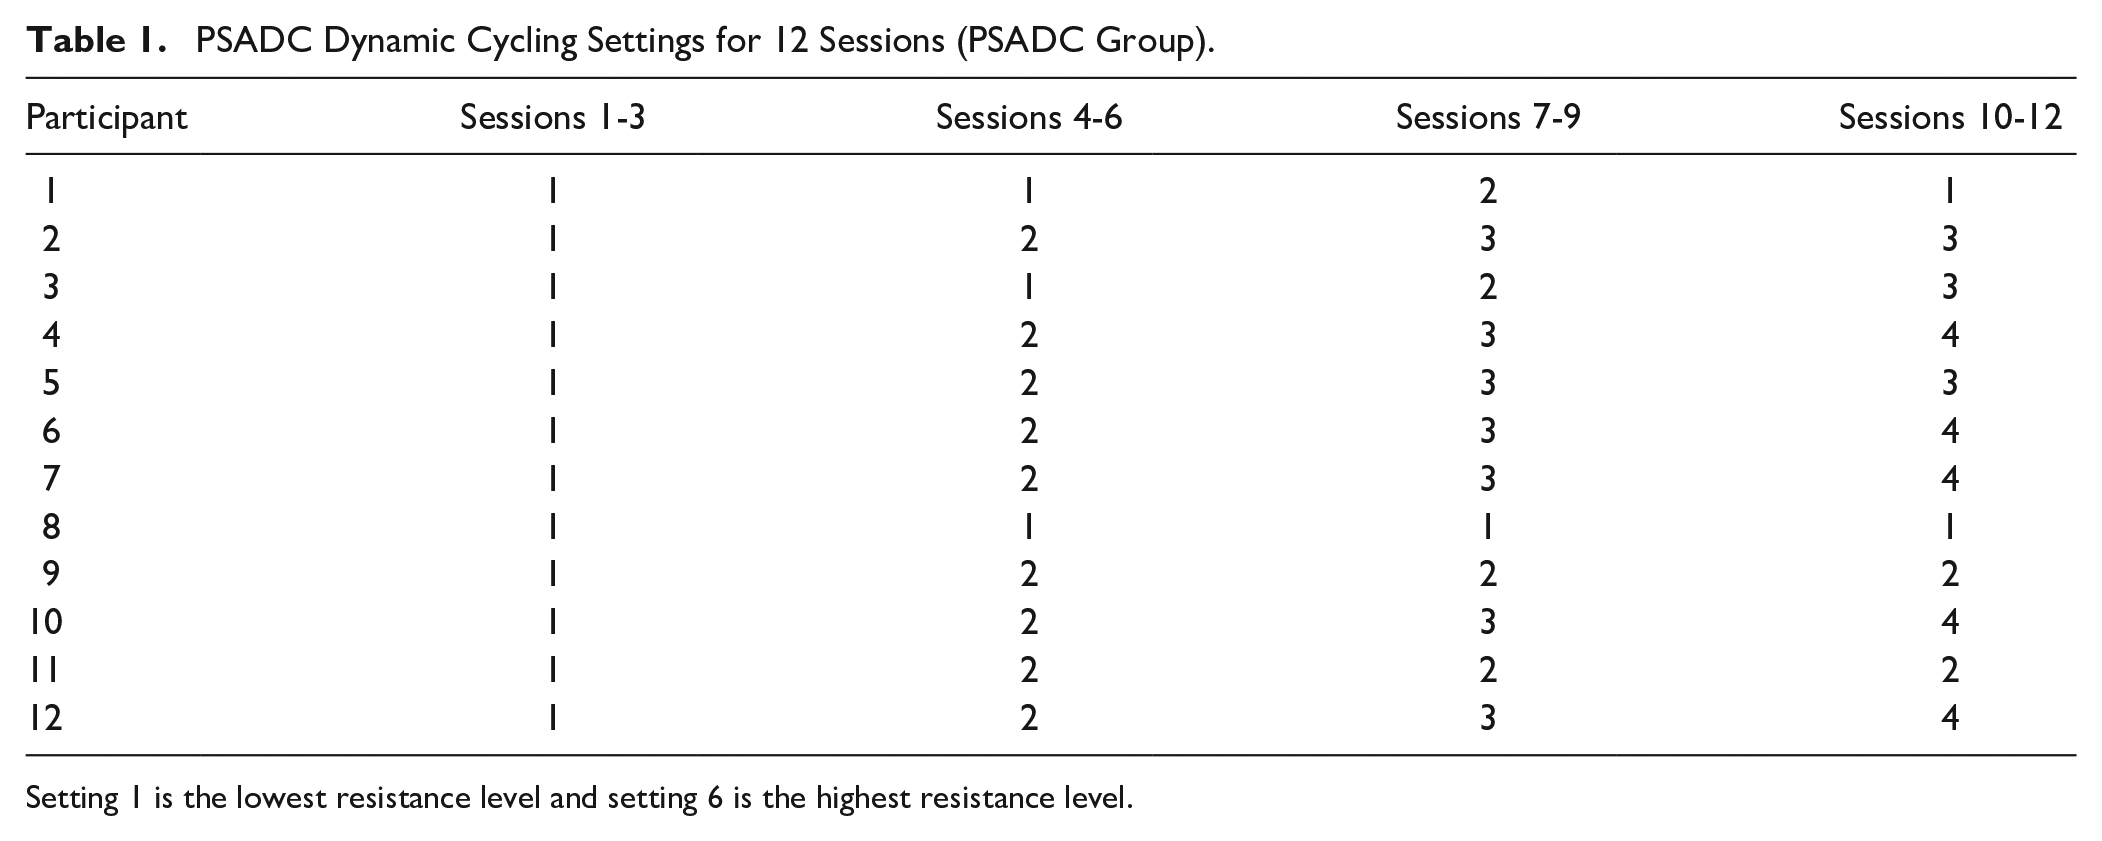
Setting 1 is the lowest resistance level and setting 6 is the highest resistance level.
PD Motor Symptom Measurements
PD-related motor symptoms were evaluated by using the Kinesia™ motor function test (Great Lakes Neurotechnology, Cleveland, OH). Sensors were attached to the finger and the heel of the participants to evaluate their tremor, bradykinesia, and mobility. The data from the sensors was automatically uploaded to the online portal, providing scores on a 0 to 4 scale. 28 The Kinesia™ motor function test has demonstrated greater reliability and validity in objectively measuring PD motor symptoms. This reduces statistical bias and variability in the measurement of PD motor function, while being particularly sensitive in the measurement of tremor and bradykinesia.29-31 The Kinesia™ motor function test data were collected before and immediately after every cycling session. Kinesia motor function score improvement was calculated as the difference between the 12th session and the baseline score. To ensure the normality of the data, we conducted the Shapiro–Wilk test on the Kinesia™ motor function improvement scores. The results indicated that the Kinesia™ motor function improvement scores were normally distributed (P = .537).
Physiological Measurements
HR was measured every 2 minutes using a wrist-based HR monitor (Mi Band 6, Xaomi, China). Rating of perceived exertion (RPE) was obtained every 4 minutes using a 6 to 20 Borg RPE scale. Body mass index (BMI) was calculated as weight in kilogram divided by square of the height in meters.
Cycling Variables Measurements
Cycling variables, including Pedaling Speed (RPM), Power (W), and Effort (%), were obtained for each session and averaged over the 12 sessions for the final data analysis.
Statistical Analysis
For Aim 1, descriptive statistics including mean and standard deviation of cadence entropy were calculated. In addition, the interquartile range of cadence entropy was calculated for each dynamic cycling setting. For Aim 2, multiple linear regression (MLR) analysis was used to analyze the relationship between SampEn of cadence, effort, and the change in Kinesia motor function score. Kinesia motor function score change from 12th session and the baseline was the dependent variable, and average value of SampEn of cadence for 12 sessions, BMI, and effort were predictors. To measure the strength and direction of the relationship between SampEn of cadence and motor function score improvement, Pearson’s correlation coefficient test (2-tailed) was conducted. To measure the effects of the level of SampEn of cadence on PD motor symptoms, participants were divided into either a high entropy group (HE) or a low entropy group (LE) based on their entropy of cadence values. A repeated measures ANOVA (2 groups [HE vs LE] by 2 time points) was then conducted to examine the effects of SampEn of cadenceon PD motor symptoms. To measure the effects of the PSADC paradigm on PD motor symptoms, a repeated measured ANOVA (2 groups [PSADC vs NA] by 2 time points) was performed. Demographic, physiological, and cycling variables between the 2 groups (PSADC, NA) were analyzed with an independent samples t-test. SPSS version 28 (Armonk, NY: IBM Corp) was used for statistical analysis. Alpha for statistical significance was set to .05.
Results
SampEn of Cadence of Healthy, Young Adults
In order to build an initial template for protocol optimization, 20 healthy, young adults (ages 20-32) completed 5 minutes of dynamic cycling at 6 different resistance settings (1-6). Setting 1 was the lowest resistance level and setting 6 was the highest resistance level. SampEn of cadence values and the interquartile range for each setting are shown in Table 2. These values served as reference points for the adaptive dynamic cycling paradigm in the second study in individuals with PD.
Participants’ Demographic, PD-Related, and Cycling Variables.
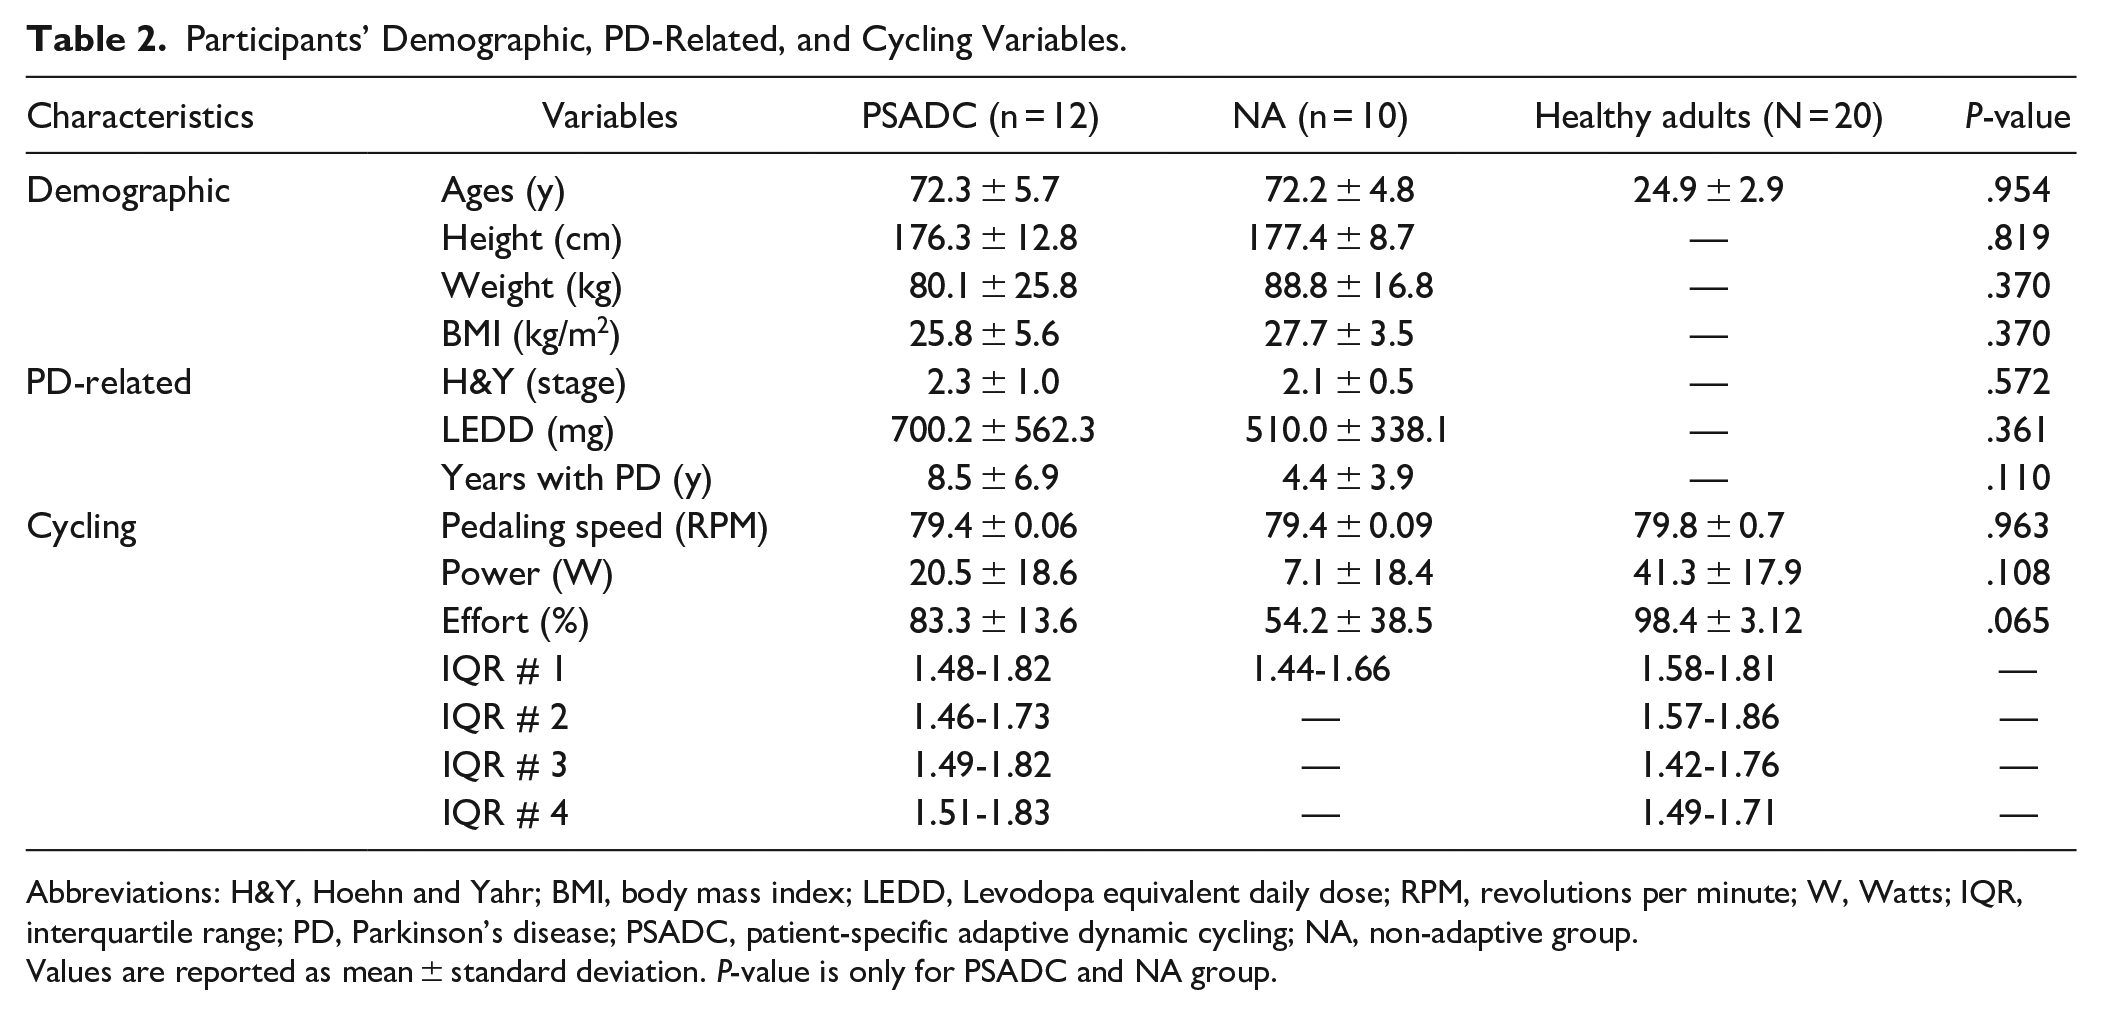
Abbreviations: H&Y, Hoehn and Yahr; BMI, body mass index; LEDD, Levodopa equivalent daily dose; RPM, revolutions per minute; W, Watts; IQR, interquartile range; PD, Parkinson’s disease; PSADC, patient-specific adaptive dynamic cycling; NA, non-adaptive group.
Values are reported as mean ± standard deviation. P-value is only for PSADC and NA group.
Demographic and Cycling Variables
Twenty four individuals with PD were recruited for this study. Twenty two participants completed the protocol and all assessments (one participant did not complete the final assessment and one participant was unable to complete the full Kinesia™ motor function test due to an upper extremity orthopedic issue). Twelve participants completed 12 sessions of the PSADC protocol, and 10 participants completed 12 of the NA protocol. There were no significant differences for any of the demographic or cycling variables between the 2 groups (Table 2).
Relationship Between SampEn of Cadence and Kinesia Motor Function Score Improvement
To determine the relationship between SampEn of cadence and Kinesia motor function score improvement, a 2-tailed Pearson’s correlation coefficient test was conducted. Pearson’s correlations coefficient revealed a significant negative relationship between SampEn of cadence and Kinesia motor function score improvement (R2 = −.545, P = .009). A higher SampEn of cadence led to greater Kinesia motor function score improvement (Figure 3).
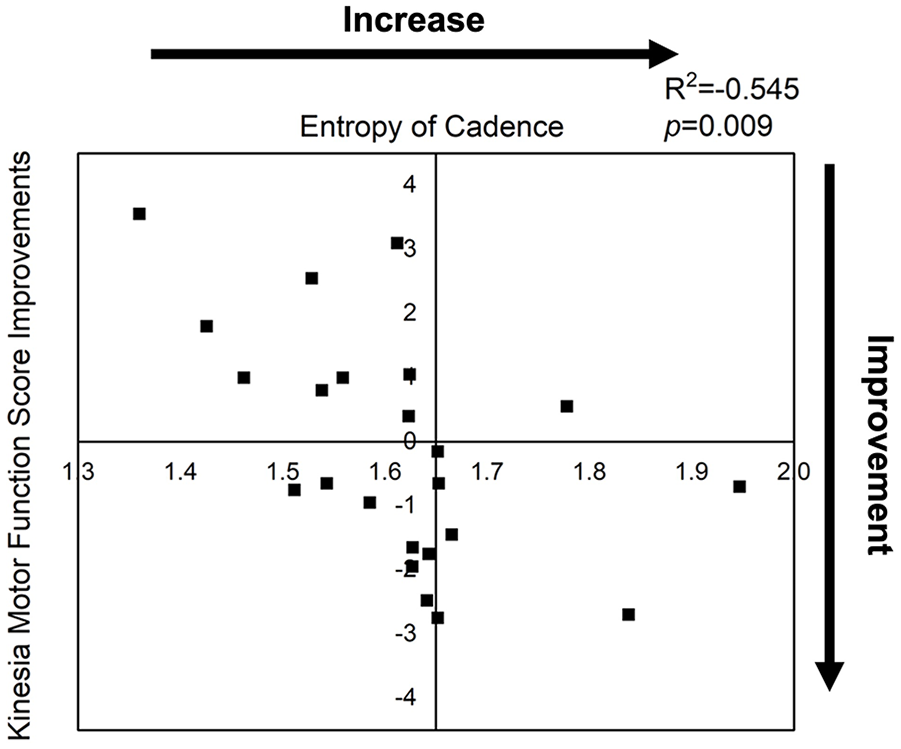
Relationship between entropy of cadence and Kinesia motor function score improvement. A significant negative relationship emerged between entropy of cadence and Kinesia motor function score improvement (R2 = −.545, P = .009).
Predictors of Kinesia™ Motor Function Score Improvement
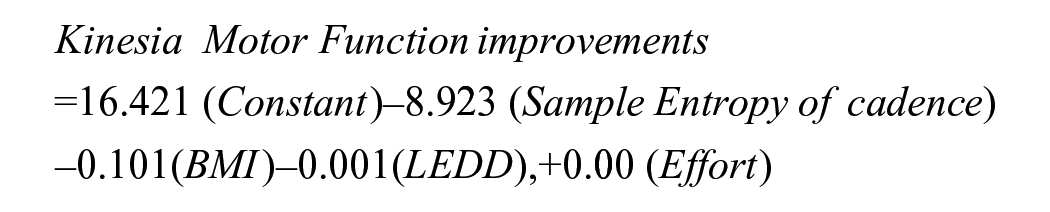
To determine if SampEn of cadence, effort, BMI, and Levodopa equivalent daily dose (LEDD) affected Kinesia™ motor function score improvement, MLR analysis was performed. 22.3% of the variance in Kinesia™ motor function score improvement was attributable to the 4 predictors collectively (F(4, 16) = 2.436, P = .09). MLR showed that SampEn of cadence was the strongest predictor of Kinesia™ motor function score improvement (β = −8.923, t = −2.632, P = .018, CI: −16.111, −1.736), followed by BMI (β = −0.101, t = −1.125, P = .277, CI: −0.290, 0.089, P = .277), LEDD (β = 0.001, t = 1.097, P = .289, CI: −0.001, 0.003), and Effort (β = 0.000, t = 0.018, P = .986, CI: −0.019, 0.020). This analysis resulted in the following formula for predicting Kinesia motor function score improvement:
Effects of SampEn of Cadence on Kinesia™ Motor Function Score
A repeated measured ANOVA (2 groups: HE, LE by 2 time points: pre-, post-) revealed a significant group by time interaction (F = 5.160, df = 1, P = .034, ηp2 = 0.205). After applying the Bonferroni correction (adjusted P-value of .025), there were no significant changes in the HE group (t = 1.427, df = 12, P = .179) or the LE group (t = −1.800, df = 8, P = .110) in pre- and post-Kinesia™ motor function scores. However, the HE group showed a 3.55% improvement in Kinesia motor function score, while the LE group showed a 4.64% decrease (Figure 4A).
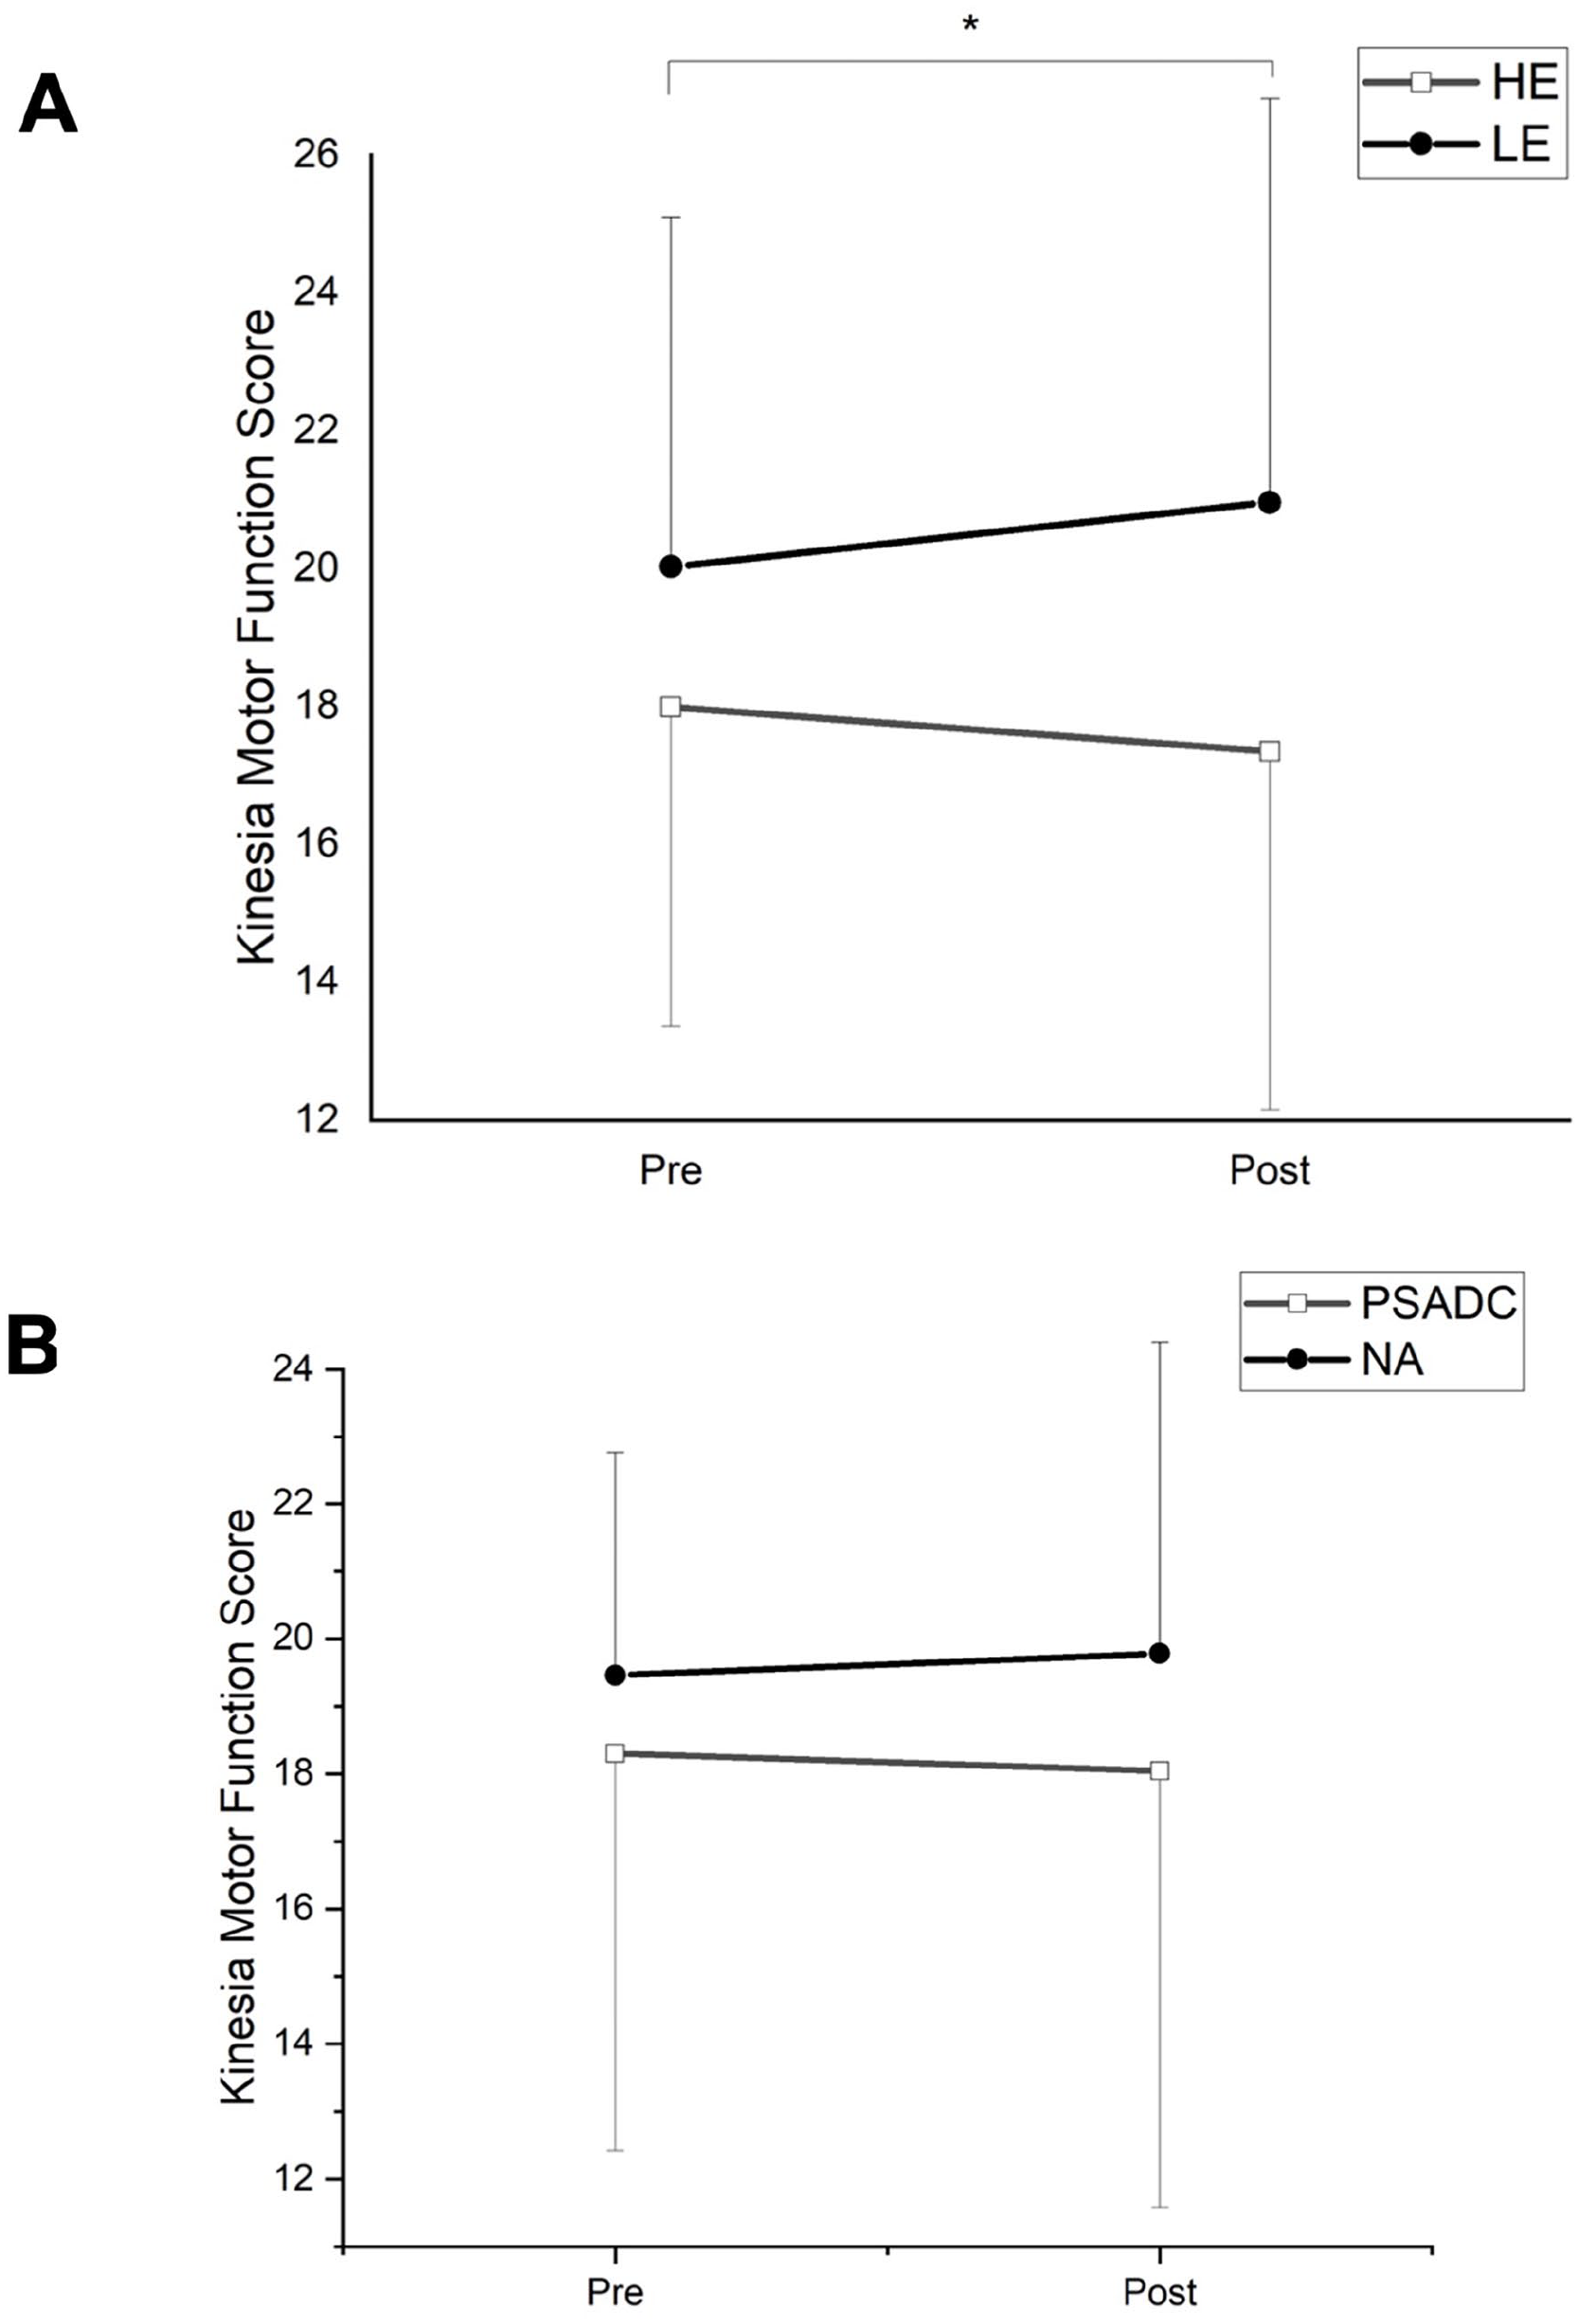
(A) Effects of entropy of cadence on Kinesia motor function scores. HE, high entropy of cadence; LE, low entropy of cadence. *P < .05 (Group by Time interactions), HE (pre: 17.99 ± 4.63, post: 17.35 ± 5.20), LE (pre: 20.03 ± 5.07, post: 20.96 ± 5.86). (B) Effects of PSADC on motor functions. PSADC, patient-specific adaptive dynamic cycling group; NA, non-adaptive group. PSADC (pre: 18.30 ± 5.87, post: 18.04 ± 6.46), NA (pre: 19.46 ± 3.30, post: 19.78 ± 4.63).
Effects of PSADC on Kinesia Motor Function Score
To examine the effects of the PSADC paradigm on PD motor functions, a repeated measured ANOVA was conducted. A repeated measures ANOVA revealed that there was no significant group by time interaction (F = 0.578, df = 1, P = .456, ηp2 = 0.028) nor main effect of time (F = 0.004, df = 1, P = .948, ηp2 = 0.000). However, the PSADC group showed a 1.42% improvement in Kinesia motor function score, whereas NA group showed a 1.64% worsening (Figure 4B).
Discussion
This study showed a significant correlation between the SampEn of cadence and motor function improvement, indicating that SampEn of cadence is an important factor in the degree of motor function improvements observed after high-cadence dynamic cycling. While the PSADC group did not show a statistically significant greater improvement in PD motor symptoms compared to the NA group, they did show a small improvement while the NA group showed a decline. This suggests that PSADC may have some potential benefits in preventing worsening of motor symptoms. The physiological complexities of PD, including the variety and severity of PD motor symptoms 32 and abnormal cardiovascular responses to exercise,33,34 make it challenging to optimize exercise-based therapies in this population. The study 35 acknowledged the important of regular exercise for patients with PD, and in this study, we have leveraged the potential of SampEn of cadence to design an adaptive exercise paradigm based on cycling performance and motor symptoms.
During the protocol optimization process, we used SampEn of cadence data from a healthy young population as a reference group. By comparing the data from this group to the information collected from the PD population, we gained a clearer understanding of the differences in SampEn of cadence with changes in resistance during high cadence cycling. We believe that the entropy of cadence in age-matched individuals without PD would also have similar values to those with PD due to the natural progression toward abnormal movement variability associated with aging. 36 Specifically, we observed that in general the healthy young population had higher SampEn values when compared to the PD population. This observation is consistent with previous research indicating that older adults and individuals with neurological disorders tend to have abnormal SampEn (variability) values due to limited movement patterns or impaired regulatory mechanisms during physical activity.37-39 Based on these findings, we reasoned that if the SampEn of cadence data from PD participants fell within the interquartile range of the healthy young population, it would indicate that movement patterns were in a good range for PD participants during dynamic cycling. We speculated that this would result in enhanced physiological benefits and improve the therapeutic effects of dynamic cycling on motor function in individuals with PD.
The current findings support our previous hypothesis that SampEn of cadence is a strong driver of motor function improvement in individuals with PD.20,22 We found a significant correlation between high SampEn of cadence and greater motor function improvement. When SampEn of cadence was greater than the average SampEn of cadence value of 1.6, Kinesia™ motor function score improved by 0.65 points. When SampEn of cadence was below the average, the Kinesia™ motor function score decreased (worsened) by 1 point. The correlations analysis also supports the conclusion that SampEn of cadence can be an impactful indicator of PD motor function improvement.
The physiological mechanisms underlying the effects of increased SampEn of cadence on motor function improvement are not known. One hypothesis is that high-cadence cycling promotes brain activity,40-42 triggering the release of neurotrophic factors and neurotransmitters such as dopamine and brain-derived neurotrophic factor.43,44 A second hypothesis is that improvements in the variability of movement patterns and increasing SampEn of cadence, generates complex and variable sensory input to the cortex, potentially activating proprioceptors 45 and improving peripheral afferent input. 46 This change, in turn, can activate basal ganglia circuits and enhance central motor processing, leading to improvements in motor function symptoms such as bradykinesia and tremor. The last potential physiological mechanism is that greater SampEn of cadence may facilitate neuromuscular control and motor learning. As participants engage in a wider range of movement patterns, they may become more adept at coordinating and controlling their active muscles. 47 It is possible that improved neuromuscular control and motor learning may lead to improved PD motor function in individuals with PD.
Technologies such as functional magnetic resonance imaging (fMRI), functional near-infrared scanning, electroencephalography, and recordable deep brain stimulation local field potentials could be useful for understanding how activity in the motor and sensory cortex, as well as the basal ganglia, changes after PSADC. Previous studies have shown that a single session of forced (tandem) cycling increased activity in areas of the basal ganglia, as measured with fMRI, 14 In addition, the pattern of cortical and subcortical activation following forced cycling (off medication) was similar to activity measured when individuals were taking PD medications.
There are several limitations with this study. The first is the small sample size, which may have resulted in a potential underpowering of our statistical analysis. According to the literature, 48 a sample size of approximately 25 participants is generally recommended for multiple predictor models to ensure adequate power. For future research, we plan to recruit more than 25 participants to ensure statistical power and generalizability of our findings. Additionally, more data needs to be collected to develop a model that can be used to automatically adjust the settings of the motorized bike for each exercise session. Shortening the intervals of adjustment to every session or even periods within a given session may also detect more immediate changes in the condition and performance of participants, and thus allow the bike settings to be adjusted to accelerate motor function improvements. More specifically, additional data will allow for the development of machine learning (classification and regression tree) or adaptive data-driven algorithms rather than manual adaptation. Although the manual process resulted in a greater SampEn of cadence in the PSADC group compared to the NA group, data-driven techniques could provide more accurate and valid exercise prescription for individuals, leading to more significant improvements in motor function and functional mobility in a wide range of individuals with PD.
A second limitation of this study was that participants were “on” medication during testing and cycling. Levodopa equivalent dosage did show a wide range in our subjects but there was no significant difference between the groups. However, our aim was to examine the effects of PSADC on PD motor function in real-life conditions. Prodoehl et al 49 suggested that if each participant maintained their dosage and timing, the results should be reliable. We strictly controlled the dosage and timing for the baseline measurement, the post-exercise measurements, and the exercise sessions to minimize daily fluctuation of PD medication. In addition, Dibble et al 50 reported that combining exercise and medication has greater treatment effects on mobility than either exercise or medication alone. Ultimately, high-cadence dynamic cycling during “on” medication status could maximize the treatment effect on PD motor symptoms. A third limitation is the short intervention period (12 sessions, 4 weeks) and lack of follow-up. It is not clear if a longer intervention will promote continued improvement or if the changes would stabilize over the long term.
Conclusions
Our findings provide initial evidence of the potential benefits of using SampEn of cadence and effort values to guide individualized exercise rehabilitation plans for individuals with PD. We found that higher SampEn of cadence led to greater improvement in PD motor function and confirmed that SampEn of cadence is a strong indicator of PD motor function improvement. In future studies, direct measurement of brain activity before, during, and after PSADC could reveal the physiological mechanisms behind motor function improvement and conducting long-term randomized control trials would enable us to investigate the effects of PSADC on PD motor symptoms.
Footnotes
Acknowledgements
The authors would like to acknowledge Jessica Smith-Ricketts, Mason Hakeos, Jacob Herbst for assistance with data collection, Peter Gates and Prajakta Joshi for developing the entropy analysis code, and Hassan Abdar for building the dynamic bike.
Author Contributions
Declaration of Conflicting Interests
The author(s) declared the following potential conflicts of interest with respect to the research, authorship, and/or publication of this article: Angela Ridgel and Kenneth Loparo are co-inventors on two patents which are related to the device used in this study: “Bike System for Use in Rehabilitation of a Patient,” US 10,058,736. No royalties have been distributed from this patent.
Funding
The author(s) disclosed receipt of the following financial support for the research, authorship, and/or publication of this article: This work was funded by the Davis Phinney Foundation, TeCK Fund, the College of Education, Health, and Human Services at Kent State University and the Brain Health Research Institute at Kent State University, and US Department of Veteran’s Affairs I01RX003676.
Data Availability Statement
Deidentified data may be available upon request.