
Abstract
Background
Corticospinal tract (CST) is the principal motor pathway; we aim to explore the structural plasticity mechanism in CST during stroke rehabilitation.
Methods
A total of 25 patients underwent diffusion tensor imaging before rehabilitation (T1), 1-month post-rehabilitation (T2), 2 months post-rehabilitation (T3), and 1-year post-discharge (T4). The CST was segmented, and fractional anisotropy (FA), axial diffusion (AD), mean diffusivity (MD), and radial diffusivity (RD) were determined using automated fiber quantification tractography. Baseline level of laterality index (LI) and motor function for correlation analysis.
Results
The FA values of all segments in the ipsilesional CST (IL-CST) were lower compared with normal CST. Repeated measures analysis of variance showed time-related effects on FA, AD, and MD of the IL-CST, and there were similar dynamic trends in these 3 parameters. At T1, FA, AD, and MD values of the mid-upper segments of IL-CST (around the core lesions) were the lowest; at T2 and T3, values for the mid-lower segments were lower than those at T1, while the values for the mid-upper segments gradually increased; at T4, the values for almost entire IL-CST were higher than before. The highest LI was observed at T2, with a predominance in contralesional CST. The LIs for the FA and AD at T1 were positively correlated with the change rate of motor function.
Conclusions
IL-CST showed aggravation followed by improvement from around the lesion to the distal end. Balance of interhemispheric CST may be closely related to motor function, and LIs for FA and AD may have predictive value for mild-to-moderate stroke rehabilitation. Clinical Trial Registration. URL: http://www.chictr.org.cn; Unique Identifier: ChiCTR1800019474.
Keywords
Introduction
Motor dysfunction is the most common symptom of stroke disability.1,2 Rehabilitation has been proven to improve the degree of disability, and brain plasticity mechanisms theoretically underlie its effectiveness. 3 Corticospinal tract (CST) is the principal motor pathway and exploring its plasticity mechanisms will be useful for the formulation of rehabilitation strategies. Currently, the analysis of the plasticity of the CST is mainly based on diffusion tensor imaging (DTI) and involves voxel-based analysis or fiber tracking methods to assess the morphology and structural integrity of the CST after stroke. Most previous studies have focused on the average value of the entire CST or a segment4,5 and elucidated the characteristics of fiber bundles in a selected period.6,7 However, the CST is a longitudinal fiber bundle. Pathophysiological principles suggest that damage to the fiber bundle by a stroke lesion is bidirectional, the severity of the injury is related to the distance from the lesion, and the injury and repair of the fiber bundle should be a dynamic process. Therefore, analyzing only the average value of the entire fiber bundle or a segment may not reveal potentially important information about the CST. To obtain more insights into the plasticity mechanism of the CST during rehabilitation, it is necessary to observe the degree of injury to different subsegments and the characteristics of changes during different periods.
Automated fiber quantification (AFQ) tractography facilitates fine-grained analysis of the CST. AFQ is a new method for DTI analysis,8,9 and it can automatically track 20 main fiber bundles including the CST; each fiber bundle can be equally divided into several segments, and indexes reflecting the severity of damage to the microstructure of any part of the fiber bundle, such as fractional anisotropy (FA), mean diffusivity (MD), axial diffusivity (AD), and radial diffusivity (RD), can be calculated for each segment. In addition, the AFQ results show highly reliable and reproducible.8,10 AFQ has been widely used in neurological and psychological scientific studies,11-13 but only a few of these are related to stroke rehabilitation. AFQ can allow thorough observation of structural damage to different segments of the CST and provide insights into the brain plasticity mechanism underlying stroke rehabilitation.
The aim of this study was to comprehensively explore microstructural characteristic changes in CST during stroke rehabilitation using AFQ tractography. A prospective longitudinal design was utilized, involving the assessment of DTI and clinical evaluations at various time intervals before and following stroke rehabilitation. The ipsilesional CST (IL-CST) and contralesional CST (CL-CST) were equally divided into 100 segments, with the calculation of FA, AD, MD, and RD values for each segment. Our study is grounded on 2 primary hypotheses. Firstly, we hypothesize differences between IL-CST and healthy controls (HC), as well as between CL-CST and HC. We also posit dynamic changes in both IL-CST and CL-CST during stroke rehabilitation. Secondly, recognizing potential inconsistencies in the degree of damage to IL-CST and CL-CST, we employ the laterality index (LI) to investigate the asymmetry of bilateral CST. Our hypothesis suggests that CL-CST may exhibit lateralization dominance, and we propose a correlation between the baseline LI level and motor function.
Methods
Participants
We included patients with subacute ischemic stroke hospitalized at the China Rehabilitation Research Center between November 2018 and April 2022 for observation, and 25 underwent the imaging studies and clinical assessments required for the study. An additional 32 healthy individuals matched for sex, age, and vascular risk factors were included as controls. The inclusion criteria were: (i) ages of 18 to 85 years; (ii) 8 to 30 days after first stroke onset; (iii) single subcortical infarction in the middle cerebral artery territory with motor deficits; and (iv) meeting the diagnostic criteria of ischemic stroke set forth by the World Health Organization 14 and confirmed by cranial computerized tomography or magnetic resonance imaging (MRI); (v) sign the informed consent form. The exclusion criteria were: (i) claustrophobia or contraindications for MRI; (ii) non-stroke diagnosis affecting limb function; (iii) cognitive impairment using the Mini-Mental State Examination scale (cutoff ≤24); (iv) obvious depression symptoms based on the Hamilton Depression scale score (cutoff ≥20); and (v) incomplete medical records.
All enrolled participants received equal standard rehabilitation treatment based on principles consistent with the American Heart Association/American Stroke Association guidelines for adult stroke rehabilitation, 15 including physical and occupational therapies (≥3 hours/day, 5 days/week), at the China Rehabilitation Research Center for a total intervention duration of 2 months. After discharge, rehabilitation continued in the community or at home, and we developed an individualized rehabilitation program for each patient. Four separate sessions of DTI and clinical assessments were conducted for each patient: before rehabilitation (first, T1), after a month of rehabilitation (second, T2), after 2 months of rehabilitation (third, T3), and 1 year after discharge (fourth, T4). The enrolled patients were guaranteed to complete at least 3 assessments to be included in the trial; only 1 DTI was required for each healthy individual.
The study was approved by the Ethics Committee of the China Rehabilitation Research Center (2018-008-1), and each participant signed an informed consent form after receiving detailed information about the study.
Clinical Assessment and Quality Control
Considering that both upper and lower extremities of patients may have impaired motor function, we used the total score of the Fugl-Meyer motor assessment of all extremities (FMA) to evaluate the motor function, including 50 items (33 items for upper extremities and 17 items for lower extremities). Each item was scored 0 to 2, with a maximum score of 100, and the higher the score, the better the motor function. In addition, the National Institutes of Health Stroke Scale (NIHSS) was used to assess the stroke severity, including 11 items, with a total score of 0 to 42, the higher the score the more severe the neurological damage.
To ensure the quality of the study and to reduce confounding factors, 1 independent senior professional physician performed these assessments on the same day with DTI, and imaging data were independently processed by an imaging specialist who was blinded to the clinical information.
Image Data Acquisition
All images were obtained with a Philips Ingenia 3.0T TX magnetic resonance scanner (Royal Philips Electronics) at the China Rehabilitation Research Center. To ensure scan quality, the head of each participant was tightly fixed by a foam pad and fitted with headphones to reduce head movement and scanner noise. The 8-channel head array coil was used for echo plane imaging to obtain high-resolution structure images. The axis of the image is parallel to the anteroposterior commissure line that covers the whole brain. The DTI scan parameters were as follows: repetition time (TR) = 10 000 ms, echo time (TE) = 97 ms, field of view (FOV) = 256 mm × 256 mm, voxel = 2 mm × 2 mm × 2 mm, flip angle = 90°, matrix = 128 × 126. The parameters of the T1_3D weighted fast spin echo sequence were as follows: TR = 7.6 ms, TE = 3.7 ms, flip angle = 8°, FOV = 256 mm × 256 mm, voxel = 1 mm × 1 mm × 2 mm, and matrix = 256 × 256.
Each DTI dataset included 32 noncollinear spatial directions at b-value = 1000 s/mm2 and 1 baseline image at b = 0 s/mm2, and DTI data was used for the CST tracking. T1-3D data was mainly used for segmentation of lesions and image alignment during DTI data processing. For better clarification of lesion information, we also performed diffusion-weighted imaging: TR = 3231 ms, TE = 99 ms, flip angle = 90°, and FOV = 208 mm × 231 mm.
Image Processing
We manually assessed the imaging quality of each sequence and removed images with obvious head motion and artifacts. We also performed data format conversion, head motion eddy correction, gradient orientation correction, brain mask acquisition, and tensor calculation using the Functional MRI of the Brain Software Library version 6.0.3 commands to generate FA, MD, AD, RD, S0, and other files.9,16,17
CST tracking and extraction were performed using the MATLAB platform and open-source AFQ software (https://github.com/yeatmanlab/AFQ). The process mainly included (1) converting the data obtained from the previous steps into a dt6 file in MATLAB format using the dtiMakeDt6FromFsl command; (2) setting the tracking parameters for FA threshold greater than 0.2 and turning angle less than 45° for whole-brain fiber tracking; (3) segmenting 20 major fiber tracts from whole-brain fibers; (4) cleaning up the raw fiber tracts based on the average length or 4 standard deviations of fiber bundle cores to clean up the original fiber bundles; (5) equally dividing the CST into 100 subsegments from the midbrain to the primary motor cortex and extracting diffusion tensor values for each segment; to comprehensively assess the microstructural changes in the CST during stroke rehabilitation, we computed the FA, MD, AD, and RD values for each subsegment, as these indexes provide distinct perspectives on fiber bundle damage 18 ; (6) to facilitate inter-group comparisons, the data of the subjects with right hemisphere cerebral infarction were flipped left-right; consequently, the left-side data of all patients represented the ipsilesional side, while the right-side data represented the contralesional side; correspondingly, accounting for the potential systematic effects from hemispheric differences, for the HC group, a new set of data, including bilateral corticospinal data, was generated after flipping the left and right hemispheres; and (7) extracting CST information, with the left CST being ipsilateral to the lesion and the right CST being contralateral to the lesion (Figure 1).
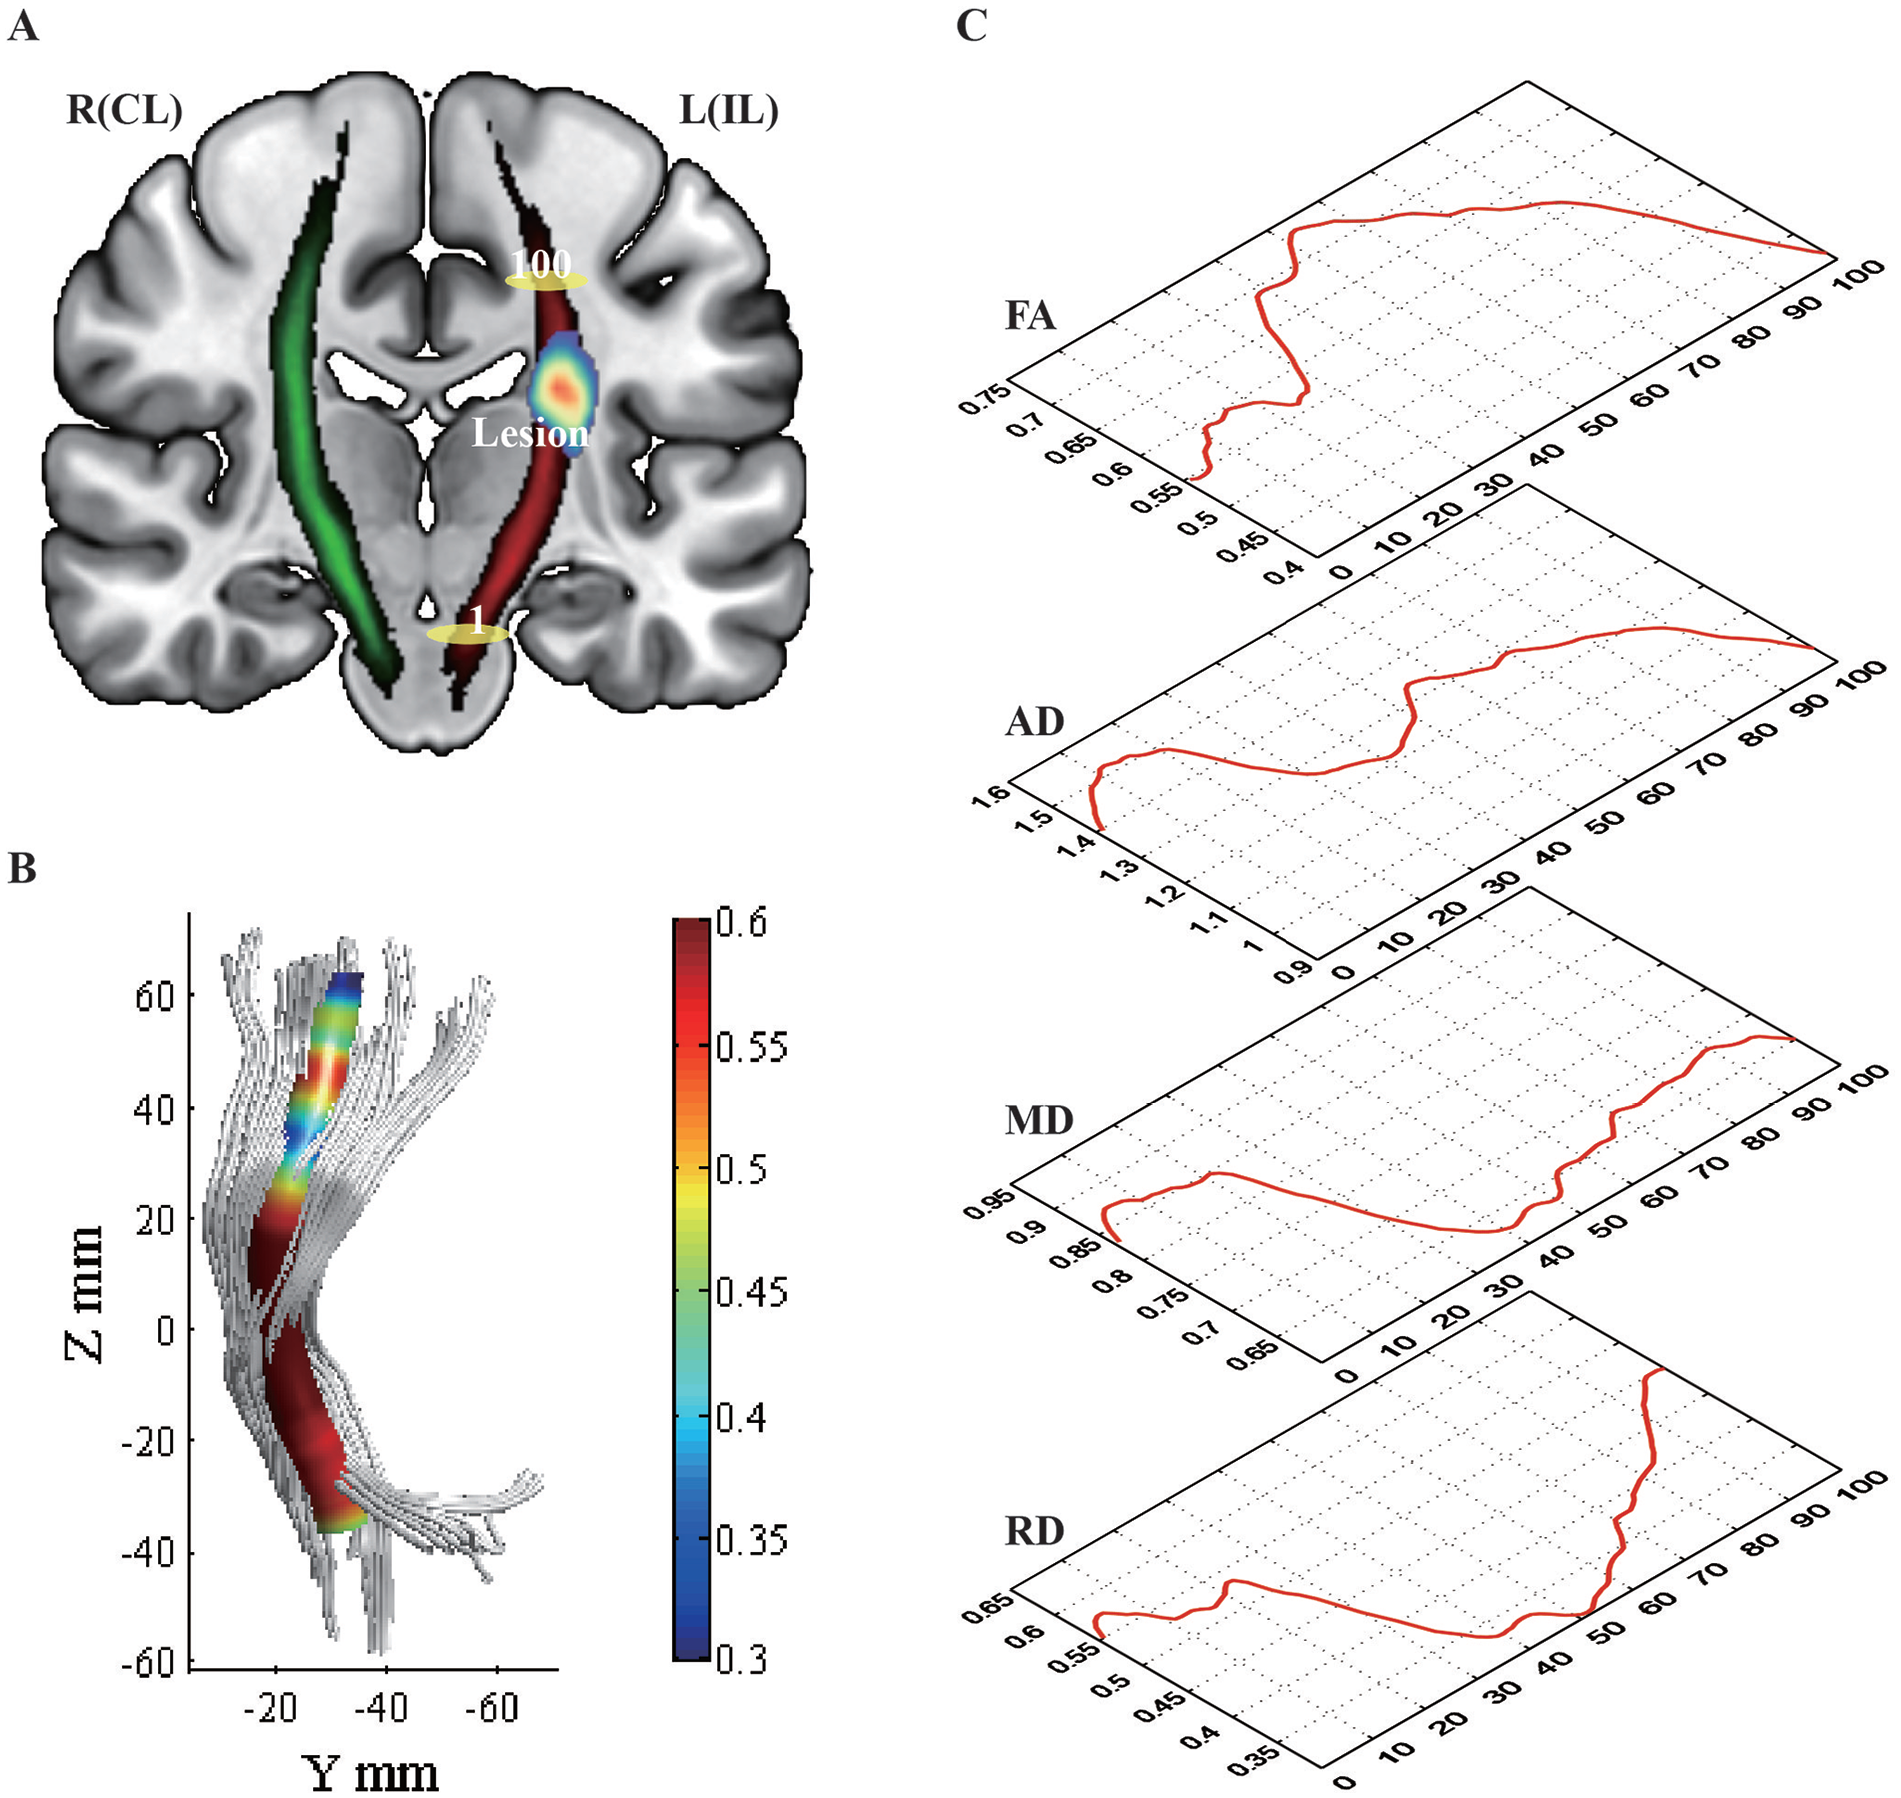
Schematic Diagram of the CST. (A) The left CST represents the ipsilesional side (red), and the right CST represents the contralesional side (green); the yellow ellipse marked with a “1” indicates the beginning of the CST segmentation located in the midbrain; the yellow ellipse marked with a “100” indicates the end of the CST segmentation located in the subcortex of the primary motor area. “Lesion” indicates the overlap of the lesion in 85% of the patients, and the redness of the core represents the concentration of the infarct site. (B) The corticospinal tracts were reconstructed according to the AFQ, and the color scale indicated the core of the tract. (C) The variation curves for FA, AD, MD, and RD at different segments are shown by red lines. The schematics for (B) and (C) used data of the HC group.
Laterality Index and Change Rate of Motor Function
The laterality index (LI) was calculated for each time point using the mean values of FA, AD, MD, and RD of the entire IL-CST and CL-CST. LI represents the asymmetry of the IL-CST and CL-CST and is calculated as:

The LI values range between −1 and 1, with zero values indicating bilateral symmetry, negative values indicating IL-CST dominance, and positive values indicating CL-CST dominance.
Based on the calculation of the LI, the change rate of motor function (CR-MF) was calculated as:
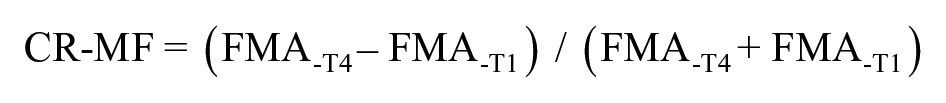
This formula can help remove the “ceiling effect” of the Fugl-Meyer motor assessment and compensate for the effect of the patient’s baseline values.
Statistical Analysis
The demographic characteristics, including age, sex, lesion location, and FMA score, were described or analyzed using SPSS version 26.0. Comparisons between different groups were performed using the t-test or Kruskal–Wallis H test for continuous variables and χ2 test or Fisher’s exact test for categorical variables with a significance level of 0.05.
The CST characteristics (FA, AD, MD, and RD) of the different groups were compared point-wise using the Randomize command in the functional MRI of the Brain Software Library. Different group comparison matrices were designed based on the general linear models, with 5000 permutations, family-wise error (FWE) correction using the threshold-free cluster enhancement with a significance level of P < .05, and only significant differences observed at 5 or more adjacent segments were reported. A 2-sample independent t-test was used to compare the differences between the patient and control groups; a repeated measures analysis of variance (ANOVA) was used to observe the dynamic changes in the bilateral CST during the rehabilitation process; and a paired t-test was used to compare the differences between the LIs at the 4-time points. Pearson correlation or Spearman correlation was used to analyze the relationship between the baseline LI and motor function. A 2-tailed significance test with a significance level of .05 was performed.
Of the 25 patients included in this study, all completed the first 2 assessments, 22 completed the third assessment, and 23 completed the fourth assessment. For missing data for the third and fourth assessments, we performed multiple imputations using R version 4.2.0 with the loading of mice package version 3.14.0.19,20
Results
Clinical Characteristics
There were no significant differences between the patient and HC groups related to age, sex, body mass index, and vascular risk factors. Most patients (80.0%) were male, with mainly mild-to-moderate stroke (NIHSS: 5.5 ± 3.4, range: 0-13),21,22 and enrollment time was in the subacute phase within 1 month of stroke (19.3 ± 3.7 days). The ischemic stroke lesions were mainly located in the basal ganglia region, approximately in the mid-upper 60 to 80 segmental portion of the CST. There was no significant difference between the left and right lesional sides (P = .78), suggesting that there was no difference in the laterality of the dominant hemisphere in the patient and HC groups. Motor function improved significantly after rehabilitation (Table 1, Figure 1).
Demographic and Clinical Characteristics.
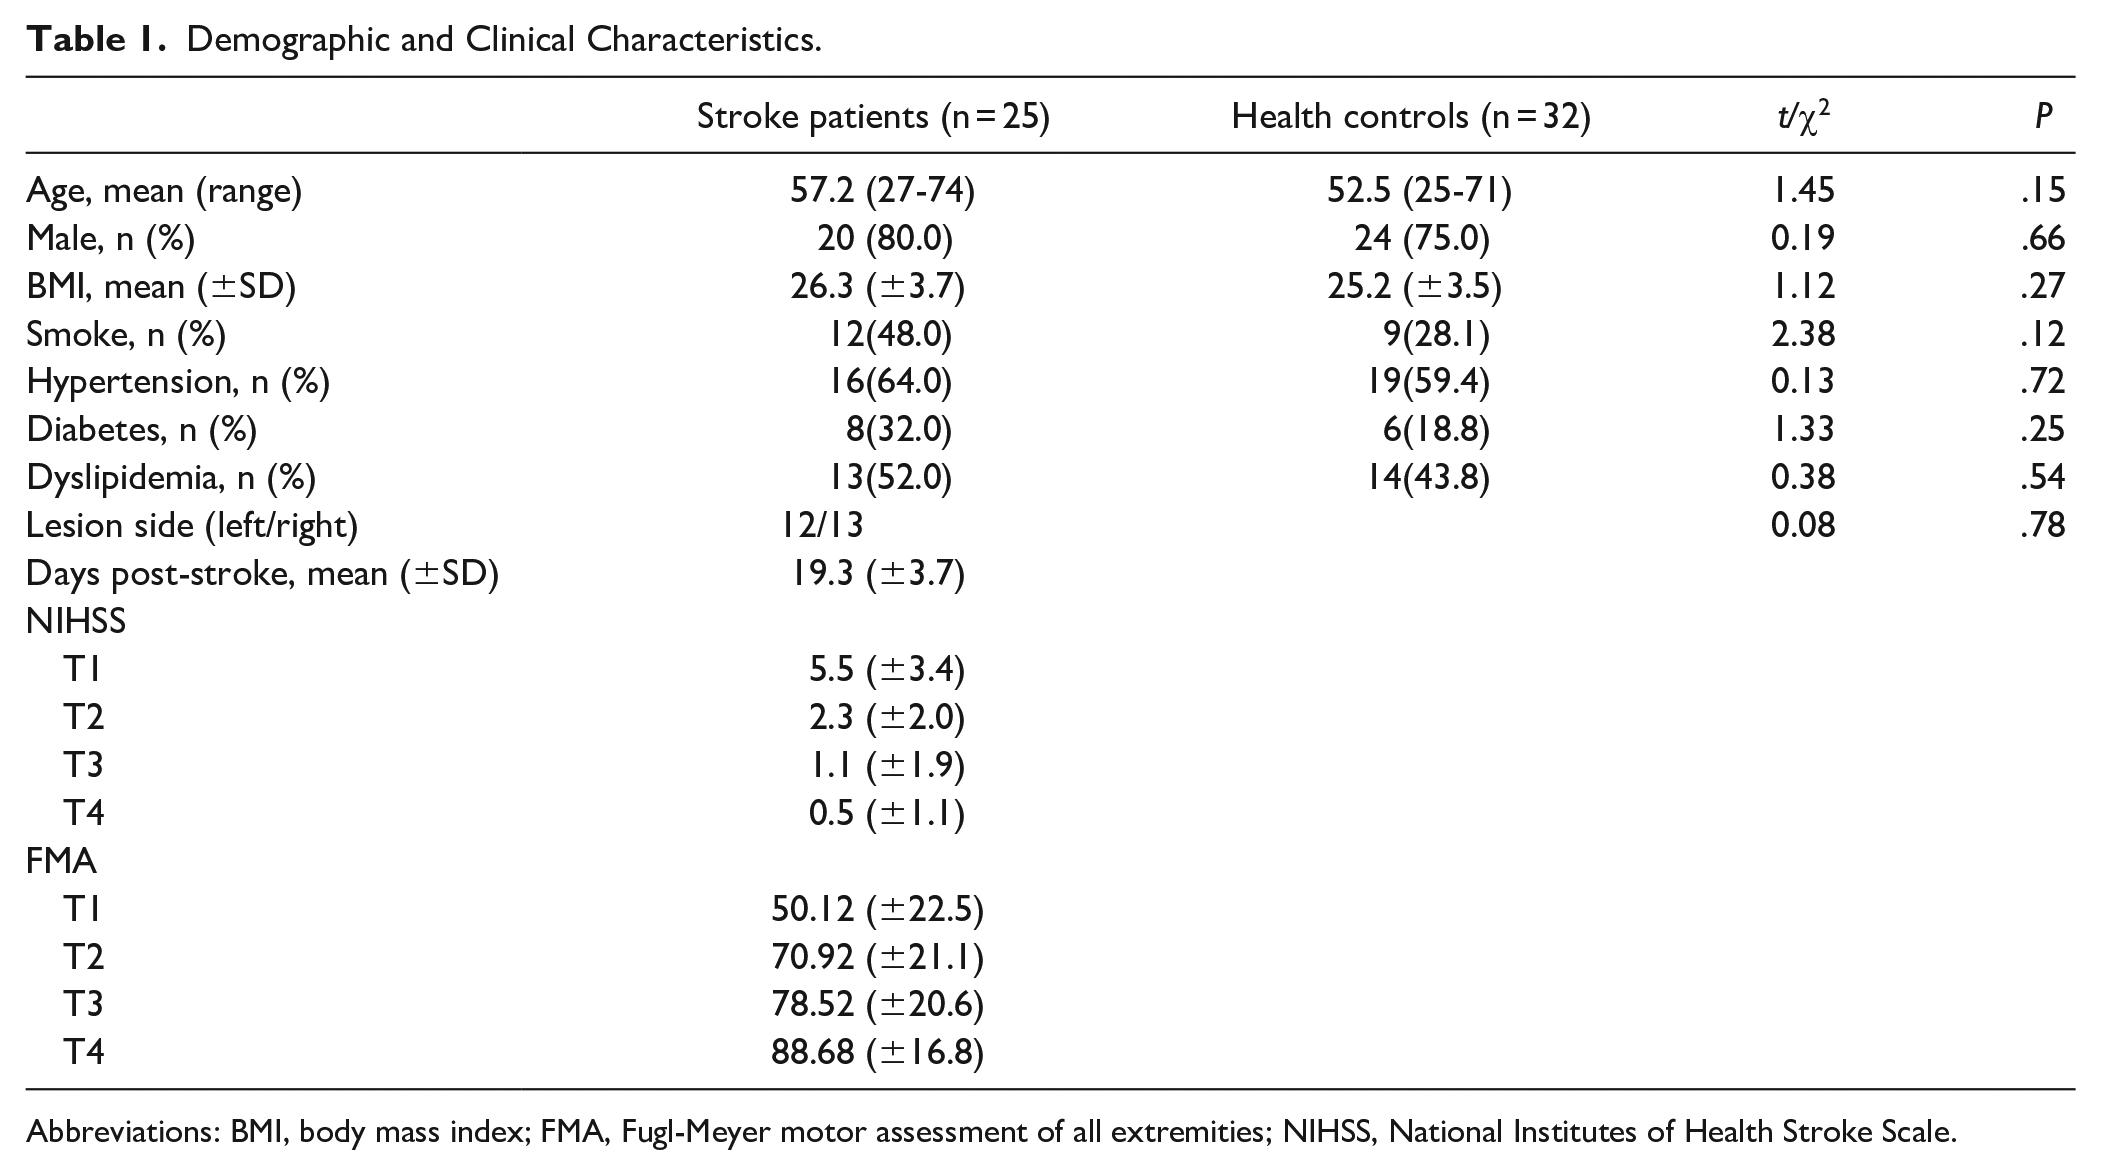
Abbreviations: BMI, body mass index; FMA, Fugl-Meyer motor assessment of all extremities; NIHSS, National Institutes of Health Stroke Scale.
Comparison of IL-CST and HC Groups
The FA values were lower for the entire IL-CST than the normal CST at each time point (P < .001, FWE correction) (Figure 2).
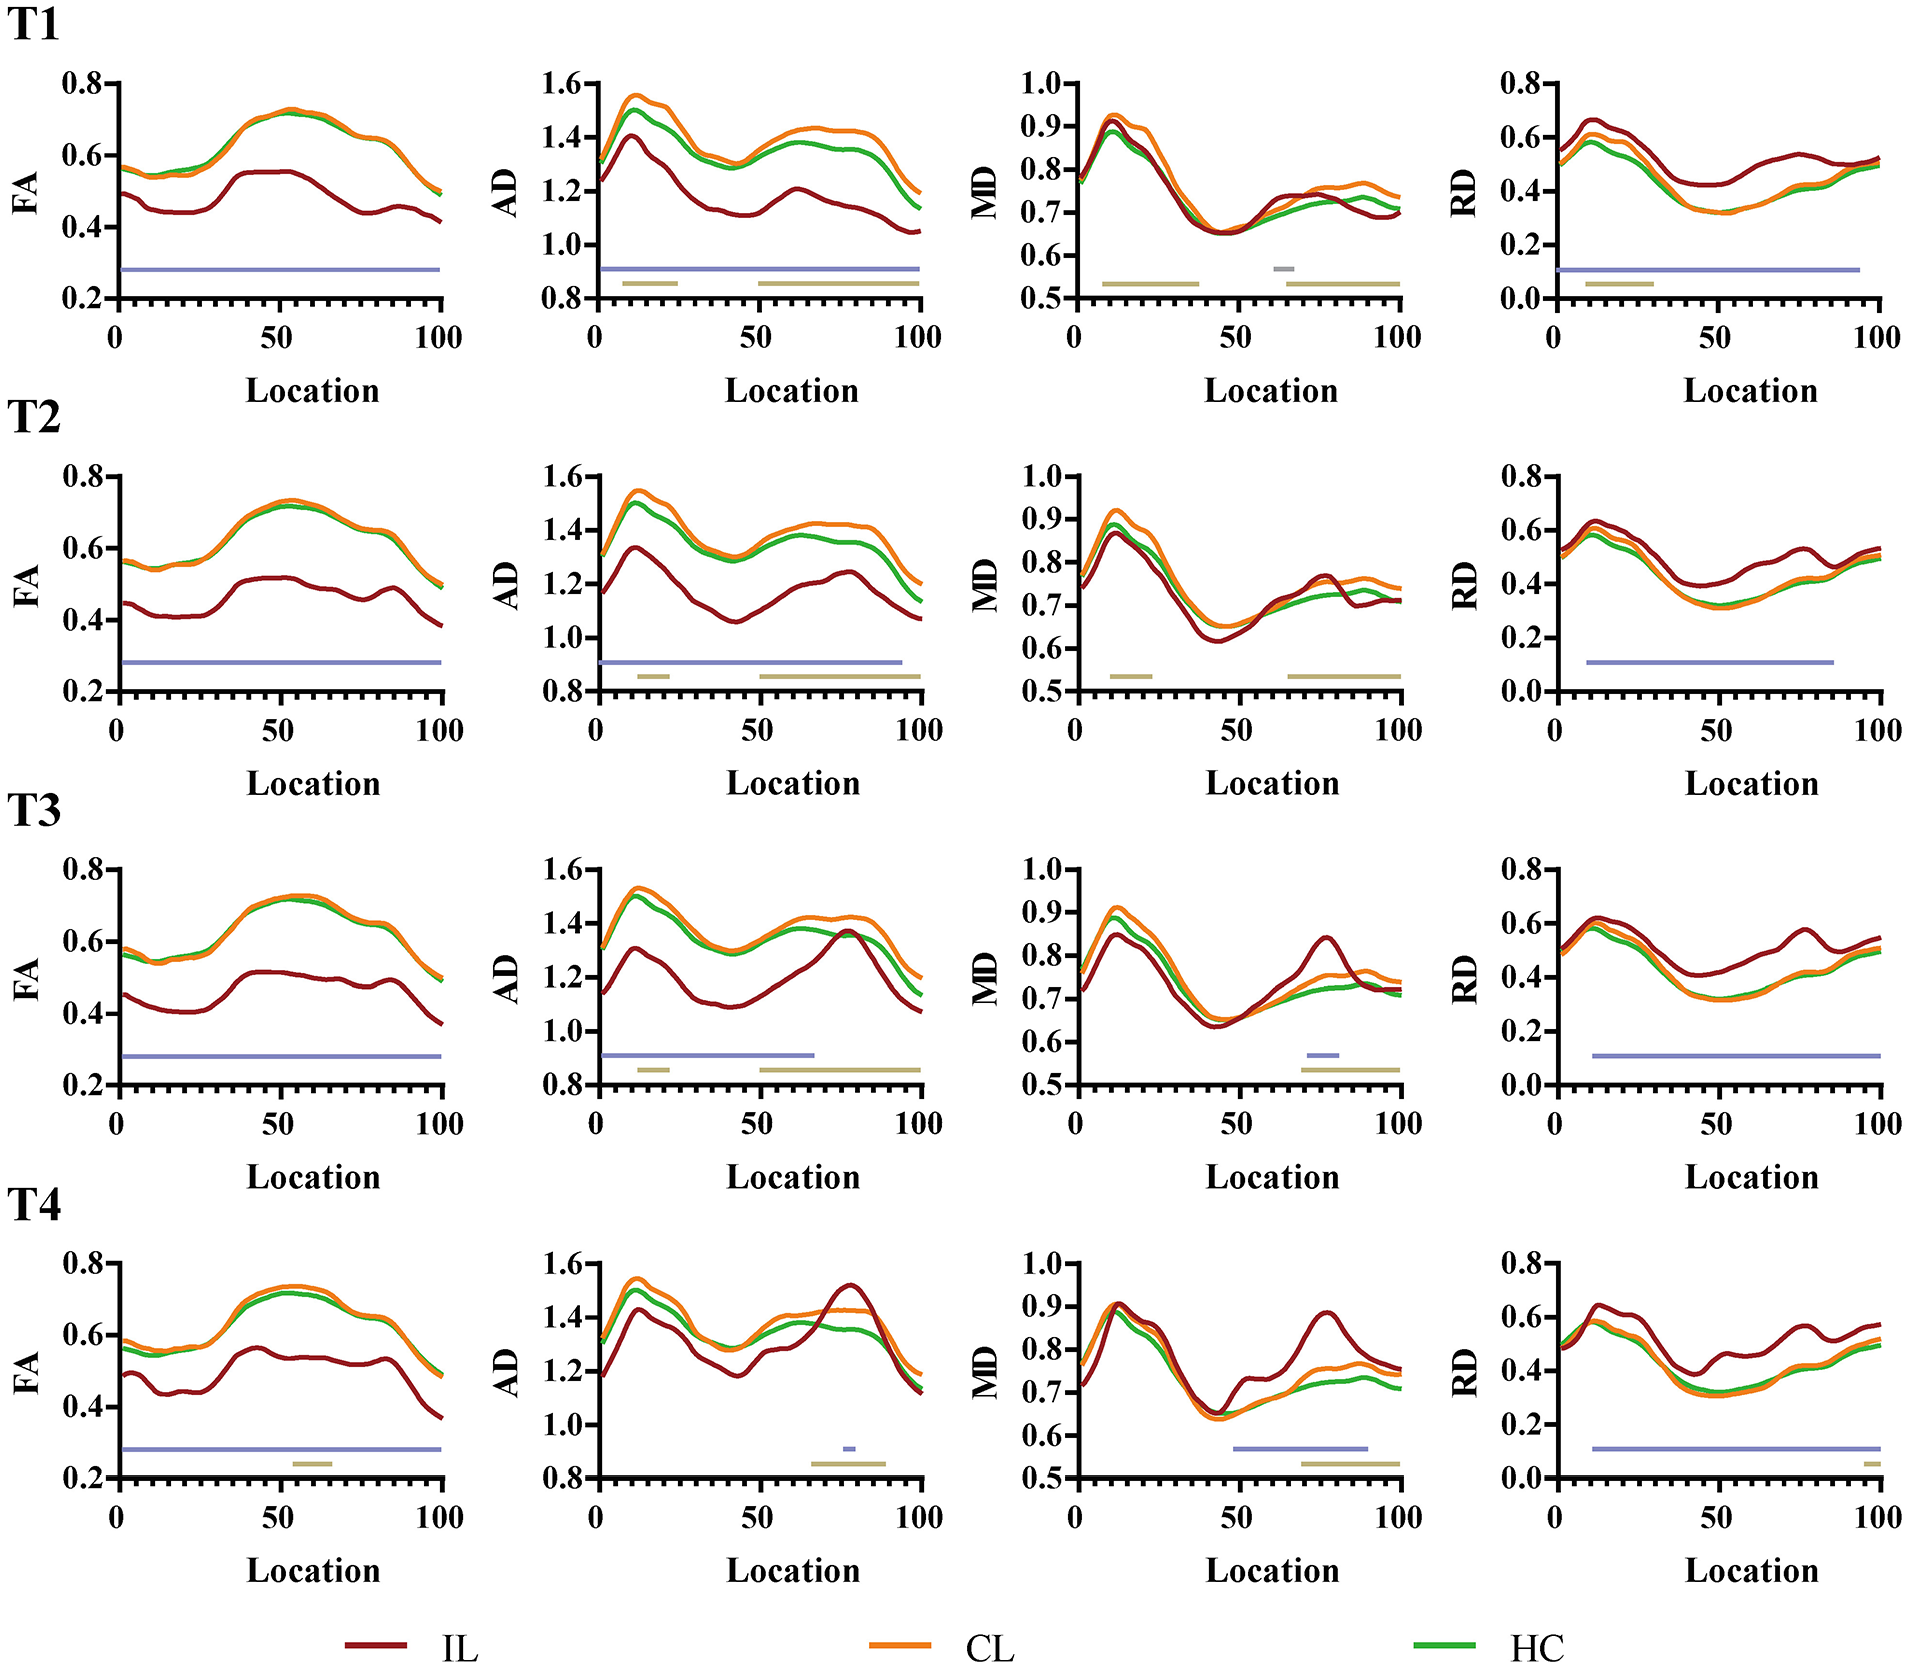
Pointwise comparison between the patients (IL-CST, CL-CST) and HC groups at each time point. The red curve represents IL-CST, the orange curve represents CL-CST, and the green curve represents the normal CST. Two straight lines indicate statistically different segments, the upper light blue line represents the results of the comparison of IL-CST and the normal CST, and the lower golden line indicates the results of the comparison of CL-CST and normal CST.
For the first 3 time points, the AD values of the IL-CST were lower than those of the normal CST (T1, all segments; T2, 1-95; T3, 1-67); at T4, the AD values of a small portion of the mid-upper IL-CST were higher than those of the normal CST (76-80, P < .05, FWE correction).
The MD values were higher for some segments than for the normal CST at all time points (T1, 61-66; T3, 71-78; T4, 48-90; P < .05, FWE correction), except T2, where there was no statistical difference between the 2.
The RD values were higher for most segments of the IL-CST than for the normal CST at each time point (T1, 1-95; T2, 9-86; T3, 11-100; T4, 11-100; P < .001, FWE correction).
Repeated Measures ANOVA Results for the IL-CST
There were time-effect statistical differences in the FA values (31-43 and 73-85; P < .05, FWE correction). Multiple comparisons suggested statistical differences between the FA values at T1 and T2, T1 and T4, and T3 and T4; there were higher FA values for the middle and lower segments (33-40) at T1 than at T2, middle and upper segments (74-85) at T4 than at T1, and the middle and lower segments (1-48) at T4 than at T3. In addition, there were no statistical differences between T1 and T3, T2, and T3 (Figure 3).
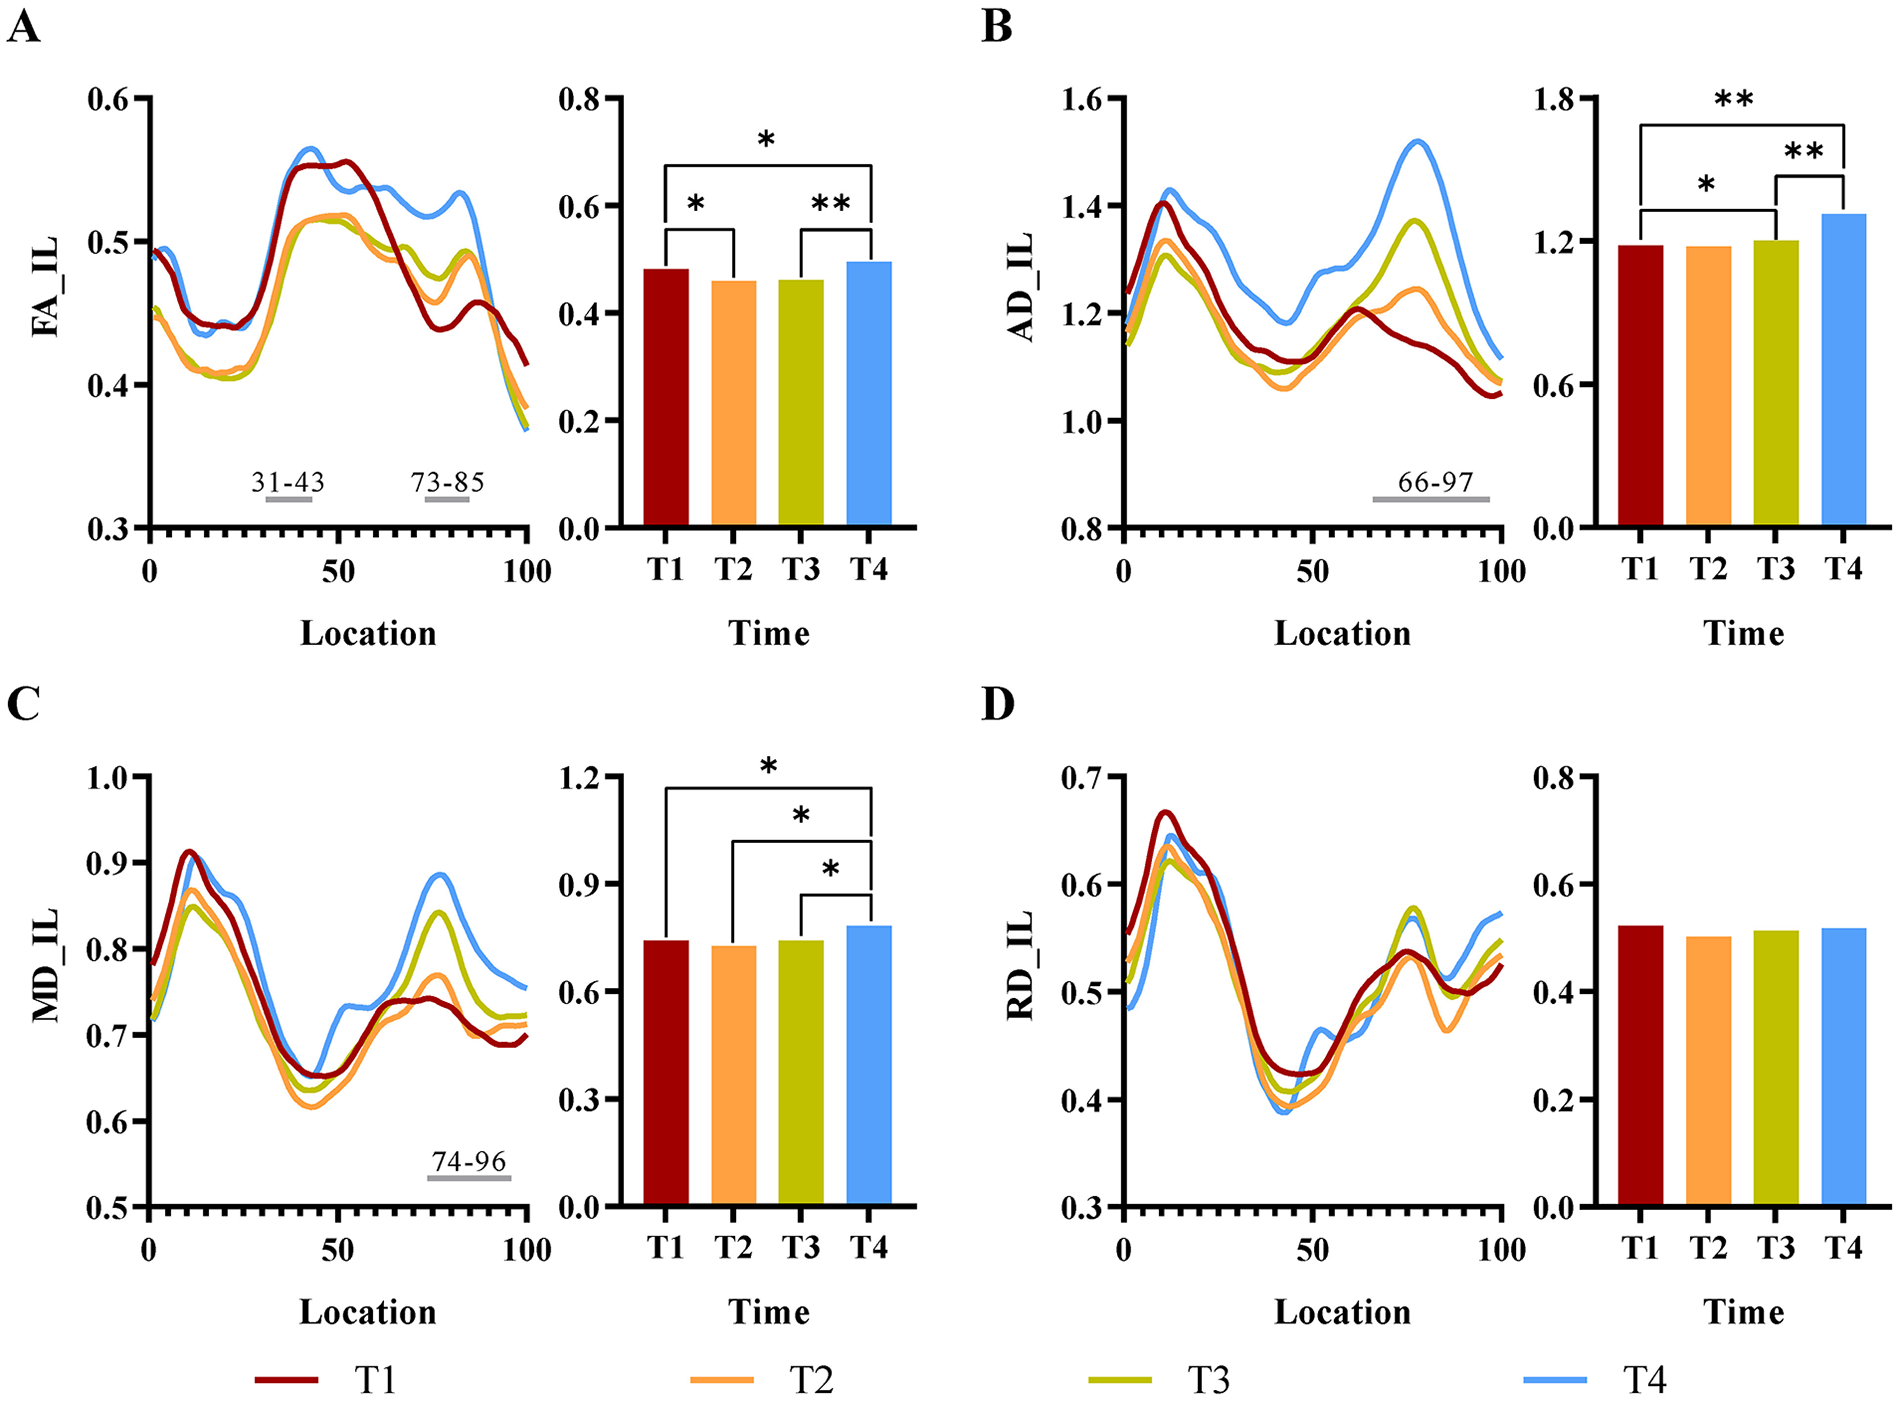
Repeated measures ANOVA results for the IL-CST. (A), (B), (C), and (D) show the results of the analyses of FA, AD, MD, and RD, respectively. Line graphs represent each segment of the CST at different time points, and bar graphs indicate the results of multiple comparisons between different time points. Red curves represent T1, orange curves represent T2, green curves represent T3, blue curves represent T4, and gray straight lines represent segments with statistical differences in time effects.
There were time-related statistical differences in the AD value (66-97; P < .01, FWE correction). Multiple comparisons showed statistical differences in the AD values at T1 and T3, T1 and T4, and T3 and T4, as demonstrated by higher AD values for the mid-upper segment at T3 (76-82) and T4 (67-97) than at T1 and the entire segment at T4 than at T3; in addition, there were no statistical differences between T1 and T2 and T2 and T3.
There were time-related statistical differences in the MD values (74-96; P < .01, FWE correction). The comparisons showed no statistical differences between the MD values at T1, T2, and T3, but there were statistical differences between the values at T4 and the other 3 time points (T1, 77-81 and 91-96; T2, 70-98; T3, 10-39, 47-58, and 66-100; P < .05, FWE correction). This showed that the MD values for the statistically different segments were higher at T4 than at the 3 other time points.
There were no time-related statistical differences between the RD values.
Results for the CL-CST
Comparison of the CL-CST and normal CST showed that parameter values for the statistically different segments were higher for the CL-CST group than for the HC group. The FA values were statistically different only for some mid-upper segments at T4 (54-66, P < .05, FWE correction); the AD and MD values were statistically different for most mid-upper segments at all time points; and the RD values were statistically different for only a few segments at T1 and T4 (Figure 2).
There were no statistically significant differences for the FA, AD, MD, and RD values of the CL-CST group based on the repeated measures ANOVA results (Supplemental Figure S1).
Results for the LI
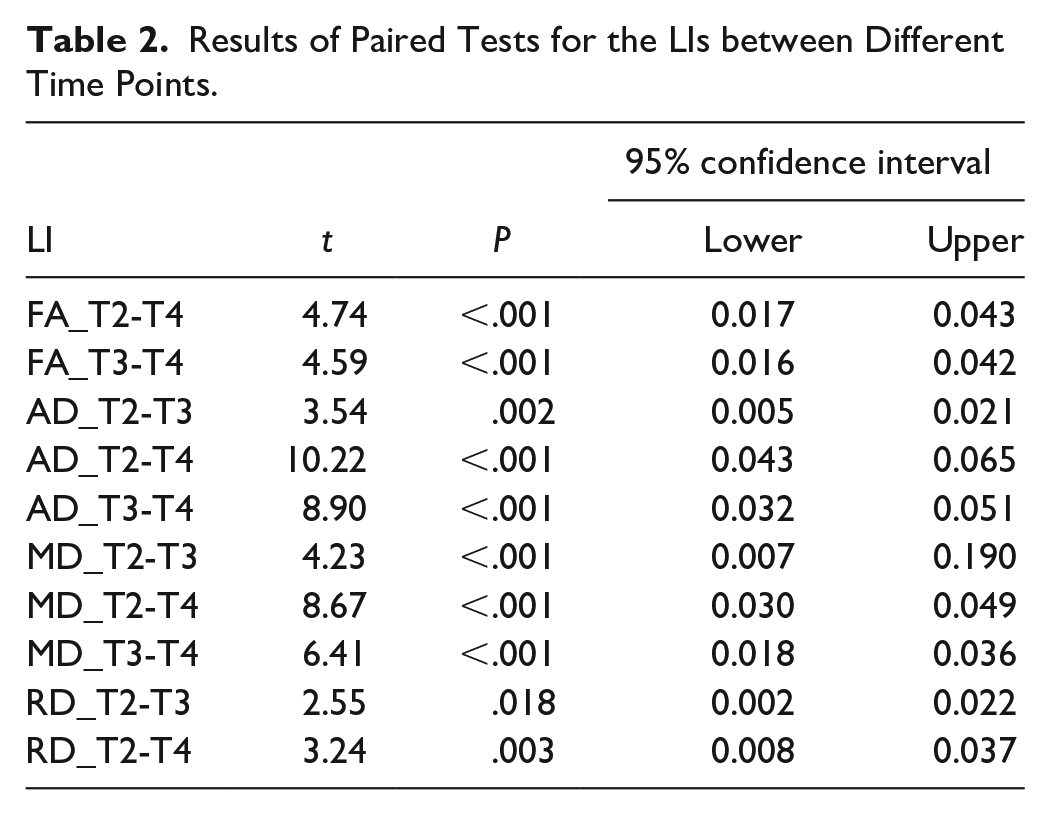
At each time point, the positive LIs for the FA, AD, and MD suggested that for these parameters, the CL-CST was dominant, while the opposite results were found for RD. Pairwise comparisons of the LIs between different time points showed the highest LI at T2, and no significant differences between T1 and T4 for each parameter, as shown in Table 2.
Results of Paired Tests for the LIs between Different Time Points.
The LI at T1 (LI-T1), representing the baseline, was correlated with the FMA score at T1 (FMA-T1) and the CR-MF. The results showed that the LI-T1 for the FA and AD were negatively correlated with FMA-T1 (r = −.667, P < .001; r = −.576, P = .003) and positively correlated with the CR-MF (r = .657, P < .001; r = .543, P = .005), suggesting that higher LI-T1 for FA and AD were associated with worse FMA-T1 and greater CR-MF after rehabilitation (Figure 4). The correlation analysis results of the LI-T1 for the MD and RD were not significant differences.
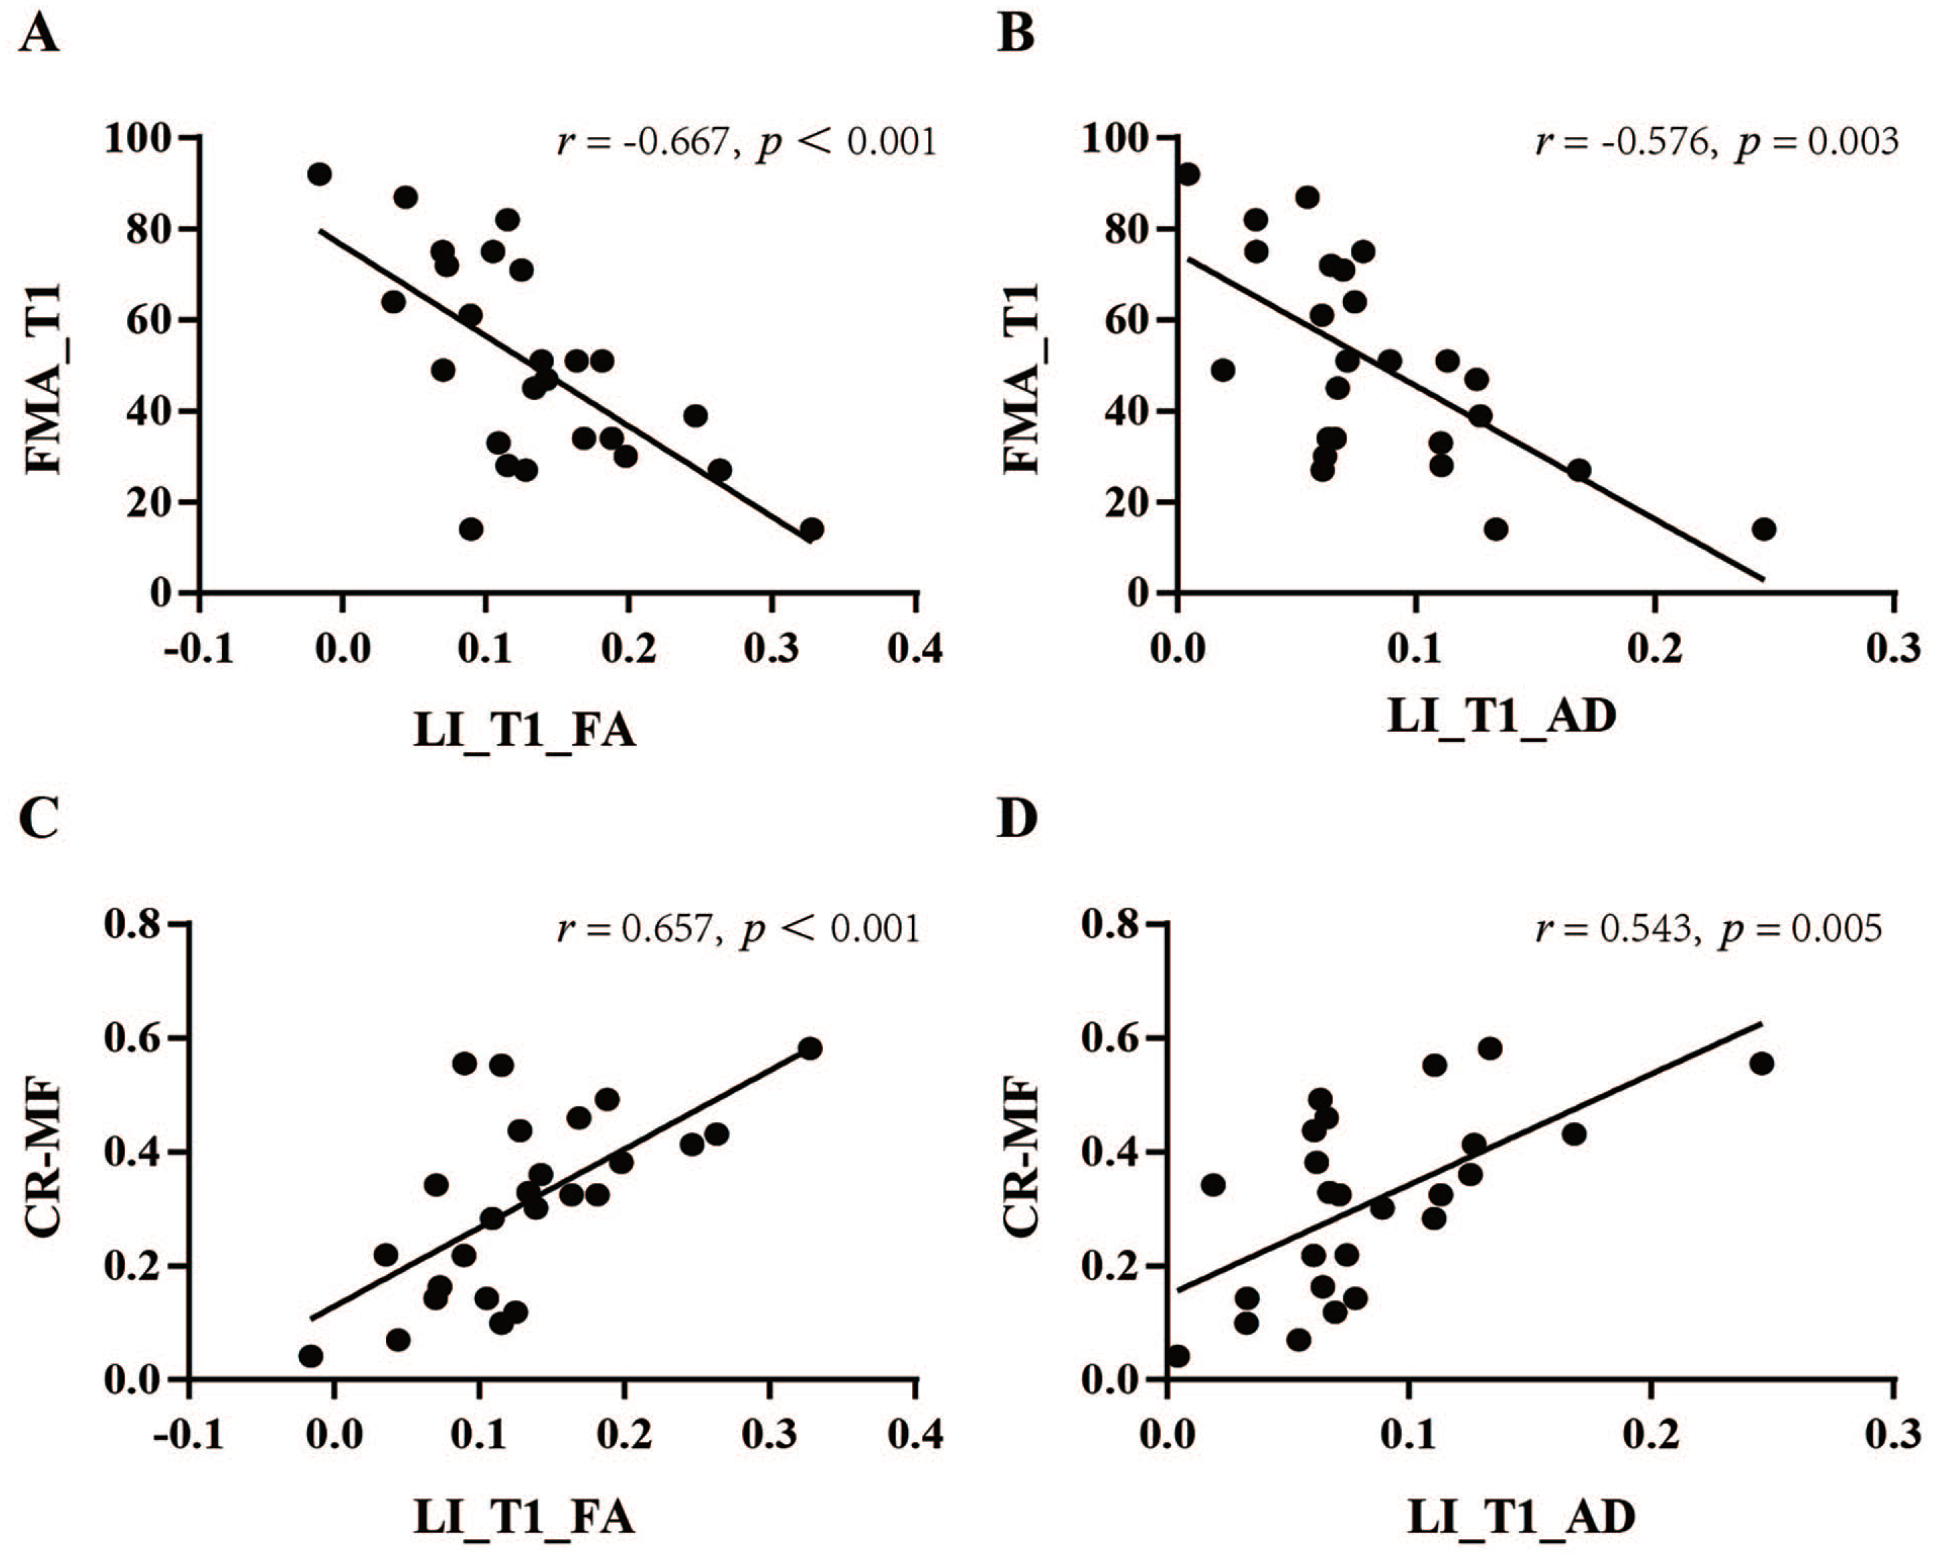
Correlation analysis of LI and motor function. (A) and (B) show the correlations between the LI-T1 values of FA and AD and FMA-T1, respectively. (C) and (D) show the correlations between the LI-T1 values of FA and AD and CR-MF, respectively. CR-MF indicates change rate of motor function; and LI, laterality index.
Discussion
In this study, we used a prospective longitudinal experimental design to analyze the structural plasticity of the CST during stroke rehabilitation. The IL-CST differed significantly from the normal CST at each time point and showed aggravation followed by improvement from around the lesion to the distal end. There were structural plastic changes and lateralization dominance in the CL-CST; the degree of lateralization was highest during the second month after the stroke onset, suggesting that CL-CST may play an important role in the recovery of motor function especially in the early stages of stroke. The LIs for the FA and AD may be substantial indicators for predicting recovery of motor function.
The degrees of damage to the segments of the IL-CST were not uniform. We found that FA values of the entire IL-CST were lower than the normal CST. However, the magnitudes of decrease in segments were not consistent; the 2 curves were not parallel, and reductions in FA and AD values were more pronounced in the mid-upper segment at T1, which is the lesion location in 85% of the enrolled patients, suggesting that proximity of the CST to the lesion was associated with more severe damage at the early stages of ischemic stroke. This is consistent with the pathophysiological mechanism of white matter Wallerian degeneration after stroke.23-25 Previous studies have found that both anterograde and retrograde Wallerian degeneration can occur in fiber bundles around ischemic stroke lesions, and DTI is a common method for evaluating Wallerian degeneration, with changes in FA and other parameter values reflecting white matter demyelination and axonal damage.26,27 Doughty et al 28 found a significant decrease in the FA values of the CST around the lesion 80 hours after the onset of ischemic stroke, while the FA values of the cerebral peduncles distal to the lesion did not change significantly. This suggested that Wallerian degeneration of the white matter around the lesion is most pronounced during the early stages, and it may take some time for Wallerian degeneration to progress distally.
The IL-CST showed dynamic changes during stroke recovery. In the present study, FA, AD, and MD differed significantly over time, and they showed similar trends of dynamic changes: at T1, the values for the mid-upper segments of the IL-CST (around the core lesions) were lowest; at T2 and T3, the values for the mid-lower segments of the IL-CST were lower than those at T1, while those for the mid-upper segments gradually increased; at T4, the values for almost the entire IL-CST increased relative to those of the previous ones. The multiple comparisons showed no significant differences between T2 and T3, but the line graph showed higher values in the mid-upper segments at T3 than that at T2. This observation suggests that damage to the IL-CST may reach a plateau stage between T2 and T3, while also exhibiting gradual recovery from around the lesion to the distal end. These findings may provide imaging evidence supporting the known pathophysiological process of proximal to distal nerve fiber repair. However, FA values of the entire IL-CST were significantly lower at T1 than those of the normal CST, which may be related to the effect of the ischemic lesion on fiber tracking. This highlights a holistic change in the IL-CST, and not a response to the Wallerian degeneration of the entire IL-CST at an early stage, and longitudinal observation may better reflect the dynamic changes of the IL-CST. Previous studies have also observed structural plasticity in the fasciculus during rehabilitation. Zhang et al 29 found the decrease and recovery of FA values in the internal capsule and centrum semiovale on the ipsilesional side in patients with pontine infarction. Therefore, structural plasticity exists in the IL-CST during stroke rehabilitation, and this process may comprise several pathological stages. There may be a gradual aggravation during the early stages and gradual recovery after reaching the plateau stage. The multi-temporal observation points are more likely to describe the dynamic pathological changes from the early to the chronic stages, which may help to develop more refined rehabilitation strategies.
Structural plasticity was also present in the CL-CST, and there was a lateralization dominance, with a significant correlation between the LI and motor function. Although CL-CST showed no significant dynamic changes over time, we found higher AD and MD values in most segments of the mid-upper CL-CST than the HC at each time point, suggesting that the CL-CST also undergoes structural changes after stroke. It has been found that there is structural remodeling of the CL-CST and a compensatory effect on motor function,30-33 and there may be a pattern of lateralization between the hemispheres bilaterally after stroke.34,35 In the present study, the IL-CST showed gradual worsening and recovery, while the motor function showed a gradual improvement, suggesting that other tissues besides the IL-CST support the improvement of motor function. We consider that motor function may be closely related to the balance of the interhemispheric CST, and early recovery of motor function may be related to the functional compensation of the CL-CST. As the IL-CST gradually improves, the degree of lateralization gradually decreases, and the control of motor function may gradually shift to the IL-CST. However, it should be recognized that the mechanism of brain plasticity during rehabilitation is complex, and several areas may be involved in the recovery of motor function. 36 Additionally, given that our enrolled patients mainly experienced mild-to-moderate strokes, caution is warranted in extrapolating LI results to those with severe strokes. It should be further noted that, based on the comparison results between the patients (IL-CST, CL-CST) and HC groups, the CL-CST dominance is primarily attributed to a significant decrease in parameter values of IL-CST rather than an increase in parameter values of CL-CST, especially for FA and AD. In general, the role of the CL-CST during the recovery of motor function, and its underlying mechanism needs to be further investigated in the future using a combination of electrophysiological techniques.
FA and AD may be more valuable for application. FA indicates the overall directionality of diffusion; MD indicates the overall magnitude of diffusion without directional properties; and AD and RD reflect the extent of diffusion parallel and perpendicular to fiber orientations, respectively. These have been used in previous related studies, but the variation characteristics are not fully congruent. Umarova et al 37 found that FA values of the ipsilesional fiber bundles significantly decreased 5 months after stroke compared with 1 week after stroke, whereas the AD, MD, and RD values increased significantly. Oey et al 38 found that FA and AD seemed to behave inversely to each other. We found that FA, AD, and MD values of the IL-CST showed a dynamic process of decreasing and then increasing over time, whereas there was no significant dynamic change in RD values. We considered that the differences in the results may be related to the duration, severity, lesion location, and diverse analysis methods for stroke. In addition, the application of FA is relatively more extensive. 39 In this study, we found that the AD and FA values were consistent, and both were significantly correlated with motor function, suggesting that these 2 indicators may be useful and potentially more effectively reflect the neuroplasticity of the CST during stroke rehabilitation.
Our study has limitations. First, we did not clarify the mechanism underlying injury repair in the segments from the lesion to the primary motor cortex. We cannot theoretically explain the retrograde Wallerian degeneration of the fiber tracts after stroke, which may be related to the proximity of the lesion to the primary motor cortex and the high number of crossed fibers in subcortex. Second, this is a single-center study involving a relatively small sample, unbalanced sex ratio, and the enrollment of patients with mainly mild-to-moderate stroke, which may limit generalizability of the findings, but the longitudinal design and good sample homogeneity can improve the reliability of the results. Furthermore, DTI is an indirect evaluation method for the CST, and various evaluation metrics can be affected by the surrounding tissues, instrumentation, and imaging parameters, and we should be cautious about the results of the study, which can be further verified from electrophysiological and pathological aspects in the future. Additionally, this study has a 5% rate of missing data. While this percentage ensures a relatively high quality of data through multiple imputations,40,41 it still cannot entirely eliminate the potential impact of missing data on the accuracy of time-dependent results. Further validation of the findings is necessary through future large-sample, high-quality studies.
To conclude, AFQ tractography can be used to observe the structural plastic changes of different segments of the CST; we adopted a longitudinal study design to investigate the dynamic changes in bilateral CST from subacute to chronic stages during stroke rehabilitation. This study provides an in-depth and comprehensive analysis of the structural plasticity changes of CST and provides a new perspective on the brain plasticity mechanism for stroke rehabilitation.
Supplemental Material
sj-docx-1-nnr-10.1177_15459683241249115 – Supplemental material for Exploring the Structural Plasticity Mechanism of Corticospinal Tract during Stroke Rehabilitation Based Automated Fiber Quantification Tractography
Supplemental material, sj-docx-1-nnr-10.1177_15459683241249115 for Exploring the Structural Plasticity Mechanism of Corticospinal Tract during Stroke Rehabilitation Based Automated Fiber Quantification Tractography by Haojie Zhang, Jun Zhao, Lingzhong Fan, Xia Wu, Fang Li, Jingya Liu, Chen Bai, Xingzhu Li, Bingjie Li and Tong Zhang in Neurorehabilitation and Neural Repair
Footnotes
Acknowledgements
We are grateful to our colleagues in neurorehabilitation and imaging departments for assistance with participant recruitment and data acquisition.
Author Contributions
Haojie Zhang: Data curation; Formal analysis; Investigation; Methodology; Resources; Software; Visualization; Writing—original draft; Writing—review & editing. Jun Zhao: Funding acquisition; Methodology; Resources; Supervision; Writing—review & editing. Lingzhong Fan: Formal analysis; Methodology; Software; Supervision; Visualization; Writing—review & editing. Xia Wu: Formal analysis; Methodology; Software; Validation; Visualization; Writing—original draft; Writing—review & editing. Fang Li: Data curation; Investigation; Resources; Validation; Writing—original draft. Jingya Liu: Data curation; Investigation; Resources; Validation; Writing—original draft; Writing—review & editing. Chen Bai: Data curation; Investigation; Resources; Validation; Writing—original draft; Writing—review & editing. Xingzhu Li: Data curation; Investigation; Resources; Validation; Writing—original draft; Writing—review & editing. Bingjie Li: Formal analysis; Methodology; Resources; Supervision; Validation; Writing—review & editing. Tong Zhang: Conceptualization; Formal analysis; Funding acquisition; Methodology; Project administration; Resources; Supervision; Validation; Writing—original draft; Writing—review & editing.
Declaration of Conflicting Interests
The author(s) declared no potential conflicts of interest with respect to the research, authorship, and/or publication of this article.
Funding
The author(s) disclosed receipt of the following financial support for the research, authorship, and/or publication of this article: The National Key Research and Development Program of China (No.2020YFC2007604); the Fundamental Research Funds for Central Public Welfare Research Institutes (No.2018CZ-2); and National Natural Science Foundation of China (No.61873135).
Statement of Data Availability
The data that support the findings of this study are available from the corresponding author upon reasonable request.
Supplementary material for this article is available on the Neurorehabilitation & Neural Repair website along with the online version of this article.
References
Supplementary Material
Please find the following supplemental material available below.
For Open Access articles published under a Creative Commons License, all supplemental material carries the same license as the article it is associated with.
For non-Open Access articles published, all supplemental material carries a non-exclusive license, and permission requests for re-use of supplemental material or any part of supplemental material shall be sent directly to the copyright owner as specified in the copyright notice associated with the article.