
Abstract
Background. Corticospinal tract (CST) damage is considered a biomarker for stroke recovery. Several methods have been used to define CST damage and examine its relationship to motor performance, but which method is most useful remains unclear. Proprioceptive impairment also affects stroke recovery and may be related to CST damage. Methods. Robotic assessment quantified upper-limb motor and proprioceptive performance at 2 weeks and 6 months poststroke (n = 149). Three previously-established CST lesion metrics were calculated using clinical neuroimaging. Diffusion magnetic resonance imaging quantified CST microstructure in a subset of participants (n = 21). Statistical region of interest (sROI) analysis identified lesion locations associated with motor and proprioceptive deficits. Results. CST lesion metrics were moderately correlated with motor scores at 2 weeks and 6 months poststroke. CST fractional anisotropy (FA) was correlated with motor scores at 1 month poststroke, but not at 6 months. The FA ratio of the posterior limb of the internal capsule was not correlated with motor performance. CST lesion metrics were moderately correlated with proprioceptive scores at 2 weeks and 6 months poststroke. sROI analysis confirmed that CST damage was associated with motor and proprioceptive deficits and additionally found that putamen, internal capsule, and corticopontocerebellar tract lesions were associated with poor motor performance. Conclusions. Across all methods used to quantify CST damage, correlations with motor or proprioceptive performance were moderate at best. Future research is needed to identify complementary or alternative biomarkers to address the complexity and heterogeneity of stroke recovery.
Keywords
Introduction
Stroke recovery is a complex process and researchers are actively investigating biomarkers to help prognosticate, guide clinical treatment decisions, and inform inclusion in clinical trials. 1 Corticospinal tract (CST) damage is considered a biomarker that predicts poor motor recovery. To date, several studies have defined CST damage on standard clinical imaging, using 1 of 3 methods (henceforth called CST lesion metrics): (1) Overlap, the proportion of lesioned voxels overlapping the CST 2 ; (2) Percentage injury, the percentage of CST overlapped by stroke lesion, accounting for its longitudinal nature3-5; or (3) Weighted lesion load, similar to (1) but assigns a higher weighting to CST damage at the internal capsule to account for the higher density of fibers.6,7 All 3 CST lesion metrics have individually demonstrated a relationship with poststroke motor impairment as measured by clinical scales. Our group was interested in contrasting these 3 CST lesion metrics and their relationship to motor impairment as measured by a robotic reaching assessment over the course of stroke recovery.
To date, lesion metric studies have used observer-based scales to measure motor impairment. CST overlap has been linked to motor function measured with the Action Research Arm Test (ARAT).2,8 CST percentage injury3,5 and weighted lesion load6,7 have been linked to motor impairment measured with the upper-extremity Fugl-Meyer (FM). 9 The ARAT has a floor effect, 10 and the FM has a ceiling effect 11 ; both these effects can affect the strength of observed relationships. As an alternative to clinical scales, robotic measures can be used to monitor upper-extremity motor impairment. Robotic measures use continuous scales, are sensitive to both spatial and temporal components of movement, and are not prone to observer bias.12,13 Whereas a measure such as the FM can capture a person’s ability to move in and out of synergy patterns, a robotic reaching task captures additional elements of motor control, including reaction time, feedforward control, and corrective movements. Robotic measures have been shown to be significantly correlated with clinical scales12-14; however, the relationship between robotically quantified motor performance and CST lesion metrics has not been evaluated.
Diffusion magnetic resonance imaging (MRI) has also been used to examine the relationship between CST microstructure and motor performance. Lower fractional anisotropy (FA) in the CST (CST-FA)4,15-20 or specifically in the posterior limb of the internal capsule (PLIC-FA)5,15,21 has been associated with motor impairment poststroke. It is not clear how CST-FA or PLIC-FA, which are not typically collected in standard clinical scans, relate to the CST lesion metrics defined using clinical imaging.
Beyond the CST, several brain regions are likely important for poststroke motor function. Lower FA in pathways arising from the premotor or supplementary motor cortices3,21 as well as corticofugal tracts 15 have been associated with poorer motor performance after stroke. Lesion analyses have identified that damage to the premotor, motor, and sensory cortices 22 and a region of the corona radiata overlapping the corticopontocerebellar tract 23 are all associated with motor impairment. These studies provide support that brain regions beyond the CST are important for motor function, which is overlooked when solely computing CST metrics.
Motor and proprioceptive impairments have often been reported to co-occur poststroke.24-26 However, with careful assessment, these impairments can be dissociated.13,27 This complex relationship between motor and sensory performance may be partly explained by the extensive interconnectivity between the primary motor and primary sensory cortices 28 and CST connections from the primary somatosensory cortex to the dorsal horn. 29 Given the potential importance of the CST proper in sensory function and the fact that proprioceptive deficits have been linked to decreased independence in activities of daily living,30,31 our group was motivated to investigate the correlation between CST lesions and proprioception after stroke.
The goal of this study was to evaluate neuroimaging biomarkers poststroke. We investigated 4 aims with a large, longitudinal study using robotic assessments of motor and proprioceptive performance. First, we examined the relationship between CST damage (defined using existing lesion metrics) and motor impairments assessed at 2 weeks and at 6 months poststroke. This analysis compared 3 CST lesion metrics, addressing the question of whether one was more correlated with motor performance. Second, we examined the relationship between the 3 lesion metrics and diffusion MRI in a subset of participants. Third, we examined the impact of CST damage on poststroke proprioceptive performance. Fourth, we evaluated brain regions beyond the CST that were important for poststroke motor and proprioceptive performance using a method that was not reliant on a priori hypotheses (statistical region of interest [sROI] analysis).
Methods
Participants
Participants with stroke were recruited while inpatients on the acute stroke or stroke rehabilitation units at Foothills Medical Centre or the Dr Vernon Fanning Care Centre in Calgary, Alberta, Canada. They had 2 robotic and clinical assessments (approximately 2 weeks poststroke [time point 1, TP1] and approximately 6 months poststroke [time point 2, TP2]). Inclusion criteria for the present study were as follows: first-time clinically evident, unilateral stroke, English speaking, able to follow 2-step commands, and vision 20/50 or better. Exclusion criteria were as follows: brainstem or cerebellar lesions, preexisting neurological conditions, upper-extremity orthopedic injuries, evidence of apraxia, 32 and/or no well-defined lesion on neuroimaging. This study was approved by the University of Calgary Conjoint Health Research Ethics Board, and all participants provided written informed consent.
Robotic Assessment
A KINARM exoskeleton robot (BKIN Technologies Ltd, Kingston, ON, Canada) evaluated upper-extremity motor control 12 and position sense. 33 These tasks and their individual parameters have been described previously in detail.12,13,33,34
Robotic Assessment of Motor Control
The visually guided reaching (VGR) task assessed motor control using an 8-target, center-out paradigm (Figures 1A and 1B). Participants were instructed to reach “as quickly and accurately as possible” to targets 10 cm away from the center. Each participant completed 8 blocks of trials with targets randomized within a block. This task measures 11 spatial and temporal aspects of reaching performance that have been described previously in detail12,35 and are also described in the online supplement.
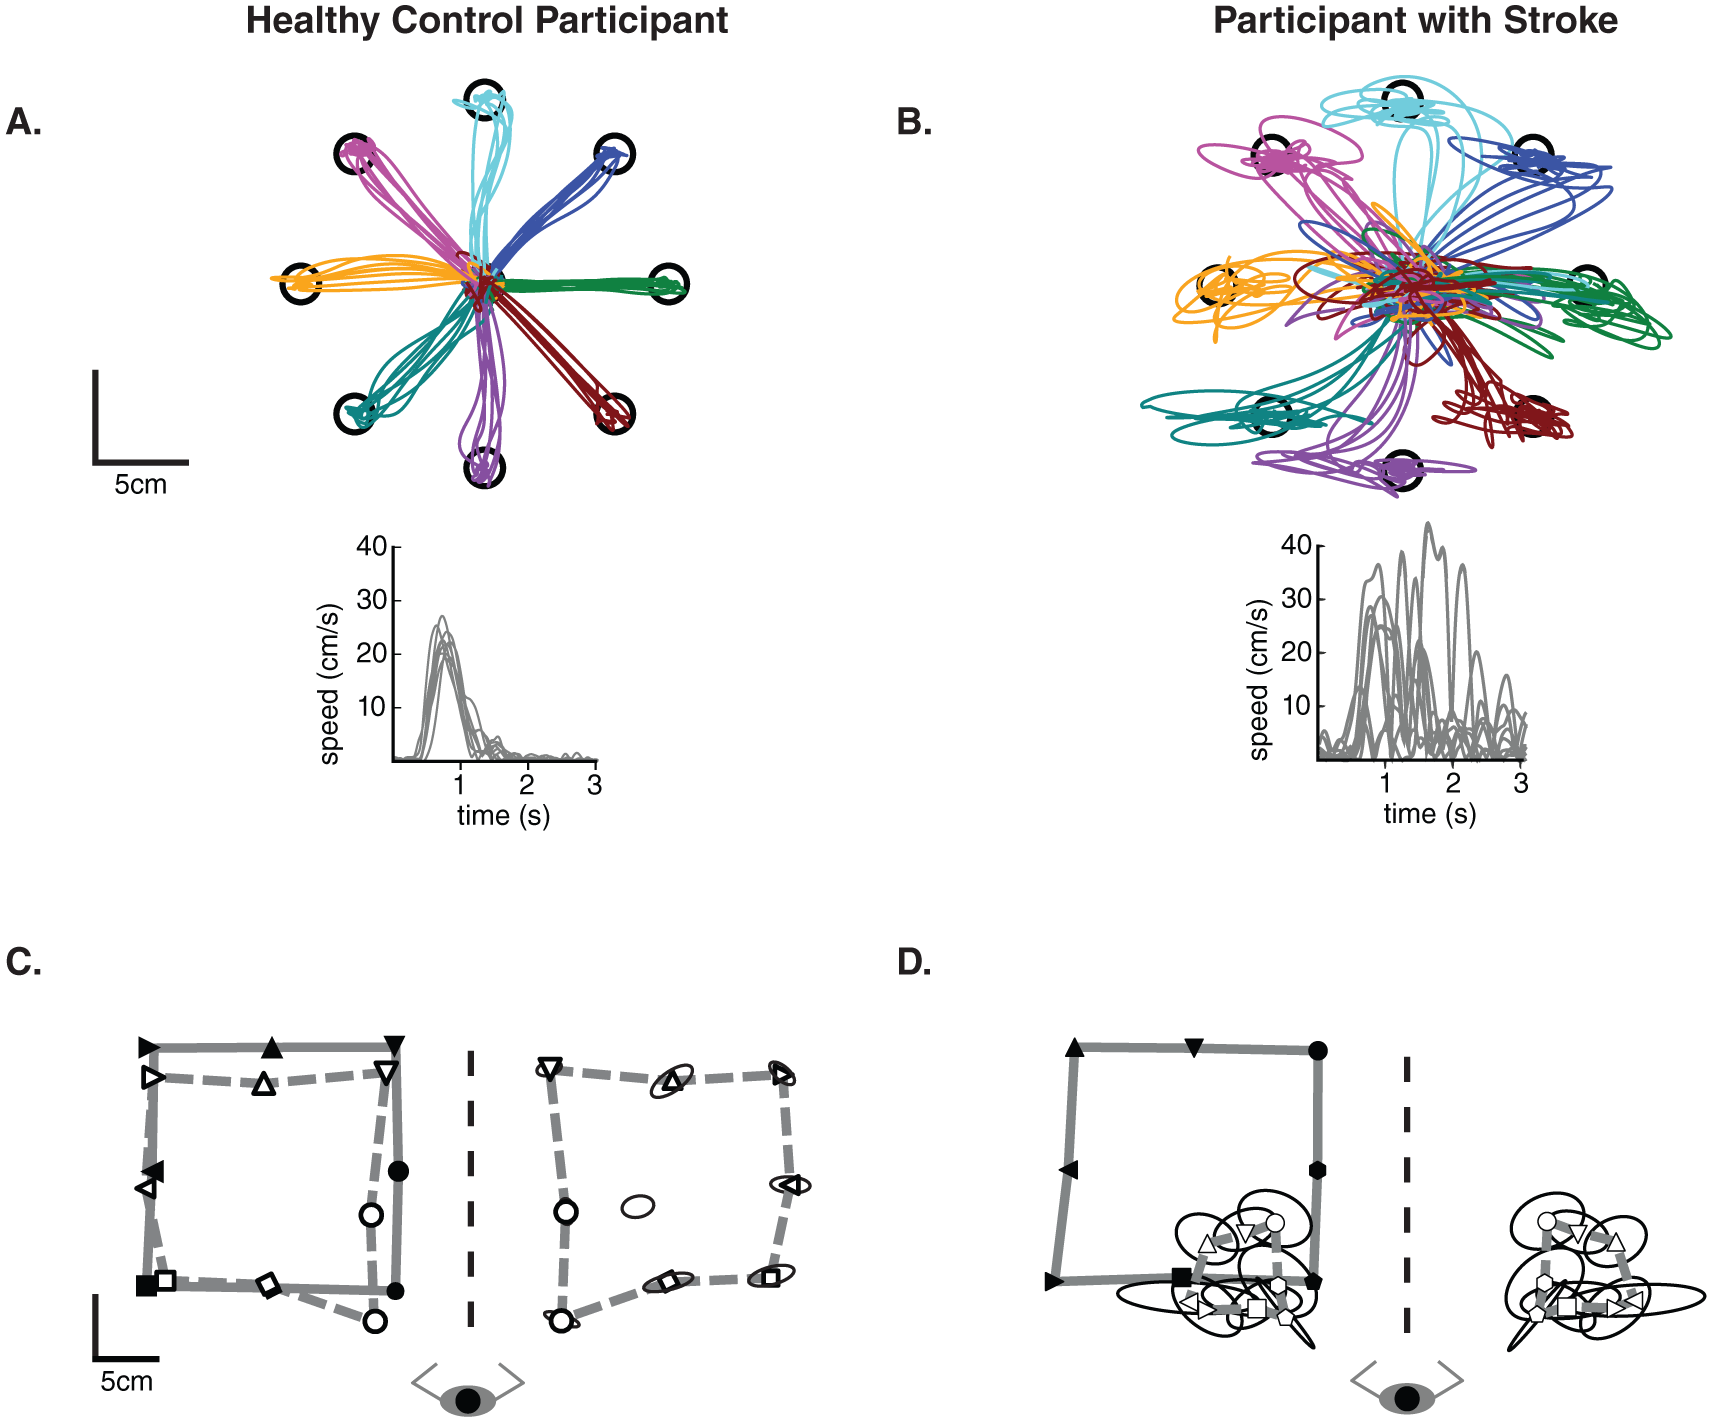
Exemplar data from a healthy participant and a stroke participant for the visually guided reaching (A and B) and the position matching (C and D) tasks. For A and B, data for the right arm of the control participant and the right (affected) arm of the participant with stroke are shown. Temporal data corresponding to the bottom center target are displayed. For C and D, the solid line joins the outer 8 targets (filled symbols) that the passive left arm was moved to by the robot. The dashed line connects the outer 8 targets that the participant actively matched to (open symbols) with their right arm. The data from the matching arm has been mirror transformed onto the passive movement for visual comparison. Trial to trial variability is represented by ellipses at each target—ellipses represent 1 SD.
Robotic Assessment of Proprioception
The position matching (PM) task assessed the ability to sense the position of the arm. With vision of the arms occluded, the robot moved the stroke-affected arm to 1 of 9 spatial locations (Figures 1C and 1D). The participant mirror-matched the location with their opposite (less-affected) arm. Each participant completed 6 randomized blocks of 9 trials for a total of 54 trials. This task measures 3 spatial aspects of position sense that have been described previously13,33,36,37 and in the online supplement.
Robotic Task Score Calculation From Normative Data
Overall task scores were calculated from the parameters of the tasks above to provide a global measure of performance on the VGR and PM tasks (see online supplement for details). Task scores are based on SD units, where values near 0 reflect best performance and larger values reflect poorer performance (ie, 1 = 68.4 percentile of healthy control performance). Task scores >1.96 are defined as abnormal performance (performance worse than 95% of healthy controls).
Clinical Assessment
Participants completed an assessment battery that included the following: (1) strength: shoulder abductors and finger extensors were quantified using the Medical Research Council Scale of 0 to 5 (0 = no muscle activation, 5 = muscle activation against examiner’s full resistance) 38 ; (2) visuospatial neglect: a score of 129 or less on The Behavioural Inattention Test 39 was consistent with visuospatial neglect; (3) spasticity: The Modified Ashworth Scale was used (0 = normal muscle tone, 4 = contracture) to measure spasticity in the elbow flexors 40 ; (4) motor impairment: The Chedoke McMaster Stroke Assessment Impairment Inventory of the Arm was used (0 = flaccid arm, 7 = normal movement) 41 ; (5) dexterity: the Purdue Pegboard was used as a measure of dexterity 42 ; (6) position sense: the Thumb Localizer Test (0 = normal, 3 = most impaired) 43 ; and (7) activities of daily living: the Functional Independence Measure (FIM) was used (maximum score is 126). 44
Imaging Acquisition
Clinical imaging (computed tomography [CT] or MRI) was acquired as soon as possible after stroke onset in accordance with the acute stroke protocol at the Foothills Medical Centre in Calgary, Alberta, Canada. In cases where subsequent imaging was available, we utilized the scan with the date closest to the robotic assessment. MRIs were acquired using a 3-T or 1.5-T General Electric, or a 1.5-T Siemen scanner. CT scans were acquired on a Siemens system or 1 of 3 General Electric scanners. These clinical imaging scans were used for the CST lesion metric analysis and the sROI analysis.
In a subset of individuals, T1-weighted and diffusion sequences were collected 1 month and 6 months poststroke using the 3-T MRI. The diffusion sequence was collected using 90 directions, a b value of 1000 s mm−2 and 9 volumes with a b value of zero.
Lesion Delineation
Lesions were manually defined on each axial slice of a participant’s T2-weighted FLAIR or CT using MRIcron (https://www.nitrc.org/projects/mricron). Lesion masks were verified by a stroke neurologist (ASAS) who was blinded to task performance. The masks were then normalized to the Montreal Neurological Institute (MNI) template using the clinical toolbox (https://www.nitrc.org/projects/clinicaltbx/) 45 in SPM12 (https://www.fil.ion.ucl.ac.uk/spm/software/spm12). Lesions in MNI and native space were compared to ensure accuracy. Consistent with previous studies, left-hemisphere lesion masks were mirrored across the midsagittal axis. 46 Normalized lesions were used to calculate lesion volume and the subsequent CST metric evaluations.
CST Lesion Metrics
Three CST lesion metrics quantified the CST damage. For each metric, the CST template and lesion masks were in MNI space.
Overlap
In accordance with previous studies,2,8 we identified the region of overlap between a stroke lesion and CST template. 47 The number of voxels in the region of overlap were calculated and divided by the total number of voxels in the template to calculate the proportion of overlapping voxels.
Percentage Injury
This method has been described previously.3-5 A CST template derived from probabilistic tractography was divided into 16 longitudinal sections to model the trajectory of axon bundles. The lesion mask was overlaid on the CST template, and if more than 5% of the longitudinal section overlapped the lesion, it was classified as injured. The number of injured longitudinal sections were summed. This sum was divided by 16 and multiplied by 100 to calculate the percentage injury to the CST.
Weighted Lesion Load
This method has been adapted from previous studies.6,7 The weighted lesion load was calculated by identifying the overlap between the CST template and the lesion on each slice. This overlapping area was then weighted to account for the narrowing of the CST in the region of the internal capsule by multiplying the overlap by the ratio of maximum cross-sectional area of the CST template to the cross-sectional area of the CST template on that slice. This was done for each axial slice in the image and summed across slices to determine the total weighted lesion load.
Fractional Anisotropy in the CST and the PLIC
Preprocessing to correct for motion, eddy currents, and field inhomogeneities was conducted using the FMRIB Software Library (https://fsl.fmrib.ox.ac.uk). Bedpostx and Probtrackx tools were used to define the CST using a probabilistic tractography approach, as described previously, 35 and detailed in the online supplement. Briefly, subject-specific primary motor cortex (M1) and pontine CST masks were used as the seed and waypoint, respectively. M1 masks were derived from the Harvard-Oxford Cortical Structural Atlas and transformed to each individual’s diffusion space. An example waypoint mask is shown in Supplemental Figure 1. FA was averaged across all voxels in a participant’s CST (CST-FA). The CST-FA data for 19 of these individuals has been presented in another article 35 but is included here as a comparison with a previous study. 5
PLIC masks were drawn on 3 continuous slices on the participant’s FA maps, as described previously.5,15,48 When a lesion affected the PLIC, the contralesional side was used as a guide. Mean FA values were calculated from the voxels in the PLIC masks for the ipsilesional and contralesional hemispheres. The ratio of ipsilesional to contralesional PLIC-FA was then calculated. This measure was calculated to provide a comparison with a previous study. 5
Statistical Region of Interest Analysis
We performed a sROI 37 to investigate regions beyond the CST associated with impaired robotic task performance. Using NiiStat (https://www.nitrc.org/projects/niistat/), 150 regions were defined by combining the Automatic Labelling Atlas 49 and the Neuroanatomy and Tractography Laboratory atlases (https://www.natbrainlab.co.uk). 50 In regions where a minimum of 10% of individuals had damage, the proportion of damage to the ROI was calculated per individual and input to a general linear model. At the group level, the model determined whether damage to a region was significantly associated with poorer reaching or PM scores. This resulted in a z-score per region. The data were permuted 4000 times to control for family-wise error and determine a significance threshold of P <.05. 51
Statistical Analysis
Correlations examined the relationships among CST lesion metrics, between individual metrics and motor or proprioceptive performance, and between FA of the CST and PLIC. Pearson correlations were used in all cases, except those examining the percentage injury metric and ordinal clinical scales where Spearman correlations were used. In the text, the strength of correlations is described similar to that in Dancey and Reidy, 52 such that an r of 0.1 to 0.3 is weak, 0.31 to 0.6 is moderate, and 0.61 to 0.9 is strong. Bonferroni correction for multiple comparisons was used (adjusted P <.006 unless otherwise specified). Comparisons between correlation coefficients of the 3 different lesion metrics were performed using a method originally described by Meng et al, 53 which ultimately yields a χ2 statistic. The significance level for all analyses was P <.05. All statistical analyses were performed using MATLAB 2014b (Mathworks, Natick, MA).
Results
Participant Characteristics
We evaluated motor and proprioceptive performance with robotic and clinical assessments within 2 weeks of stroke (TP1; mean 11.5 ± 9 days) and again at 6 months (TP2; mean 170.9 ± 41 days) poststroke in 149 participants. Clinical imaging was collected within 2.8(±4) days of stroke onset. Diffusion imaging was collected at 1 month (28 ± 11 days) and 6 months (189 ± 24 days) poststroke in a subset of 21 individuals. Participant characteristics and clinical scores are presented in Table 1.
Demographics.
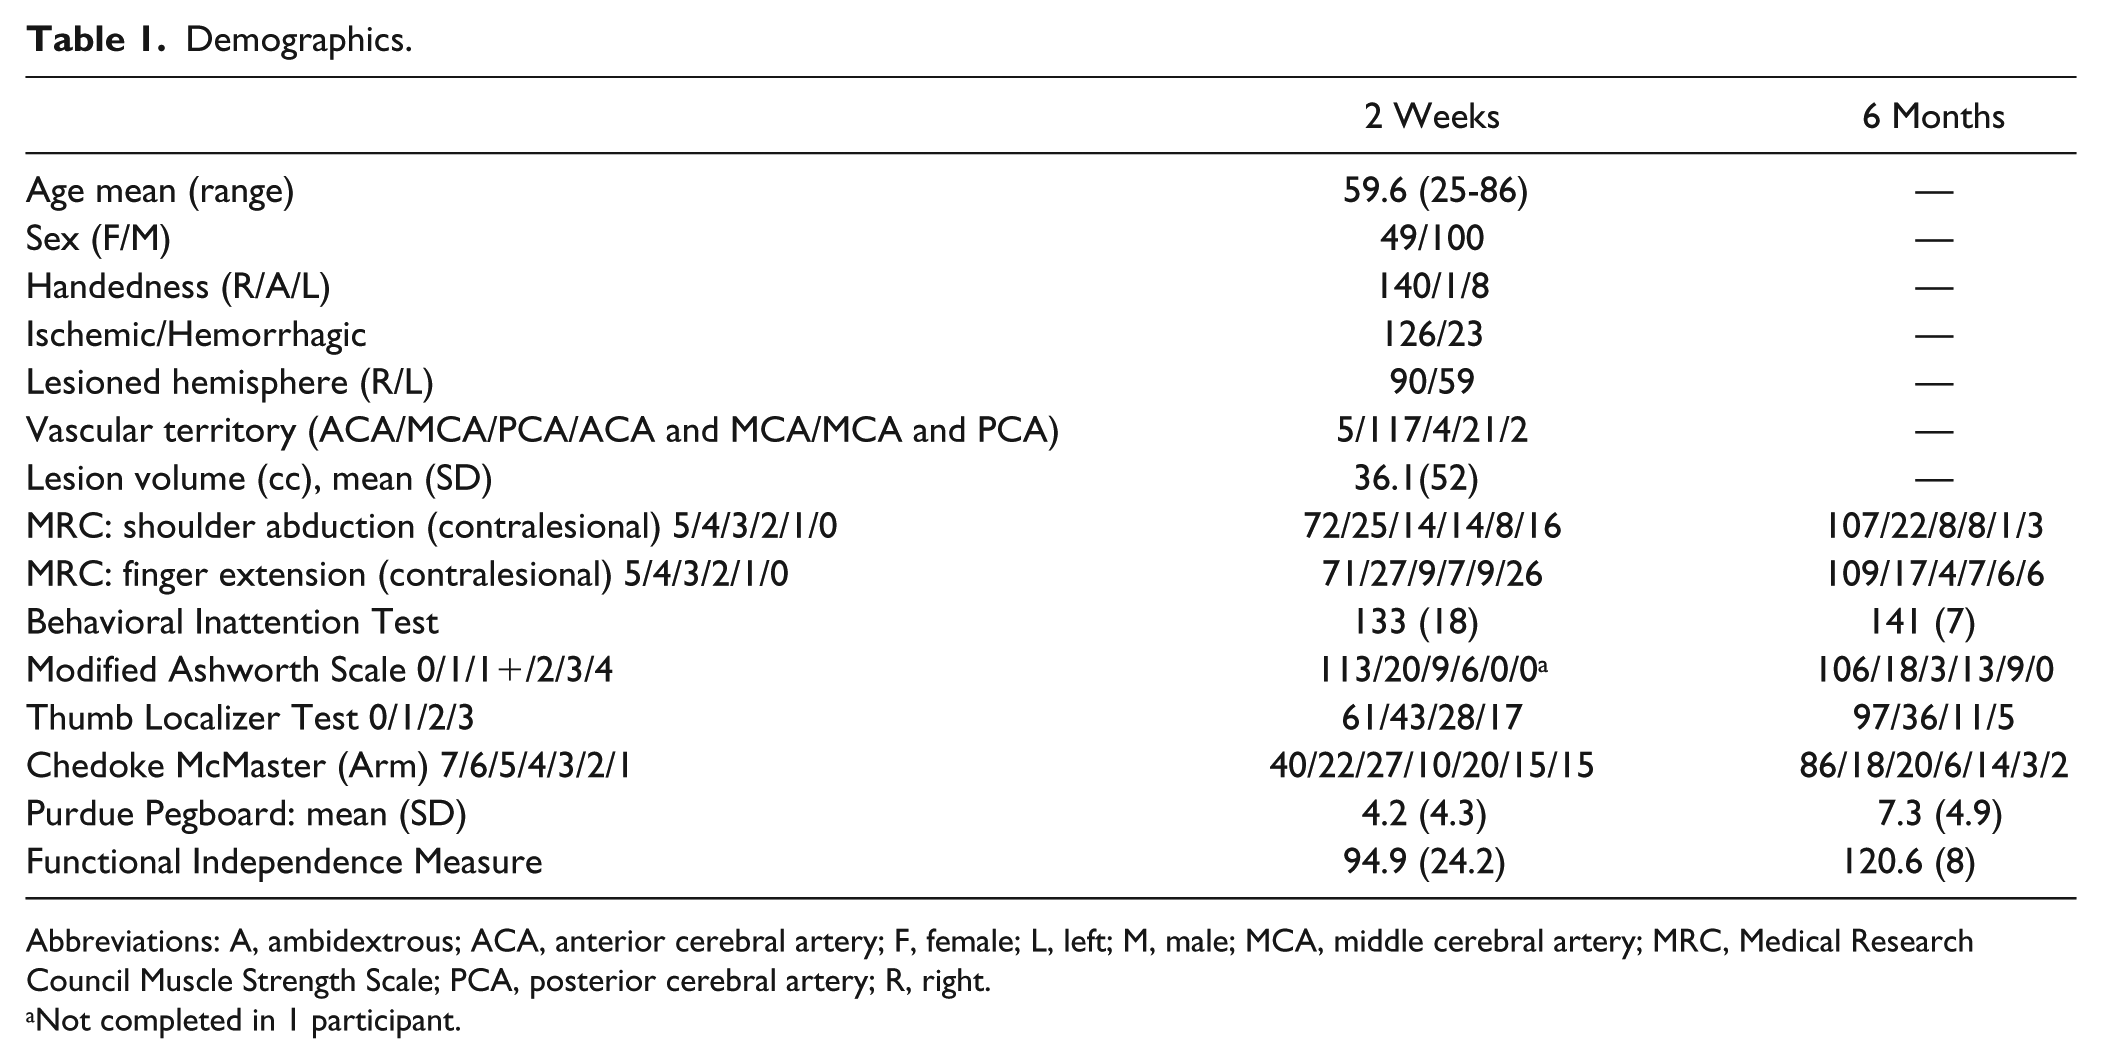
Abbreviations: A, ambidextrous; ACA, anterior cerebral artery; F, female; L, left; M, male; MCA, middle cerebral artery; MRC, Medical Research Council Muscle Strength Scale; PCA, posterior cerebral artery; R, right.
Not completed in 1 participant.
CST Lesion Metric Analysis and Motor Performance
The 3 lesion metrics were strongly correlated with one another. CST overlap was correlated with percentage injury (r = 0.72; P = 7.2 × 10⁻²⁵) and weighted lesion load (r = 0.91; P = 2.5 × 10−57). Percentage injury was correlated with weighted lesion load (r = 0.78; P = 9.5 × 10⁻³²).
Next, the relationships between each of the 3 CST lesion metrics and VGR task scores were examined. Individual lesion metrics were moderately correlated with motor scores at TP1 (correlation coefficients and P values are presented in Figure 2). Each lesion metric was moderately correlated with motor scores at TP2 and weakly or moderately correlated with the delta score (Figure 2).
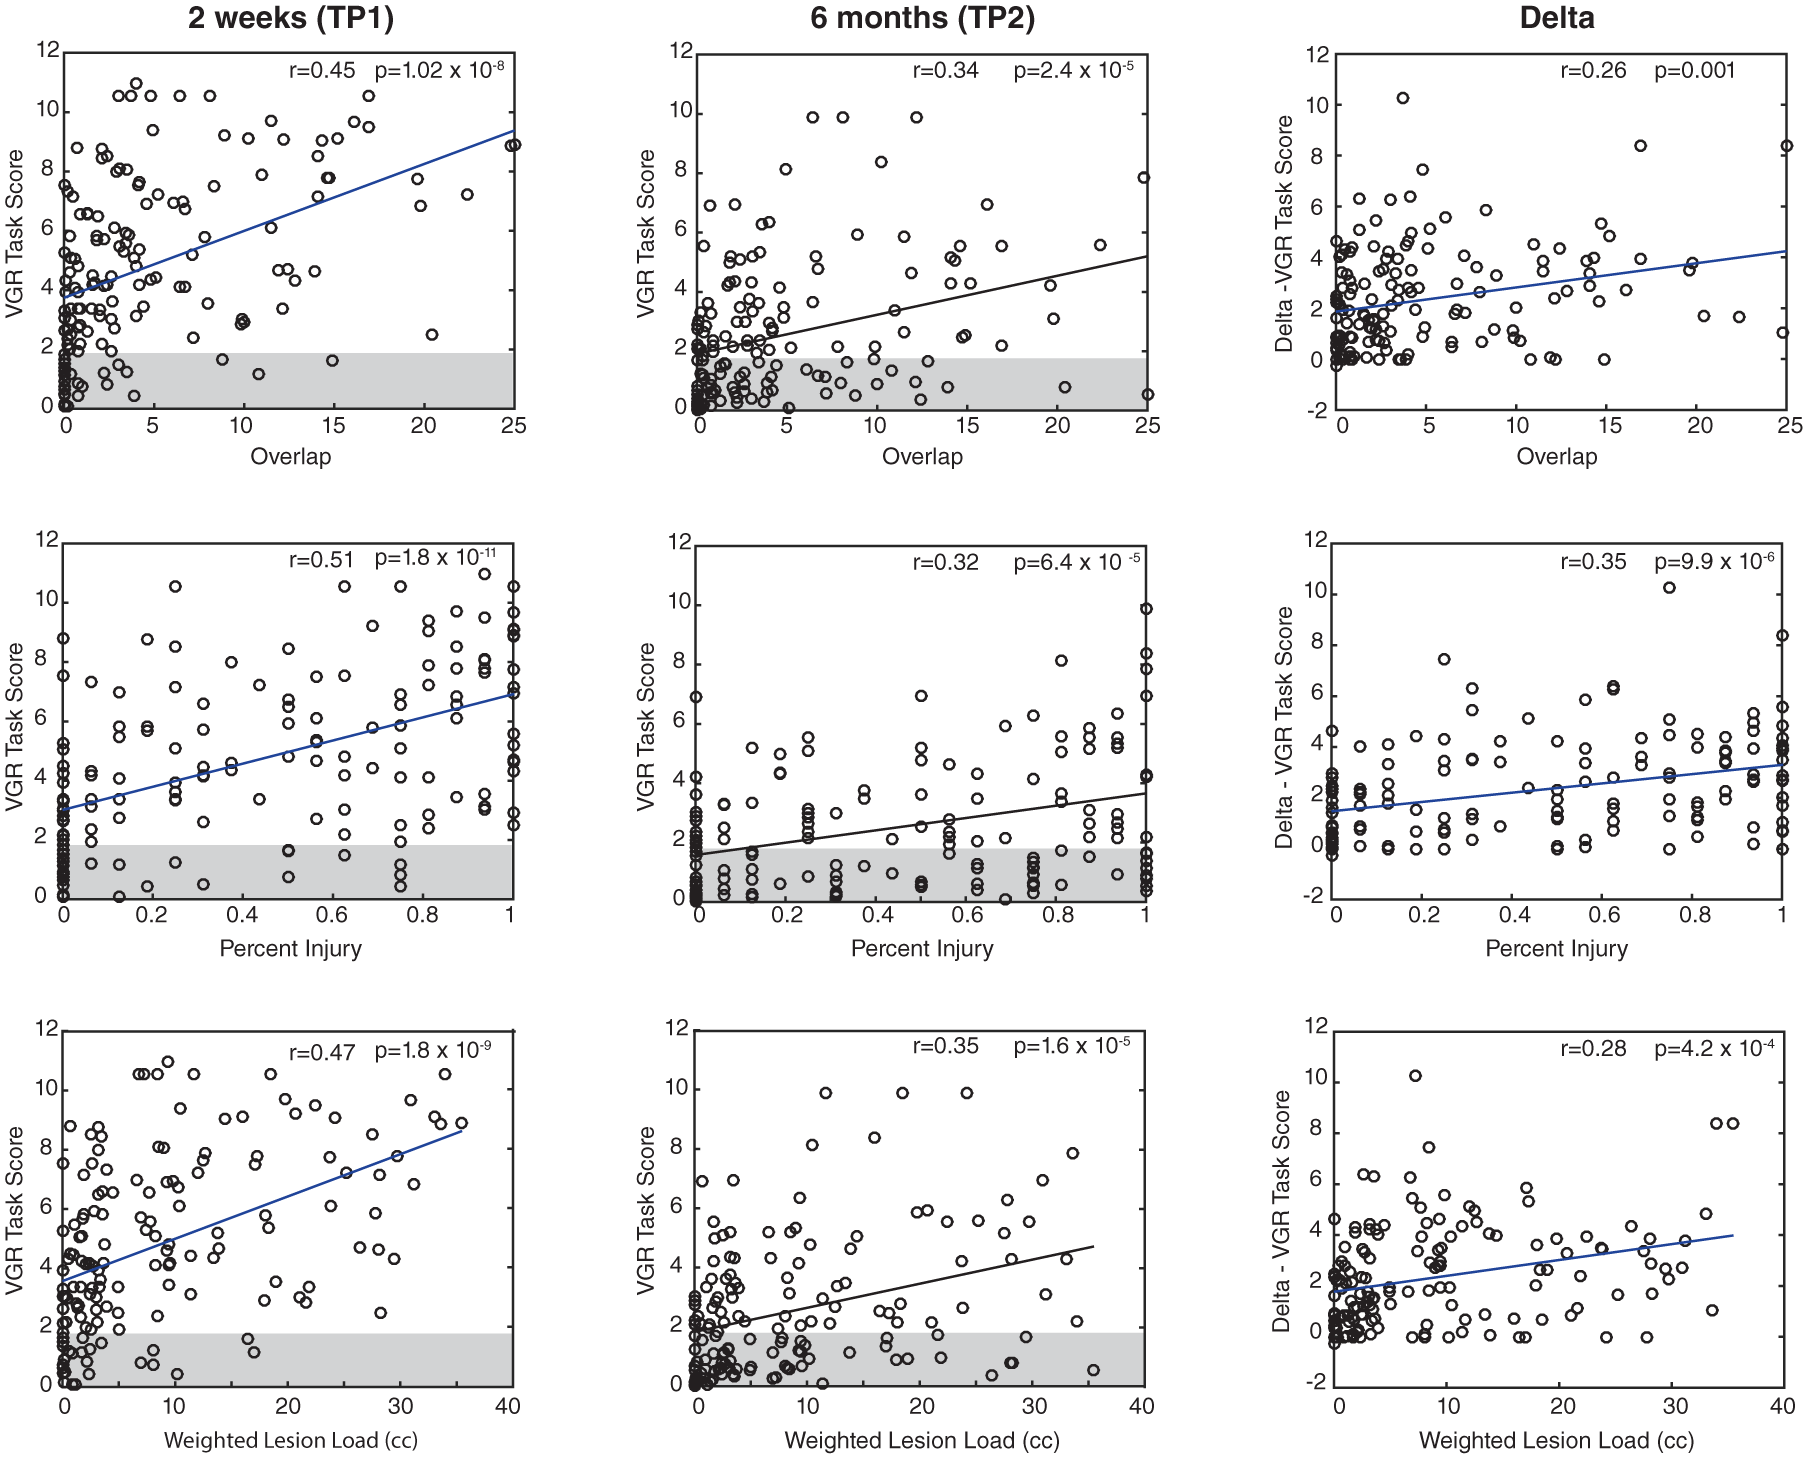
Correlations between the 3 corticospinal tract (CST) metrics and visually guided reaching (VGR) task scores at 2 weeks and 6 months, and the delta score. The top row corresponds with the CST overlap metric, the middle row with the percentage injury, and the bottom with the weighted lesion load. The gray boxes indicate the normative range for robotic scores; data outside of the box are considered abnormal. Correlation coefficients and P values are presented for each plot. Note that Delta here was calculated as T1 − T2 because decreasing scores on VGR represent better performance.
Prior studies have used motor impairment as an inclusion criterion, so we examined the subset of individuals (n = 121) with motor impairments on the VGR task (task score >1.96) at TP1. The 3 lesion metrics were, again, moderately correlated with the VGR task score at TP1 (see Supplementary Figure 2). We then repeated this analysis for a subset of participants (n = 78) who had motor impairments on the VGR task at TP2 (ie, chronic motor impairment). Again, the 3 lesion metrics were moderately correlated with the VGR task score at TP2 (Supplementary Figure 3). No metrics were significantly correlated with the VGR delta scores in this group (Supplementary Figure 3). Correlation coefficients derived from comparing the 3 CST lesion metrics and performance on the VGR task were not significantly different at TP1 or TP2 or for the delta scores (χ2 = 1.78, P = .49; χ2 = 0.36, P = .83; and χ2 = 3.4, P = .18, respectively).
Because previous studies have compared CST lesion metrics with clinical scores such as the FM3,5-7 or ARAT, 2 which we did not collect, we made comparisons with the Chedoke McMaster Stroke Assessment—Arm Impairment (CMSA) scores. TP1 CMSA scores were moderately correlated with CST overlap (r = −0.53; P = 4.5 × 10⁻¹²), percentage injury (r = −0.53; P = 4 × 10⁻¹²), and weighted lesion load (r = −0.48; P = 4.1 × 10⁻¹⁰). TP2 CMSA scores were also correlated with CST overlap (r = −0.32; P = 7.4 × 10⁻⁵), percentage injury (r = −0.29; P = 2.8 × 10⁻⁴), and weighted lesion load (r = −0.31; P = 1.2 × 10⁻⁴). The delta for CMSA scores were moderately correlated with CST overlap (r = 0.43; P = 6.4 × 10⁻⁸), percentage injury (r = 0.42; P = 1.0 × 10⁻⁷), and weighted lesion load (r = 0.38; P = 2.3 × 10⁻⁶).
As we did with the VGR task scores, we also conducted a subanalysis in which we removed individuals with no/mild motor impairment based on the CMSA. We removed those individuals with scores of 6 or greater from our sample and recalculated the relationship between each of the 3 lesion metrics and the VGR task score at TP1. All 3 metrics were moderately correlated with VGR task score (overlap [r = 0.32; P = 2.7 × 10⁻³], percentage injury [r = 0.41; P = 7.7 × 10⁻⁵], and weighted lesion load [r = 0.36; P = 6.2 × 10⁻⁴]).
In addition to comparing the CST lesion metrics with the CMSA, we compared them with the results of other clinical tests (Purdue Pegboard, Strength, Modified Ashworth Scale, and Functional Independence Measure [FIM]), the results of which are presented in Table 2. With any single clinical measures used, correlation coefficients calculated with the 3 CST lesion metrics were not significantly different (see Supplemental Table 1).
Correlations With Clinical Measures.
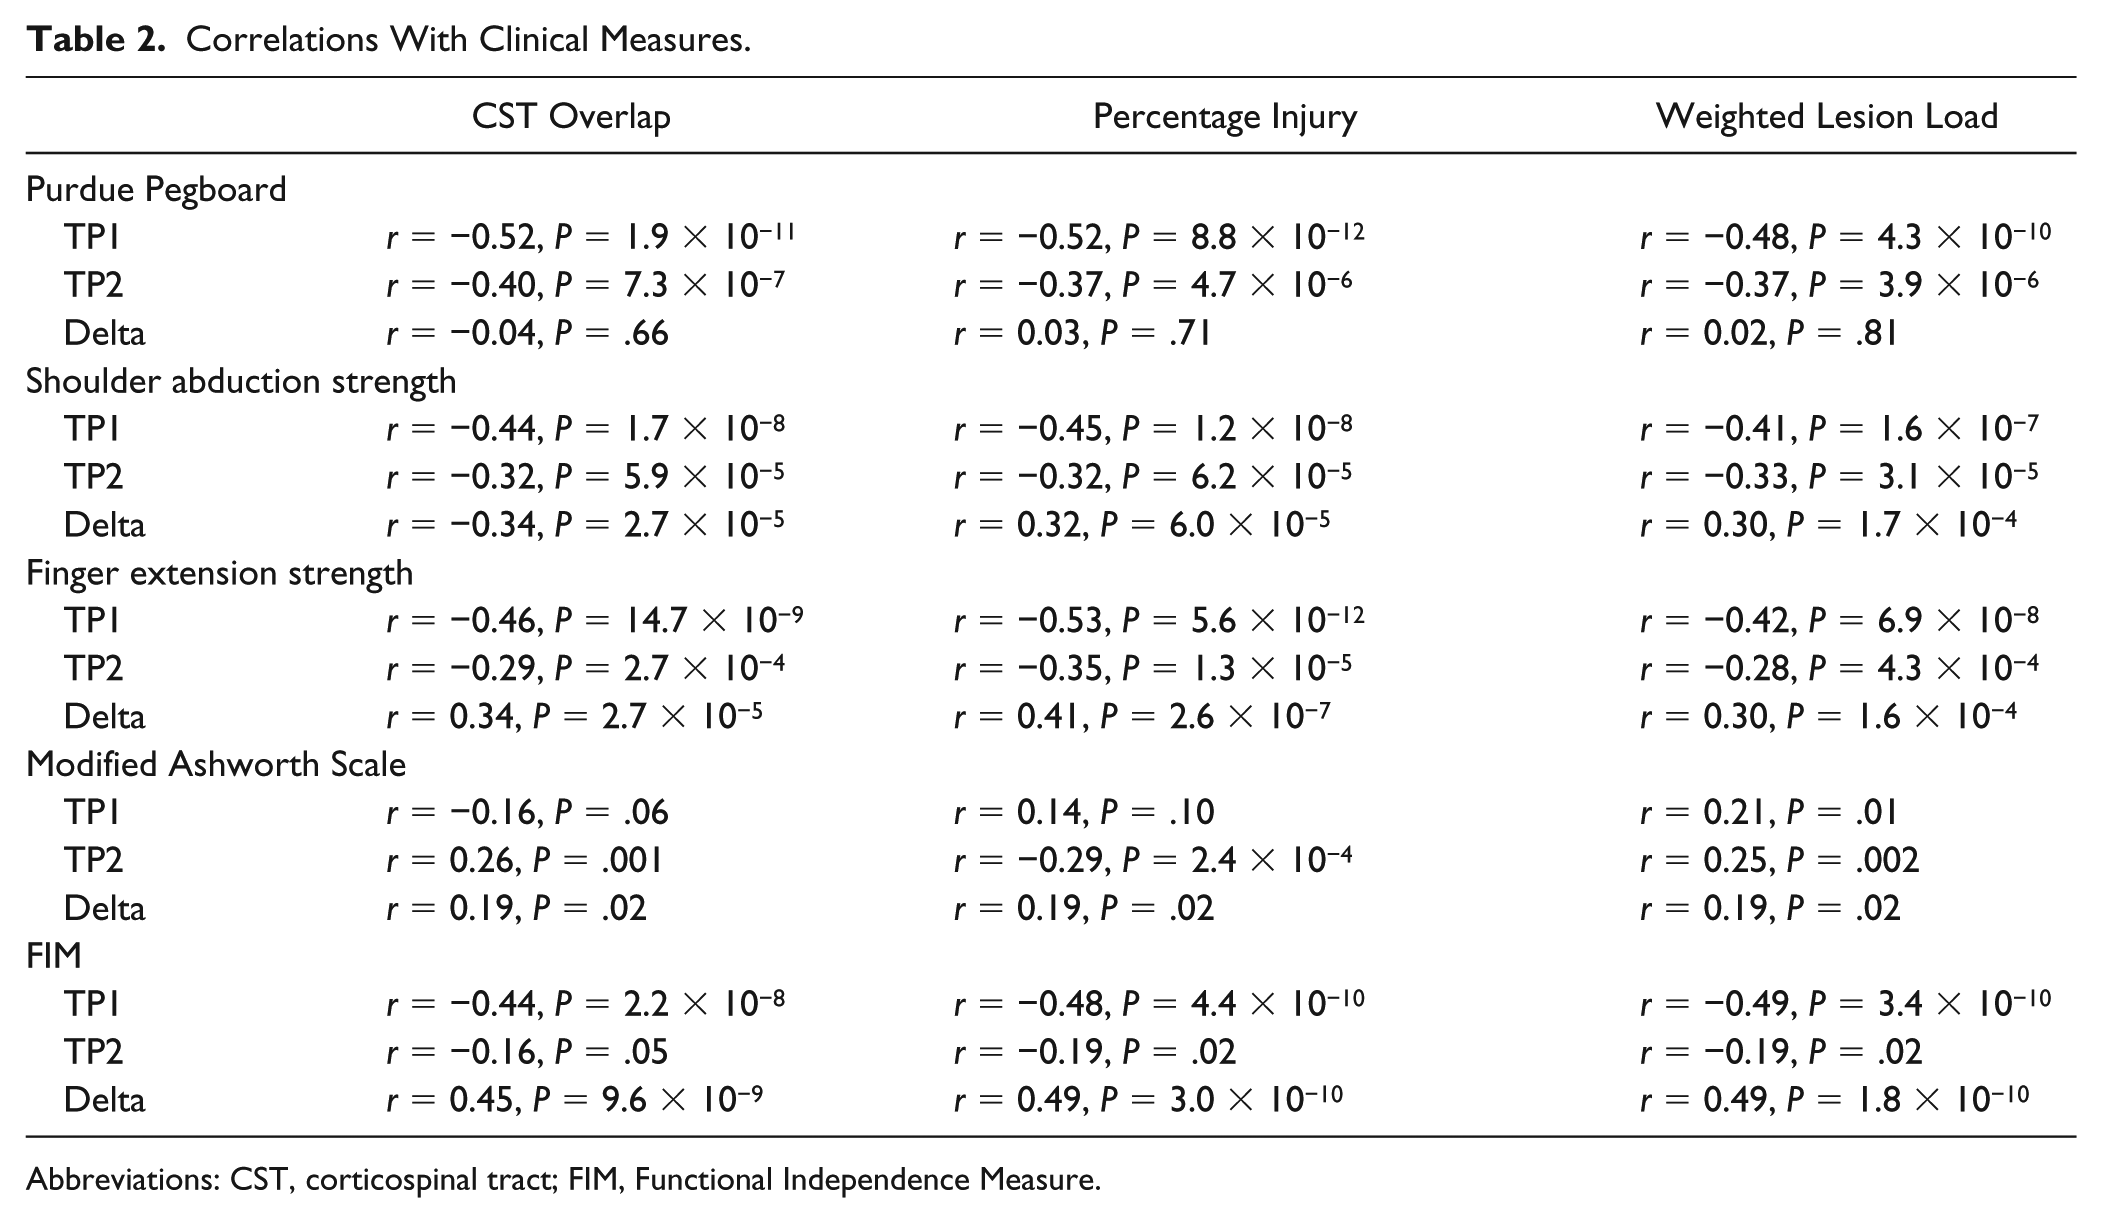
Abbreviations: CST, corticospinal tract; FIM, Functional Independence Measure.
Fractional Anisotropy of the CST and PLIC
Individual data for the subset of individuals who completed diffusion tractography, including FA values and clinical scores are presented in Supplemental Table 2. At TP1 CST-FA was correlated with VGR task scores (r = −0.6; P = .004), but these were not correlated at TP2 (r = −0.32; P = .16), nor were CST-FA and VGR delta scores (r = 0.31; P = .17). We also examined the relationships between CST-FA and the above CST lesion metrics. After correcting for multiple comparisons, CST-FA at TP1 was not significantly correlated with CST overlap (r = −0.4; P = .07), percentage injury (r = −0.56; P = .009), or weighted lesion load (r = −0.39; P = .08). At TP2, CST-FA was not significantly correlated with CST overlap (r = −0.29; P = .21), percentage injury (r = −0.49; P = .02), or weighted lesion load (r = −0.28; P = .22). All 21 participants had stroke lesions that affected their probabilistically defined CST.
Similarly, PLIC-FA ratio at TP1 was not correlated with TP1 VGR task scores (r = −0.15; P = .51) or delta scores (r = 0.26; P = .26). At TP1, PLIC-FA ratio was not correlated with CST overlap (r = −0.08; P = .73), percentage injury (r = −0.39; P = .07), or weighted lesion load (r = −0.01; P = .95). At TP2, PLIC-FA ratio was not correlated with TP2 VGR task scores (r = 0.06; P = .79) or delta scores (r = −0.07; P = .76). At TP2, PLIC-FA was not correlated with CST overlap (r = −0.06; P = .80), percentage injury (r = −0.48; P = .03), or weighted lesion load (r = −0.03; P = .91). Of the subset of 21 participants, 11 had stroke lesions that affected their probabilistically defined PLIC.
Given the relatively modest relationship between any of the CST lesion metrics, CST-FA, and motor performance and strong suggestions in the literature that these tools should be used as prognostic indicators,3-7 we present a few exemplars for consideration. Supplementary Figure 4 presents participants who demonstrate expected CST damage/performance relationships (ie, no CST damage/no motor impairment or maximal CST damage and motor impairment at TP2) as well as participants who demonstrate unexpected CST damage/performance relationships (ie, no CST damage/poor recovery or maximal CST damage and good recovery).
CST Lesion Metric Analysis and Proprioceptive Performance
We compared PM performance and the CST lesion metrics to better understand the impact of CST damage on proprioception (Figure 3). All lesion metrics were moderately correlated with PM scores at TP1 and TP2 and with the PM delta scores.
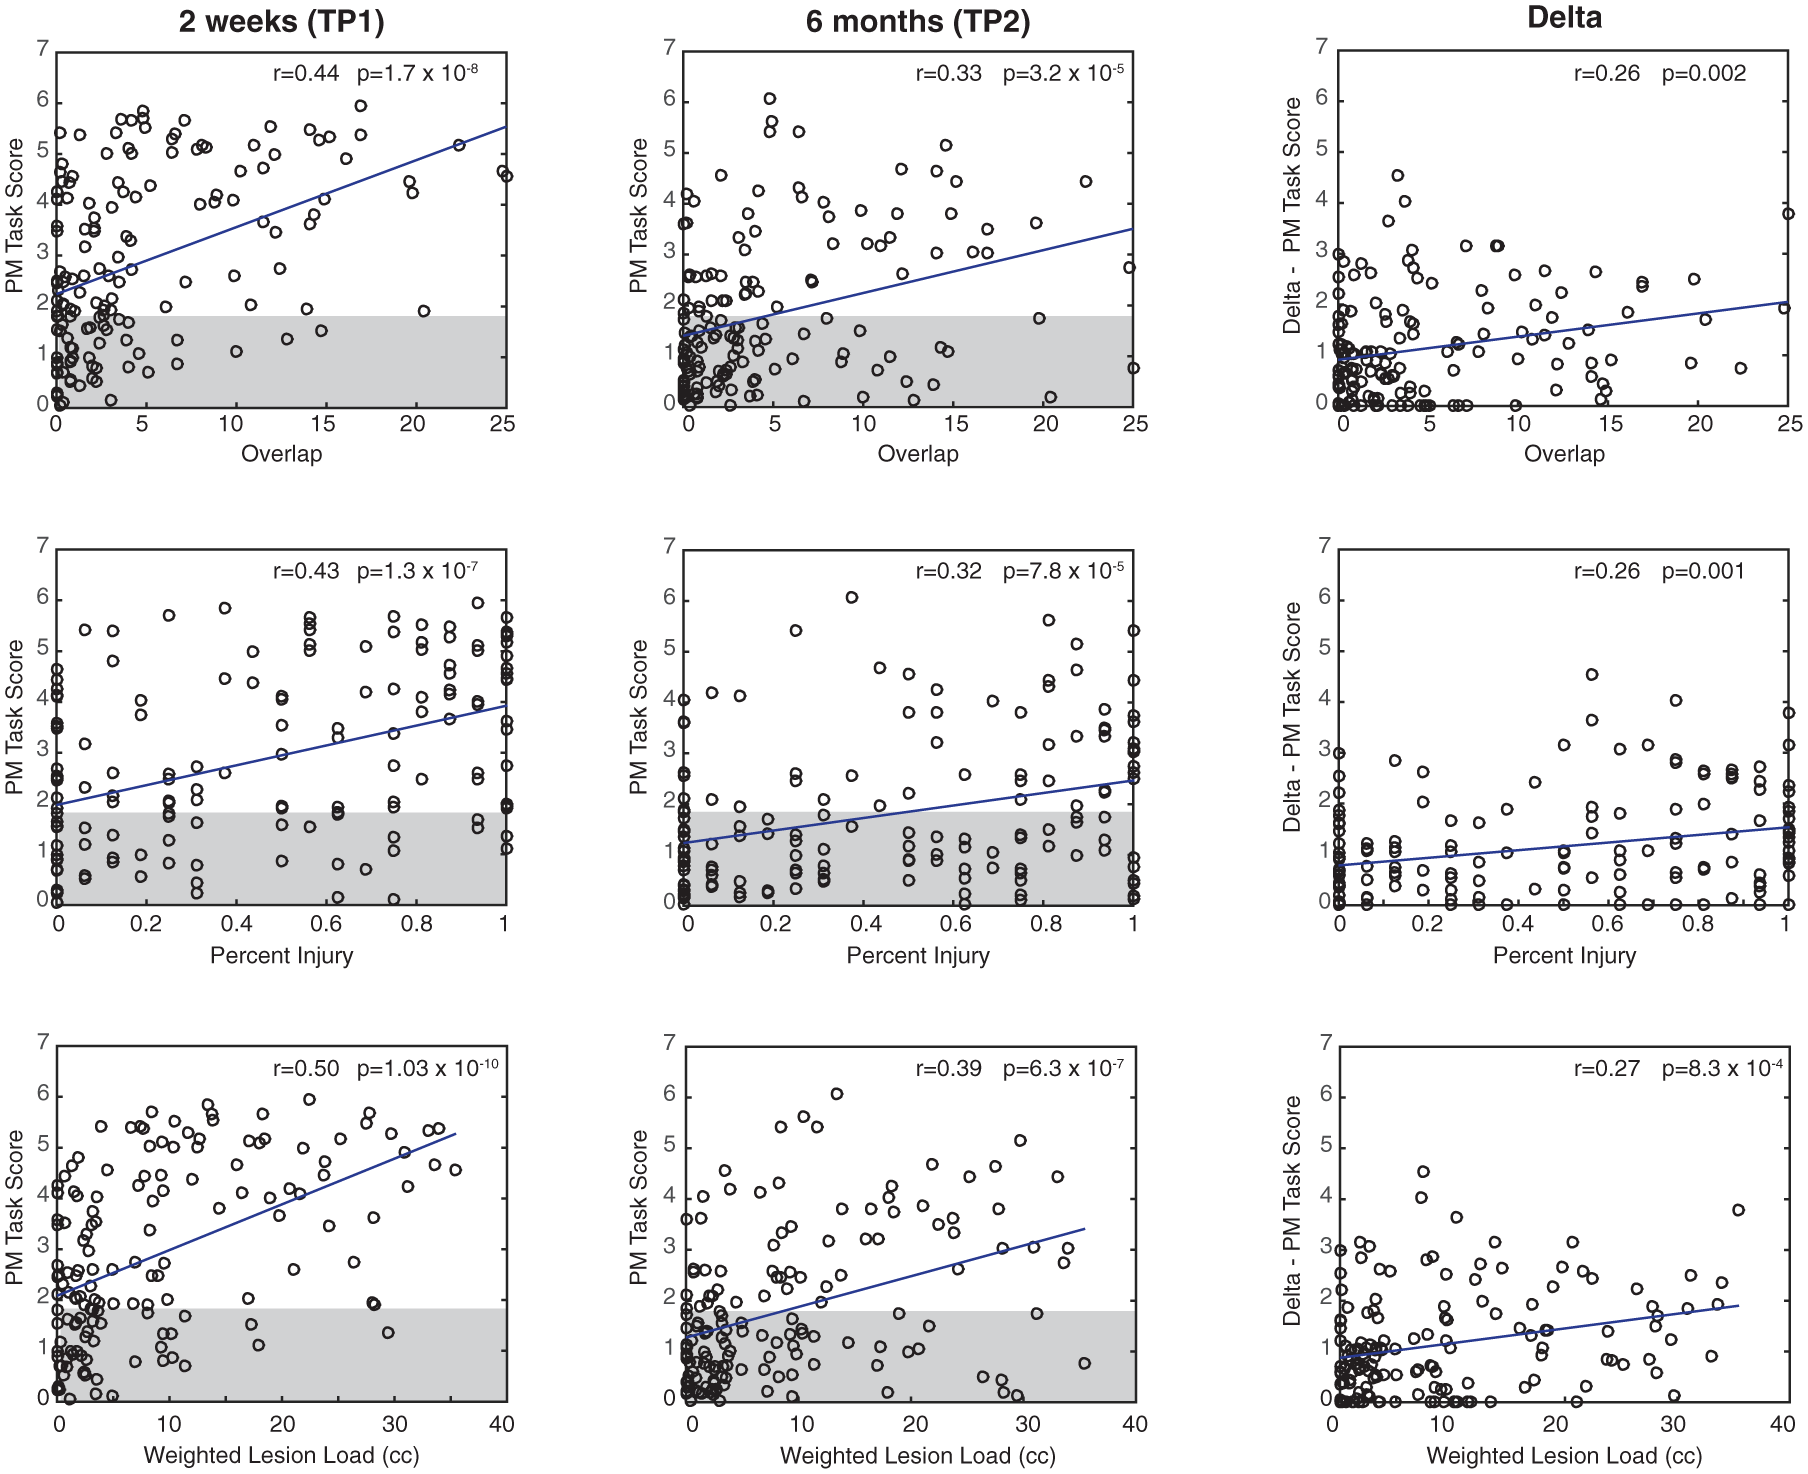
Relationships between the 3 corticospinal tract (CST) metrics and position matching scores (2 weeks, 6 months, and the delta score). The top row corresponds with the CST overlap metric, the middle row with the percentage injury, and the bottom with the CST weighted lesion load. The gray boxes indicate the normative range for robotic scores; data outside of the box are considered abnormal. Correlation coefficients and P values are presented for each plot. Note that Delta here was calculated as T1 − T2 because decreasing scores on position matching (PM) represent better performance.
Beyond the CST sROI Analysis
Because CST lesion metrics only explained a small proportion of the motor impairment, we used an atlas-based49,50 sROI analysis to identify all lesion locations associated with VGR task scores at both time points (see Figure 4). At TP1, damage to the CST, corticopontocerebellar tract, internal capsule, precentral gyrus, putamen, and pallidum was associated with higher (more impaired) VGR task scores. At TP2 poststroke, damage to the CST, corticopontocerebellar tract, internal capsule, and putamen was associated with higher VGR task scores. Higher VGR delta scores were only associated with damage to the CST.
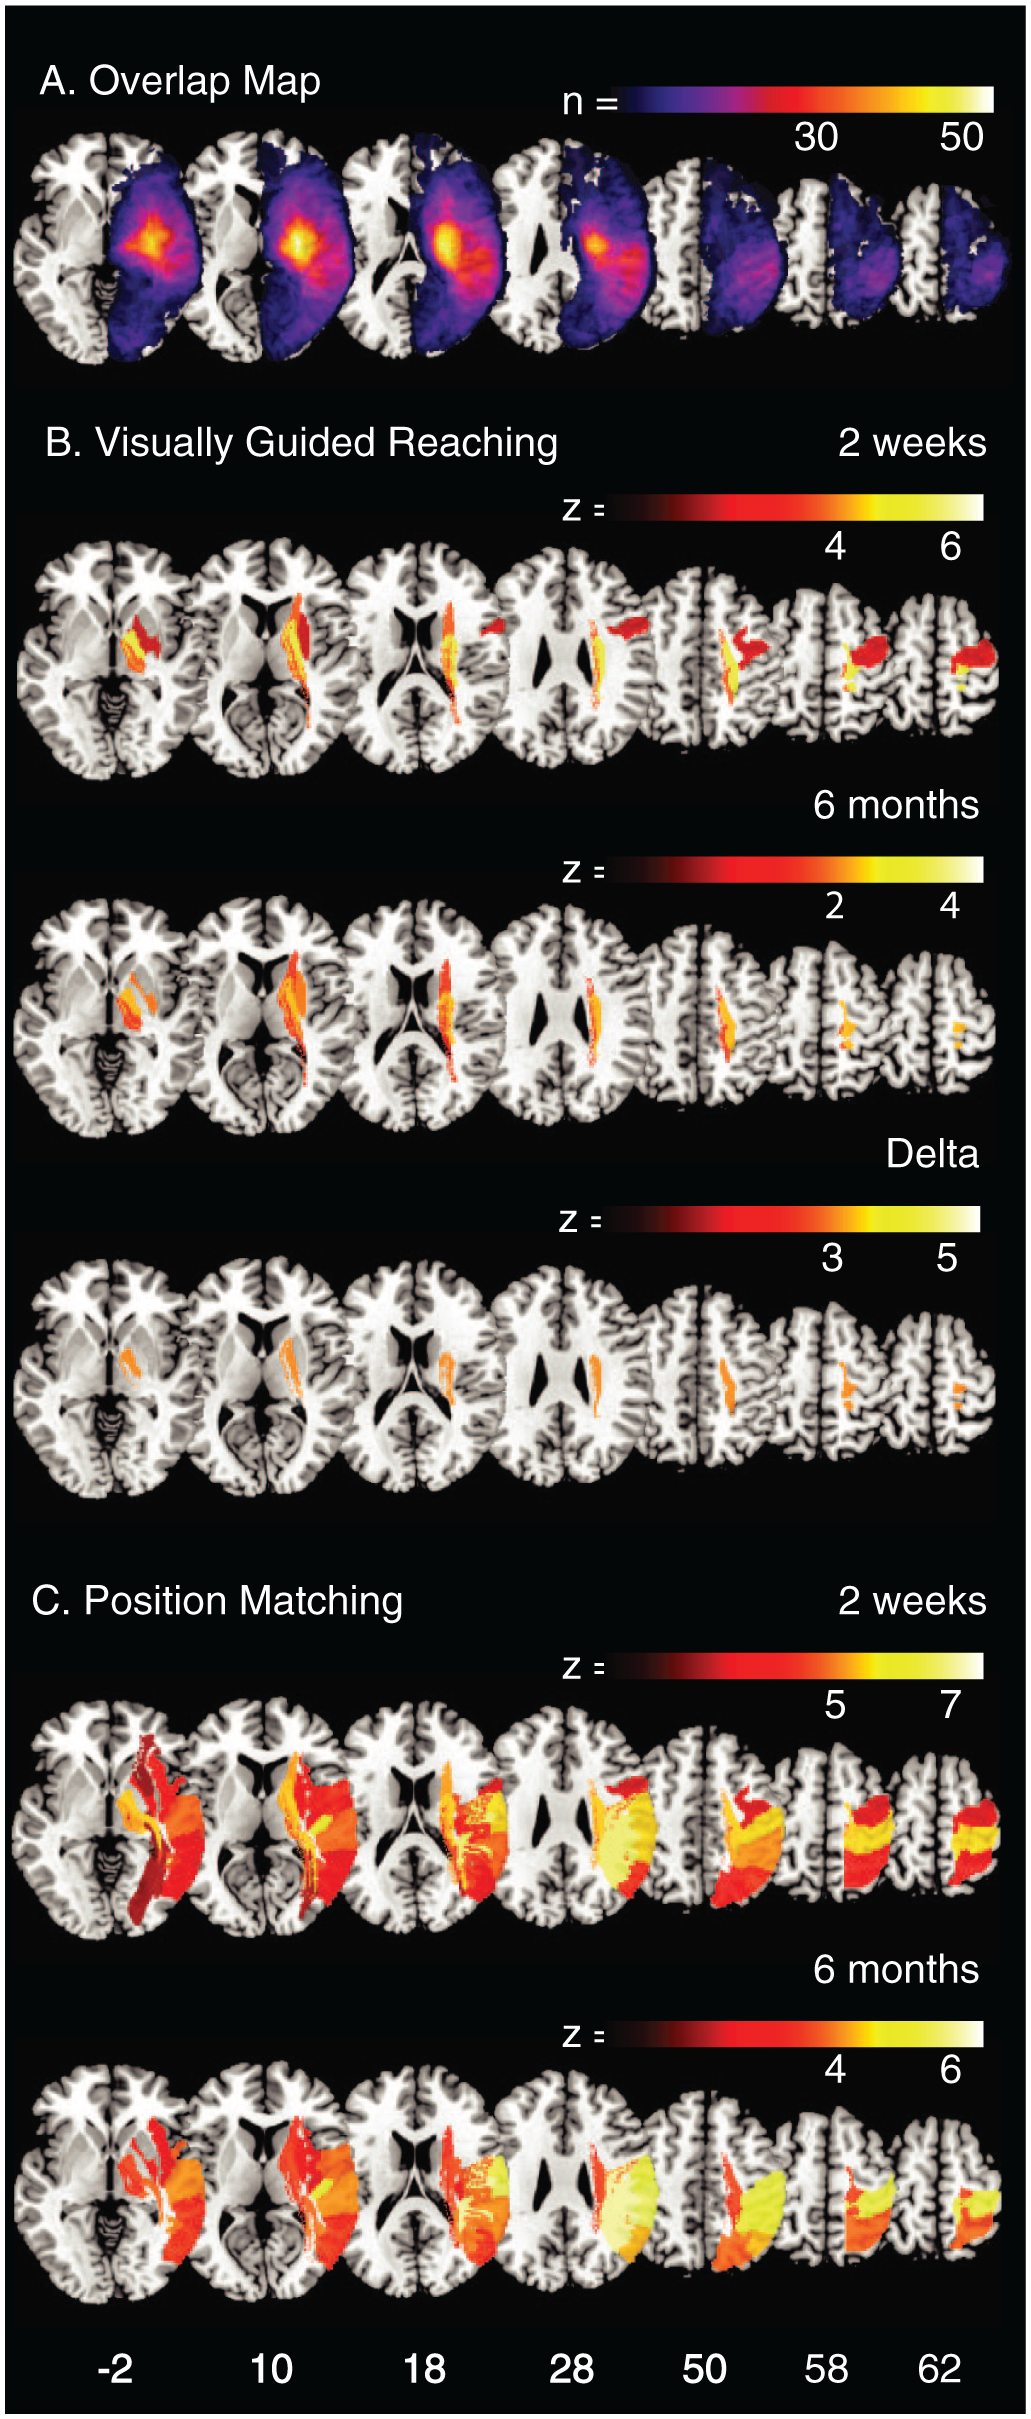
A. An overlap map of all lesions (n = 149). The area of maximal overlap is in the posterior putamen (n = 53). Statistical region of interest (sROI) maps for (B) visually guided reaching at 2 weeks and 6 months and the delta score and (C) position matching at 2 weeks and 6 months. All regions presented in the sROI maps surpassed permutation thresholding for family-wise error correction (P < .05). Axial Montreal Neurological Institute coordinates are displayed at the bottom of the figure.
SROI analysis was also conducted to identify lesion locations associated with PM scores at both time points (see Figure 4C). This provides a comparison of areas responsible for sensory performance and motor performance shown in Figure 4B. At 2 weeks poststroke, damage to cortical regions (the postcentral, supramarginal, angular, superior and inferior parietal, superior and middle temporal, precentral, and Heschl’s gyri; the Rolandic operculum; and insula), subcortical regions (putamen), and white matter (internal capsule, arcuate fasciculus, including anterior, posterior and long subdivisions, CST, optic radiations, corticopontocerebellar tract, inferior longitudinal fasciculus, and the inferior occipital frontal fasciculus) was associated with more impaired PM task scores. At 6 months poststroke, damage to the above regions, with the exception of the precentral gyrus, the corticopontocerebellar tract, and the arcuate fasciculus (including the anterior, posterior and long subdivisions), was associated with more impaired PM scores.
Discussion
In contrast to earlier observations5-7 that CST lesion metrics were robust predictors of motor recovery after stroke, our results indicate that these metrics have only weak to moderate correlations with motor performance. Furthermore, no single lesion metric outperformed another. In a small subset of patients, CST-FA showed moderate correlations with motor impairment at 1 month but, interestingly, did not correlate with the other lesion metrics. Whereas CST damage has been most commonly associated with impaired motor function, damage to the CST correlated similarly to proprioceptive impairment. Additionally, we identified that brain regions beyond the CST were also associated with poor motor performance.
All 3 CST lesion metrics were moderately correlated with motor performance on the VGR task at both time points. For the overlap method, we found a slightly weaker relationship than Carter et al, 2 who examined motor performance using the ARAT. Our results were similar to those of Kou et al, 8 who reported a significant correlation (r = 0.46) between CST lesion overlap and motor impairment defined using the first principle component of 4 clinical measures combined (ARAT, Nine-Hole Peg Test, Motricity Index, and grip strength). For the percentage injury metric, our findings are in line with previous reports examining percentage injury and prediction of treatment gains.3,5 However, our results for the weighted lesion load metric were much more modest than results from previous studies.6,7 In 76 participants assessed with the FM, Feng et al 7 reported that the weighted lesion load accounted for 69% of the variance in FM scores at 3 months poststroke. In our study, the same metric accounted for 12% of the variance in VGR task scores at 6 months poststroke. These differences may be related to the handling of outliers (some studies removed outliers, 7 and we did not), the timing of the motor assessments, or the severity of motor impairments across the sample. In contrast to our study, most other studies4,5,7,8 limited study inclusion to participants with motor deficits. For comparability to other studies, we conducted separate analyses of subgroups with motor deficits identified on the VGR task at TP1 and with TP2, and our original findings remained essentially unchanged (see Supplementary Figures 2 and 3). Because our study may have also included some individuals with milder motor impairment levels than other studies, we also conducted another supplementary analysis: we excluded all those individuals with CMSA scores of 6 or greater (ie. mild motor impairment), and essentially, our results were unchanged. In summary, whether we excluded individuals with no or mild impairment, our results were largely unchanged and demonstrated moderate correlations between performance on the VGR task and the difference in CST lesion metrics.
A key difference between the current study and past studies that used clinical measures is that the clinical measures used in previous studies required antigravity movements and assessed impairments of the wrist and hand. The robot we used for the present study functions in the horizontal plane and has proved useful in conducting early assessments poststroke because participants work in a gravity-minimized position. The robot, however, does not assess wrist and hand function. These 2 factors may explain why the present results do not align with some prior studies using the FM assessment as a motor outcome. However, our participants completed the Purdue Pegboard, which involves significant distal control, and results from this measure still only moderately correlated with any of the 3 CST lesion metrics. This finding is somewhat surprising given the known projections of the CST and its influence on distal motor control. 54
It has been proposed that CST lesion metrics may be useful neuroimaging biomarkers to help predict motor outcomes or response to treatment. 1 Based on our findings, no CST lesion metric outperformed the others. Furthermore, when a continuous robotic measure of motor performance was used, the strength of the CST lesion/motor impairment relationship was weaker than that observed in many previous studies3-7 that quantified motor performance with the FM. This may be explained by scale properties because the FM is known to have ceiling effects. 11 We observed a similar relationship between the CST lesion metrics and the CMSA score, which also has issues with ceiling effects and is known to correlate highly with the FM. 41
We identified several exemplar participants who did not demonstrate the expected CST lesion/motor performance relationship (see Supplementary Figure 4). Some participants had substantial CST lesions with relatively normal motor performance. In these cases, other pathways may have compensated for CST damage, as hypothesized previously.15,21,55 Conversely, some participants had impaired motor performance and no CST damage, likely explained by the fact that other brain regions, beyond the CST, are required to perform reaching movements. Such exemplars lend support to previous statements that biomarker selection may vary across subgroups, depending on individual characteristics, and that a one-size-fits-all biomarker is unlikely.1,4 The exclusion of outliers from previous studies suggests that contradictory examples may exist in these studies as well. 7 This serves as a cautionary note that selection for clinical trials or treatment based solely on the imaging methods of CST integrity performed in the present study has the potential to inappropriately classify the expected recovery of a number of patients.
Diffusion tensor imaging metrics of the CST have also been considered a biomarker for motor performance after stroke. Many studies,16-18,56 but not all,35,57 have observed a relationship between lower CST-FA and motor performance at or beyond 3 months poststroke. Similarly, several studies18-21 have observed a relationship between FA of the PLIC (PLIC-FA) and motor performance. However, a relationship with the PLIC-FA was observed neither in the current study nor by others.5,48 Differing results between studies may be a result of methodological factors. Some studies constrained inclusion criteria to only individuals with motor deficits,5,16,19,20,56,57 whereas this study and others,7,18 included individuals whose motor performance at recruitment ranged from no motor deficits to severe deficits. Additionally, the motor assessment scales varied across studies. Some used the FM,5,19,57 whereas others categorized motor performance (ie, good, limited, poor) based on the ARAT 20 or the Motricity Index.18,56 According to Marumoto et al, 48 scale differences may account for variable results. This group recently found that CST-FA correlated with the FM, but not other clinical assessments, concluding that the FM delta score calculation (later score minus the initial score) might be susceptible to ceiling effects. Although VGR task parameters and FM scores have moderate correlations, 14 some authors have suggested that the measurement of reaching using robotics and FM task may be measuring unique aspects of motor performance. 58
We identified that impaired proprioceptive performance was associated with each of the 3 CST lesion metrics. Although our group has demonstrated that motor and sensory impairments may be dissociable with careful assessment, 13 it is undeniable that there is interplay between motor and somatosensory systems, and some lesions may damage both motor and sensory tracts. Structurally, diffusion tractography has delineated streamlines destined for the precentral gyrus from those destined for the postcentral gyrus in the PLIC. 59 Thus, tractography studies using the PLIC as a seed for the CST include proprioceptive afferents en route to the cortex for perception of limb position and movement. Beyond the PLIC, there is further evidence of structural and functional interplay between motor and sensory systems in the spinal cord29,60 and cortico-cortico connections between S1 and M1. 61 Together, this anatomical evidence and our sROI analyses indicate that CST damage is associated with proprioceptive deficits. We caution, however, that the CST is only one of several brain regions important for perception of upper-limb proprioception after stroke. 37
sROI analysis identified areas beyond the CST known to be important for motor performance. Damage to the corticopontocerebellar tract was associated with abnormal reaching. This tract is part of the cerebrocerebellar loop involving motor and nonmotor areas 55 and is important for coordinated movement. 62 This large tract, recently detailed using advanced tractography methods, 55 may include motor pathways beyond the CST that have been previously associated with motor impairment in tractography studies because they utilize common seed regions.3,15,21,63 Finally, we found that damage to the putamen and entire internal capsule was associated with poor motor scores, consistent with other studies that measured disability with the modified Rankin Scale.64,65 Together, these findings suggest that predictions of motor performance poststroke may benefit by examining motor regions beyond the CST. We were somewhat surprised that our sROI analysis did not identify other areas thought to be important in motor control such as premotor or supplementary motor areas. One possibility is that damage to these areas can somehow be mitigated by redundancy in the motor system to perform our reaching task poststroke. For instance, neural activity in the dorsal premotor cortex in nonhuman primates is observed not only for contralateral reaching movements, but also for ipsilateral reaching movements. 66 In a study of individuals poststroke, it has also been suggested that the supplementary motor area in the intact hemisphere is upregulated during contralesional arm movement 67 and stimulation of the supplementary motor area with epidural electrodes in humans can evoke bilateral motor response. 68 Ultimately, research across human and animal studies would suggest that a network of many brain areas is important for motor control, and so one must consider the importance of other brain regions in motor recovery poststroke.
Biomarker development relies on measuring biological properties and correlating them with behavior, both cross-sectionally and longitudinally. Imaging biomarkers are a seemingly pragmatic way to do this because patients often receive brain scans as part of standard clinical practice. A challenge faced by the field is that although features seen on imaging are linked to the underlying pathophysiology, they are typically an indirect measure of a complex cellular and metabolic process. This has the potential to lead to increased variability in the observed relationship between imaging and behavior following stroke. For instance, some participants in the present study showed CSTs that were significantly affected on imaging, yet displayed substantial motor recovery (see Supplementary Figure 4). Clinical assessments of motor and sensory function often have established limitations around reliability and/or sensitivity to change, which can further complicate the ability to predict recovery. As a field, biomarkers offer the promise of helping to predict recovery, plan for treatment, and make decisions around inclusion in clinical trials, but based on the results of our study and others, more work in this area needs to be done. Stroke is a heterogeneous disease, and we must consider that any single biomarker may only ever explain a small portion of stroke recovery. It is entirely possible that multiple biomarkers may be required to make meaningful predictions about how a given individual may recover after stroke.
The current study is not without limitations. The subset of participants that completed the imaging protocol necessary to determine CST-FA and PLIC-FA was much smaller (n = 21) than the main sample (n = 149), so the relationships between FA measures and CST lesion metrics must be taken with some caution. In our analysis, we correlated robotic task scores with each of the CST lesion metrics. Overall robotic task scores were used for ease of presentation because each robotic task produces a number of discrete parameters (11 for reaching and 3 for PM). Although these overall task scores do not suffer from the same issues of ceiling effects and poor reliability as many clinical measures, they are a summative score across multiple parameters, and in some ways, this may be seen as a limitation. Additionally, whereas the neuroimaging used in our study was moderately correlated with motor performance, it is possible that functional tract connectivity measures such as motor-evoked potentials might have improved this prediction. 19
In conclusion, CST damage, as defined by lesion metrics, was associated with both motor and proprioceptive impairment poststroke. No lesion metric outperformed the others. Importantly, the correlation between CST lesion metrics and motor performance was only moderate. Given the heterogeneous presentation of stroke, factors beyond damage to the CST on structural imaging are likely important in motor performance after stroke. Further work is indicated to identify and appropriately validate measures (imaging, neurophysiological, serum-based, behavioral) that, when combined with CST lesion metrics or used in place of them, may serve as biomarkers for stroke recovery. In the future, valid biomarkers will hopefully allow better prediction of recovery after stroke.
Supplemental Material
Online_Supplement_Methods – Supplemental material for Comparing CST Lesion Metrics as Biomarkers for Recovery of Motor and Proprioceptive Impairments After Stroke
Supplemental material, Online_Supplement_Methods for Comparing CST Lesion Metrics as Biomarkers for Recovery of Motor and Proprioceptive Impairments After Stroke by Sonja E. Findlater, Rachel L. Hawe, Erin L. Mazerolle, Abdulaziz S. Al Sultan, Jessica M. Cassidy, Stephen H. Scott, G. Bruce Pike and Sean P. Dukelow in Neurorehabilitation and Neural Repair
Supplemental Material
SupplementalTable1 – Supplemental material for Comparing CST Lesion Metrics as Biomarkers for Recovery of Motor and Proprioceptive Impairments After Stroke
Supplemental material, SupplementalTable1 for Comparing CST Lesion Metrics as Biomarkers for Recovery of Motor and Proprioceptive Impairments After Stroke by Sonja E. Findlater, Rachel L. Hawe, Erin L. Mazerolle, Abdulaziz S. Al Sultan, Jessica M. Cassidy, Stephen H. Scott, G. Bruce Pike and Sean P. Dukelow in Neurorehabilitation and Neural Repair
Supplemental Material
SupplementalTable2 – Supplemental material for Comparing CST Lesion Metrics as Biomarkers for Recovery of Motor and Proprioceptive Impairments After Stroke
Supplemental material, SupplementalTable2 for Comparing CST Lesion Metrics as Biomarkers for Recovery of Motor and Proprioceptive Impairments After Stroke by Sonja E. Findlater, Rachel L. Hawe, Erin L. Mazerolle, Abdulaziz S. Al Sultan, Jessica M. Cassidy, Stephen H. Scott, G. Bruce Pike and Sean P. Dukelow in Neurorehabilitation and Neural Repair
Supplemental Material
Supplementary_Figure_1 – Supplemental material for Comparing CST Lesion Metrics as Biomarkers for Recovery of Motor and Proprioceptive Impairments After Stroke
Supplemental material, Supplementary_Figure_1 for Comparing CST Lesion Metrics as Biomarkers for Recovery of Motor and Proprioceptive Impairments After Stroke by Sonja E. Findlater, Rachel L. Hawe, Erin L. Mazerolle, Abdulaziz S. Al Sultan, Jessica M. Cassidy, Stephen H. Scott, G. Bruce Pike and Sean P. Dukelow in Neurorehabilitation and Neural Repair
Supplemental Material
Supplementary_Figure_2 – Supplemental material for Comparing CST Lesion Metrics as Biomarkers for Recovery of Motor and Proprioceptive Impairments After Stroke
Supplemental material, Supplementary_Figure_2 for Comparing CST Lesion Metrics as Biomarkers for Recovery of Motor and Proprioceptive Impairments After Stroke by Sonja E. Findlater, Rachel L. Hawe, Erin L. Mazerolle, Abdulaziz S. Al Sultan, Jessica M. Cassidy, Stephen H. Scott, G. Bruce Pike and Sean P. Dukelow in Neurorehabilitation and Neural Repair
Supplemental Material
Supplementary_Figure_3 – Supplemental material for Comparing CST Lesion Metrics as Biomarkers for Recovery of Motor and Proprioceptive Impairments After Stroke
Supplemental material, Supplementary_Figure_3 for Comparing CST Lesion Metrics as Biomarkers for Recovery of Motor and Proprioceptive Impairments After Stroke by Sonja E. Findlater, Rachel L. Hawe, Erin L. Mazerolle, Abdulaziz S. Al Sultan, Jessica M. Cassidy, Stephen H. Scott, G. Bruce Pike and Sean P. Dukelow in Neurorehabilitation and Neural Repair
Supplemental Material
Supplementary_Figure_4 – Supplemental material for Comparing CST Lesion Metrics as Biomarkers for Recovery of Motor and Proprioceptive Impairments After Stroke
Supplemental material, Supplementary_Figure_4 for Comparing CST Lesion Metrics as Biomarkers for Recovery of Motor and Proprioceptive Impairments After Stroke by Sonja E. Findlater, Rachel L. Hawe, Erin L. Mazerolle, Abdulaziz S. Al Sultan, Jessica M. Cassidy, Stephen H. Scott, G. Bruce Pike and Sean P. Dukelow in Neurorehabilitation and Neural Repair
Supplemental Material
Supplementary_Figure_5 – Supplemental material for Comparing CST Lesion Metrics as Biomarkers for Recovery of Motor and Proprioceptive Impairments After Stroke
Supplemental material, Supplementary_Figure_5 for Comparing CST Lesion Metrics as Biomarkers for Recovery of Motor and Proprioceptive Impairments After Stroke by Sonja E. Findlater, Rachel L. Hawe, Erin L. Mazerolle, Abdulaziz S. Al Sultan, Jessica M. Cassidy, Stephen H. Scott, G. Bruce Pike and Sean P. Dukelow in Neurorehabilitation and Neural Repair
Supplemental Material
NNR_Visual_Abstract – Supplemental material for Comparing CST Lesion Metrics as Biomarkers for Recovery of Motor and Proprioceptive Impairments After Stroke
Supplemental material, NNR_Visual_Abstract for Comparing CST Lesion Metrics as Biomarkers for Recovery of Motor and Proprioceptive Impairments After Stroke by Sonja E. Findlater, Rachel L. Hawe, Erin L. Mazerolle, Abdulaziz S. Al Sultan, Jessica M. Cassidy, Stephen H. Scott, G. Bruce Pike and Sean P. Dukelow in Neurorehabilitation and Neural Repair
Footnotes
Acknowledgements
We acknowledge Janice Yajure and Mark Piitz for assistance in data collection and Dr Steven C. Cramer for his assistance with the CST percentage injury calculation.
Supplementary material for this article is available on the Neurorehabilitation & Neural Repair website along with the online version of this article.
Authors’ Note
Jessica M. Cassidy is now affiliated to University of North Carolina at Chapel Hill, Chapel Hill, NC, USA.
Declaration of Conflicting Interests
The authors declared the following potential conflicts of interest with respect to the research, authorship, and/or publication of this article: SHS is cofounder and chief scientific officer of BKIN Technologies, the company that commercializes the KINARM robotic device used in this study. All other authors have no conflict of interest to declare.
Funding
The authors disclosed receipt of the following financial support for the research, authorship, and/or publication of this article: The present work was supported by a Canadian Institutes of Health Research Grant (MOP 106662), and a Heart and Stroke Foundation of Canada Grant-in-Aid (G-13-003029). SEF was supported by an Alberta Innovates Health Solutions Clinical Fellowship.
References
Supplementary Material
Please find the following supplemental material available below.
For Open Access articles published under a Creative Commons License, all supplemental material carries the same license as the article it is associated with.
For non-Open Access articles published, all supplemental material carries a non-exclusive license, and permission requests for re-use of supplemental material or any part of supplemental material shall be sent directly to the copyright owner as specified in the copyright notice associated with the article.