
Abstract
Background
Knowing how impaired manual dexterity and finger proprioception affect upper limb activity capacity is important for delineating targeted post-stroke interventions for upper limb recovery.
Objectives
To investigate whether impaired manual dexterity and finger proprioception explain variance in post-stroke activity capacity, and whether they explain more variance than conventional clinical assessments of upper limb sensorimotor impairments.
Methods
Activity capacity and hand sensorimotor impairments were assessed using clinical measures in N = 42 late subacute/chronic hemiparetic stroke patients. Dexterity was evaluated using the Dextrain Manipulandum to quantify accuracy of visuomotor finger force-tracking (N = 36), timing of rhythmic tapping (N = 36), and finger individuation (N = 24), as well as proprioception (N = 27). Stepwise multivariate and hierarchical linear regression models were used to identify impairments best explaining activity capacity.
Results
Dexterity and proprioceptive components significantly increased the variance explained in activity capacity: (i) Box and Block Test was best explained by baseline tonic force during force-tracking and tapping frequency (adjusted R2 = .51); (ii) Motor Activity Log was best explained by success rate in finger individuation (adjusted R2 = .46); (iii) Action Research Arm Test was best explained by release of finger force and proprioceptive measures (improved reaction time related to use of proprioception; adjusted R2 = .52); and (iv) Moberg Pick-Up test was best explained by proprioceptive function (adjusted R2 = .18). Models excluding dexterity and proprioception variables explained up to 19% less variance.
Conclusions
Manual dexterity and finger proprioception explain unique variance in activity capacity not captured by conventional impairment measures and should be assessed when considering the underlying causes of post-stroke activity capacity limitations.
URL: https://www.clinicaltrials.gov. Unique identifier: NCT03934073.
Keywords
Introduction
Up to 50% of stroke patients still suffer from upper limb motor impairments in the chronic phase post-stroke, particularly impacting dexterous hand function.1,2 Manual dexterity, an evolutionary feature of primates, refers to the fine, skillful use of the hand to grasp, and manipulate objects. It is expressed through coordinated hand and finger movements relying on sensorimotor integration. 3 There is no standard method to operationally define the degree of manual dexterity or to assess it clinically. 4 It is understood that dexterous hand movements require multi-component control of finger forces, 5 of movement timing, 6 of finger independence,7,8 and of finger movement sequences.9,10 Obtaining measures11,12 that represent these components complies, partially, with recent recommendations for assessing post-stroke quality of manual dexterity. 13 More-over, approximately half of stroke patients suffer from upper limb somatosensory deficits, such as impaired tactile sensation, proprioception, and haptic object recognition, 14 negatively impacting functional outcomes and quality of life.4,15-17 Proprioception is defined as the spatio-temporal awareness of limb position and movement arising from proprioceptors (muscle-, joint-, and skin-afferents). 18 Proprioceptive post-stroke deficits impact motor control negatively. 18 A better understanding of the contribution of upper limb sensorimotor impairments to post-stroke activity capacity limitation is essential for developing more efficient and targeted treatments. 19
These sensorimotor impairments are responsible for reduced hand function and upper limb use in activities of daily living (ADL), that is, for reduced activity capacity.19-22 Here, we define “upper limb activity capacity” according to the Internation Classification of Functioning, Disability and Health (ICF), 23 which refers to the capacity to perform activities assessed by tests and items that account for “mobility” (eg, Box and Block test [BBT] and Moberg Pick-up Test [MPUT]), a mix of “mobility” and “body functions” (eg, Action Research Arm Test [ARAT]), or items pertaining to “self-care” and “domestic life” (eg, Motor Activity Log [MAL]). 24
Given heterogeneous stroke lesions and deficits, identifying which impairments contribute to functional hand use post-stroke is important for patient stratification and development of targeted individualized interventions. Several studies reported maximal grip force in the affected hand as a main determinant of activity capacity post-stroke.25,26 Moreover, release of grip force explained additional variance of recovery in BBT beyond the variance explained by maximal motor output. 27 Active finger extension has also been shown to be a predictor of upper limb recovery. 28 However, these and other conventional clinical scales assess gross manual dexterity, but not fine dexterous manual control which negatively impacts activity capacity and hence represents a non-negligible part of upper limb ADLs.
Technological devices assessing finger kinematics/kinetics can provide more fine-grained measurements of dexterous hand movements. They might not only enhance detection and accuracy of impairment profiling, 19 but also allow for better prediction of post-stroke activity capacity, because they could explain dexterity-dependent variance in activity capacity not captured by conventional clinical scales. In this study, we used the Dextrain Manipulandum to quantify several manual dexterity components 11 (finger force, timing of finger movements, and finger individuation), as well as finger proprioception components (timing and spatial representation) in late subacute/chronic stroke patients and in age-matched healthy controls. We hypothesized that impairments in manual dexterity and finger proprioception would ex-plain variance in post-stroke upper limb activity capacity better than conventional clinical sensorimotor assessments (reflecting global upper limb motor impairments). We expected (1) to observe specific deficits of manual dexterity and finger proprioception in late subacute/chronic stroke patients compared to aged-matched healthy individuals; (2) that step-wise multiple regression including manual dexterity and proprioceptive variables as well as clinical predictors would show that manual dexterity and proprioceptive variables outperform clinical variables in explaining variance in upper limb activity capacity; and (3) that hierarchical linear regression would show that the amount of variance explained, using manual dexterity and proprioceptive variables, would significantly improve well beyond the variance explained by clinical assessments.
Materials and Methods
Participants
The study sample consisted of patients recruited for the DEXTRAIN randomized, single-blinded pilot trial, 29 conducted at the GHU Paris Psychiatrie et Neurosciences hospital (ClinicalTrials.gov NCT03934073). Forty-two late subacute (N = 8) and chronic stroke (N = 36) patients were recruited between 2018 and 2021 for this experimental, cross-sectional study. Sample size was based on that reported in the DEXTRAIN study, 29 however, no power calculation was performed prospectively since this study was exploratory. Inclusion criteria: presence of a single symptomatic stroke dating back >3 months, >18 years old, BBT score between 1 and 52 blocks/minute, no cognitive disorder (Mini Mental State Examination 30 [MMSE] score >25/30). Exclusion criteria: recurrent stroke, presence of cognitive (comprehension) disorder, botulinum toxin treatment <3 months prior to inclusion, any other severe disease. Thirty-two age-matched healthy subjects were also recruited as control group. All participants provided written informed consent. The study, approved by the independent regional ethical committee (CPP Sud-Est I #2017-56), followed the Strengthening the Reporting of Observational Studies in Epidemiology (STROBE) guidelines, 31 complied with good clinical practice guidelines and the Declaration of Helsinki. Table 1 shows demographic data of all participants and clinical details of the stroke patients.
Demographic and Clinical Data.
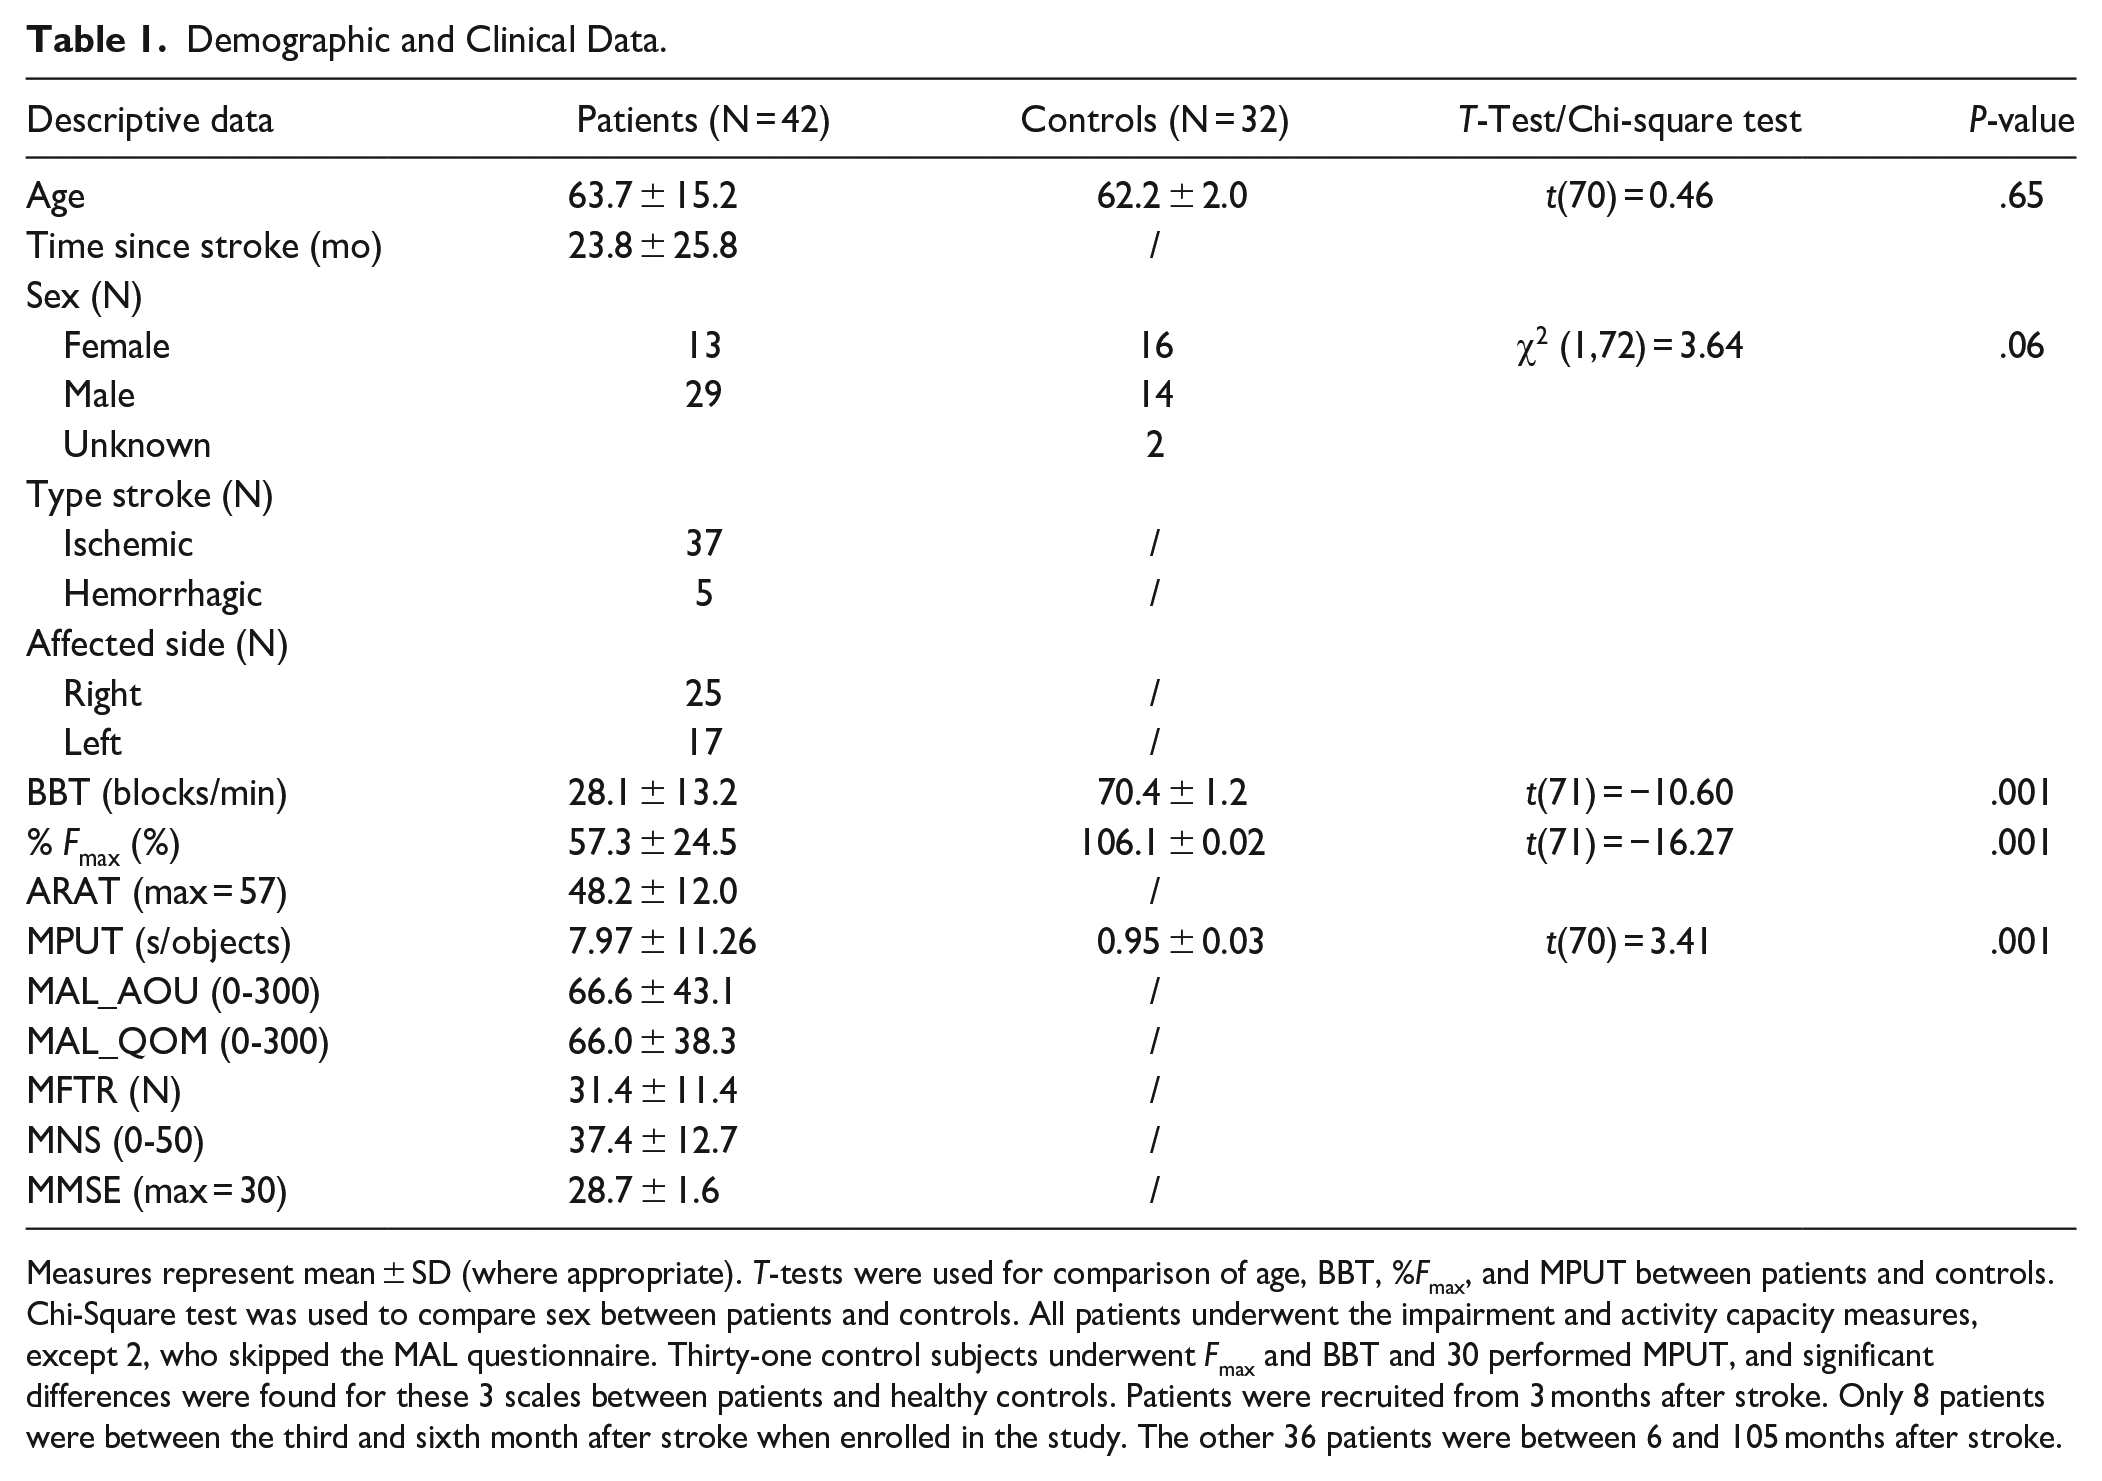
Measures represent mean ± SD (where appropriate). T-tests were used for comparison of age, BBT, %Fmax, and MPUT between patients and controls. Chi-Square test was used to compare sex between patients and controls. All patients underwent the impairment and activity capacity measures, except 2, who skipped the MAL questionnaire. Thirty-one control subjects underwent Fmax and BBT and 30 performed MPUT, and significant differences were found for these 3 scales between patients and healthy controls. Patients were recruited from 3 months after stroke. Only 8 patients were between the third and sixth month after stroke when enrolled in the study. The other 36 patients were between 6 and 105 months after stroke.
Clinical Upper Limb Motor and Sensory Assessments
Maximal grip force (Fmax) was measured using a hydraulic Jamar dynamometer (https://lafayetteevaluation.com/) 11 and calculated as a ratio affected/less affected hand for patients and dominant/non-dominant hand for healthy controls.
Maximal finger tapping rate (MFTR) was measured as number of thumb-to-index taps achieved in 15 seconds. 32
Semmes-Weinstein mono-filament test (MNS) was used to rate light touch sensation of the upper limb (Touch Test Sensory Evaluators, 5 item-kit, North Coast Medical; 5 calibers from 0.07 to 279 g) to measure tactile sensitivity of fingertips of the affected hand. 33
Activity Capacity Measures
Four clinical (performance) measures of upper limb activity capacity were obtained evaluating different aspects of daily activities: Unilateral gross manual dexterity was assessed through the BBT. 34 Self-reported amount of use (MAL_AOU) was assessed through the MAL. 35 Upper limb reach-and-grasp capacities were examined with the ARAT. 36 Precision gripping of small objects was assessed with the MPUT. 37
Dextrain Manipulandum
The Dextrain Manipulandum (https://www.dextrain.com/) was used to evaluate key components of manual dexterity 11 in patients (affected hand) and healthy controls (dominant hand). Constant finger contact with the device was maintained through magnets. Each finger movement involved a 1 cm flexion-extension movement (limited by the Dextrain piston range) corresponding to ~10° flexion and ~10° extension at the metacarpophalangeal joint. 38 Four different tasks (Figure 1) were used, 3 previously established, 11 and 1 new task to measure finger proprioception: (1) Finger Force-Tracking evaluating force control accuracy while tracking ramp-and-hold trajectories. (2) Rhythm Tapping assessing timing of finger movements (auditory cues or memorized). (3) Multi-Finger Tapping measuring the degree of independence of finger movements. (4) Finger Proprioception measuring spatio-temporal aspects of finger (effector) selection in response to proprioceptive cues. Three different proprioceptive conditions were assessed with 25 pseudo-randomized trials recorded per condition (5 trials per finger). In the first condition (PRO), evaluating proprioceptive integration via a motor response, the examiner pressed the piston of 1 finger (without touching the finger) down to the mechanical stop with a standardized velocity, generating a 10° passive finger flexion, while the participant had his/her eyes closed. An auditory beep, given after the passive movement and a standardized delay, indicated the Go signal for the participant to press the cued piston as fast as possible (Figure 1). The second condition (VERB) served as a control condition for potential motor slowing in patients independent of proprioceptive function. The target finger was verbally indicated and with the cued finger the subject had to tap after the auditory Go signal. The third condition (NOMM) probed proprioceptive integration via verbal responses by naming the finger that was cued through a prior passive movement (Supplemental Material).
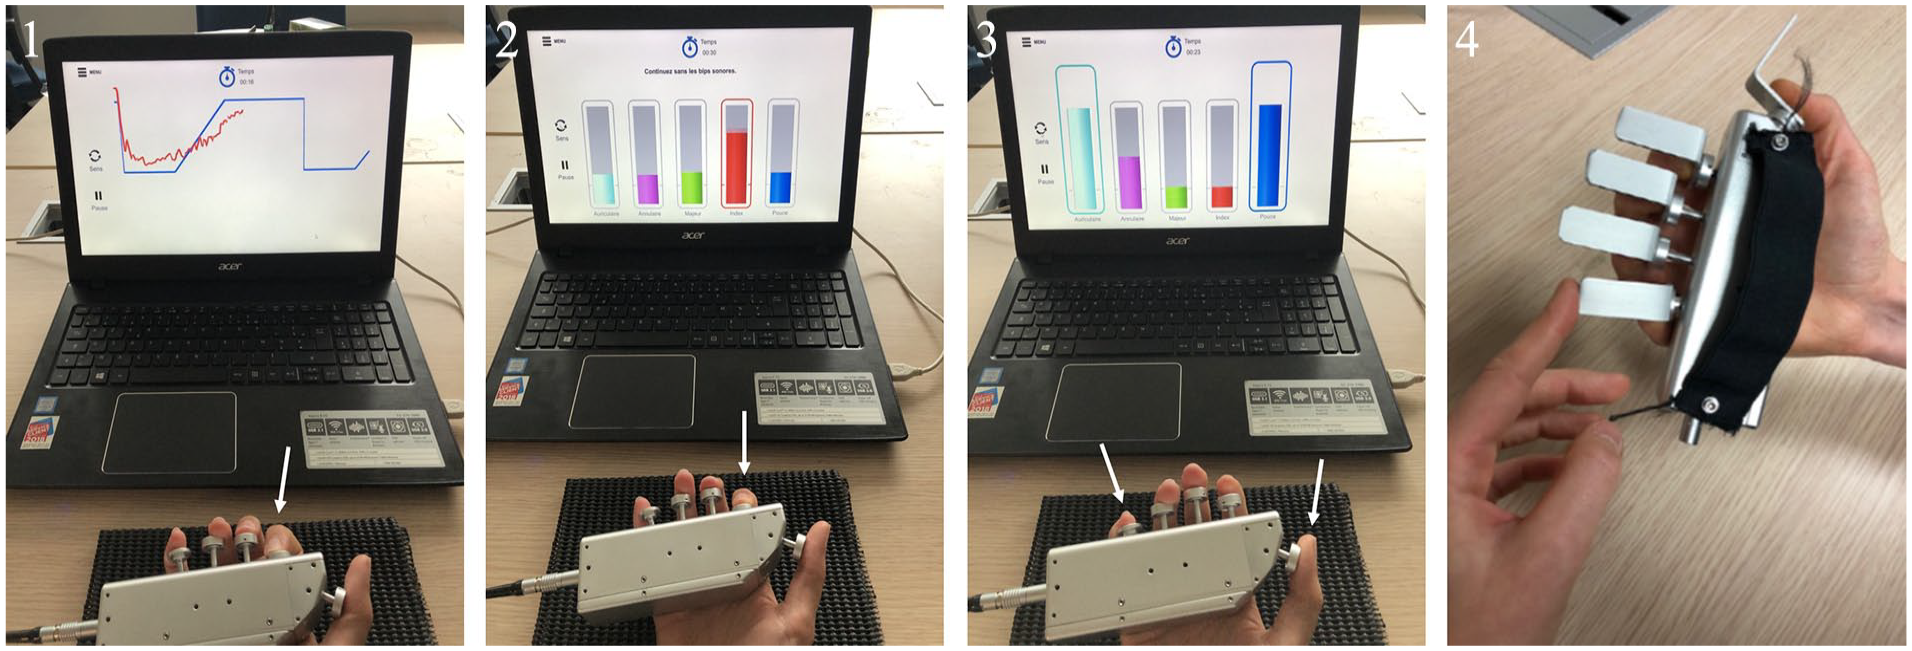
Dextrain Manipulandum tasks. Each finger is positioned on its respective spring-loaded piston. From left to right: (1) Finger Force-Tracking task. The subject tries to match the vertical cursor position (red line representing here real-time force of the index finger) with the target force (blue line). Each trial consisted of a baseline-ramp-hold-and-release force trajectory followed by a pause (resting force = 0 N). (2) Rhythm Tapping task. Subjects try to follow the constant tapping rhythm (here with index finger) given by auditory cues (of 1, 2, or 3 Hz) and then maintain it without cues. (3) Multi-Finger Tapping task. One or (simultaneous) 2 finger taps need be executed according to the visually displayed tap configuration (here thumb + index tap). (4) Proprioception task. PRO condition (without vision): the examinator generates a passive movement of 1 piston and the participant must actively press the corresponding piston as fast as possible after an auditory GO signal. VERB condition: same as PRO, except that the target finger is indicated by verbal instruction.
Data Analysis
Performance measures of the Dextrain Manipulandum tasks were analyzed using MATLAB (v7.5, The MathWorks, Inc., Natick, MA, USA). Our analysis of manual dexterity and finger proprioception comprised various components, such as finger force, movement timing, and individuation for manual dexterity, as well as reaction time and accuracy in identifying cued fingers for proprioception. Examining these components provides a comprehensive assessment of manual dexterity impairments that may explain specific variance in particular assessments of activity capacity.
Analyzed performance measures: Force-Tracking task: baseline flexion force [N], tracking error (root mean square error (RMSE) for the ramp (ramp error) and the hold (hold error) phase [N], 11 duration of force release [ms]. Rhythm Tapping task: mean tap interval [ms], and mean frequency of tapping rate [Hz] measured at 1, 2, and 3 Hz, each time with and without auditory feedback. 39 Multi-Finger Tapping task: finger selectivity [%], finger individuation [%], success rate [%], and the number of unwanted extra finger taps (UEFT) [%]. Finger Proprioception tasks: reaction time (RT) [ms], corresponding to the delay between the auditory beep and the motor response, and number of correct trials (CT) [%]. Overall accuracy and reaction time were averaged across all 5 fingers. To compute the improvement or deterioration in movement performance as a function of proprioceptive cueing, we calculated the relative change between PRO and VERB condition as rel = [(PRO-VERB)/VERB]. This relative change variable was intended to control for potential motor deficits, such as motor slowing, independent of proprioceptive cueing (Supplemental Material).
Statistical Analysis
Statistical analyses were performed using IBM SPSS Statistics (version 28.0.1.1). Descriptive data (Table 1) are presented as mean ± standard deviation (SD). Student t-tests were used to test for group differences in single-level variables, namely scores of clinical scales, 2 Dextrain tasks (Force-Tracking and Multi-Finger Tapping) and the relative change between the 2 conditions from the Finger Proprioception task. Mean differences between groups together with ±95% confidence interval (CI) were calculated (and reported as [lower, upper bound]). One-sample t-tests were used to test for significant difference against zero for the relative measures of proprioception. Repeated measures analysis of variance (rmANOVA) was used to analyze the Rhythm Tapping task with 1 between-group factor (GROUP) and 2 within-subject factors: FREQUENCY (1, 2, and 3 Hz) and CONDITION (with/without auditory cue) after Greenhouse–Geisser correction. Fisher’s Least Significant Difference (LSD) test was used for testing posthoc differences. Mixed ANOVAs were used to analyze separately RT and CT from the Finger Proprioception tasks with 1 between-group factor (GROUP) and 1 within-subject factor: CONDITION (VERB/PRO). Pearson’s correlations were used for univariate analysis between activity capacity measures and each manual dexterity or proprioception performance measure independently, and also between proprioception and manual dexterity measures. False discovery rate was used to correct for multiple comparisons. 40 Multivariate stepwise linear regression and hierarchical linear regression allowed identification of conventional clinical sensorimotor and Dextrain task variables that best explained the variance of activity capacity scores. Only variables that correlated significantly to the activity capacity measure in the univariate analysis at P < .05 were tested. Adjusted R2 are reported to avoid overfitting and were considered significant at P < .05. Absence of collinearity was verified using the variance inflation factor (VIF < 3). 41 To confirm the multiple regression results in all stroke patients (N = 42), we also re-analyzed the data replacing missing data using the MissForest random forest algorithm. 42
Results
Clinical Scales
Clinical scales of upper limb impairment resulted in significantly better scores in healthy controls compared to patients (Table 1).
Finger Force-Tracking Task
About 86% of patients (N = 36) and 100% of the healthy controls (N = 32) performed this task. Baseline flexion force was significantly higher in patients (−0.072 ± 0.10 N) compared to controls (−0.006 ± 0.03 N; t(66) = −3.44; P = .001; Figure 2A) with a mean difference of −0.07 N [−0.1, −0.03]. Patients showed significantly prolonged release duration (325.9 ± 247 ms) compared to controls (175.5 ± 90.6 ms), (t(66) = 3.252; P = .002) with a mean difference of 150.35 ms [58.05, 242.65]. Ramp error was not significantly different between patients (0.4 ± 0.13 N) and controls (0.34 ± 0.1 N; t(66) = 1.843; P = .07), in contrast to hold error (patients: 0.29 ± 0.17 N vs controls: 0.19 ± 0.1 N; (t(66) = 3.017; P = .004), with a mean difference between groups of 0.11 N [0.04, 0.18].
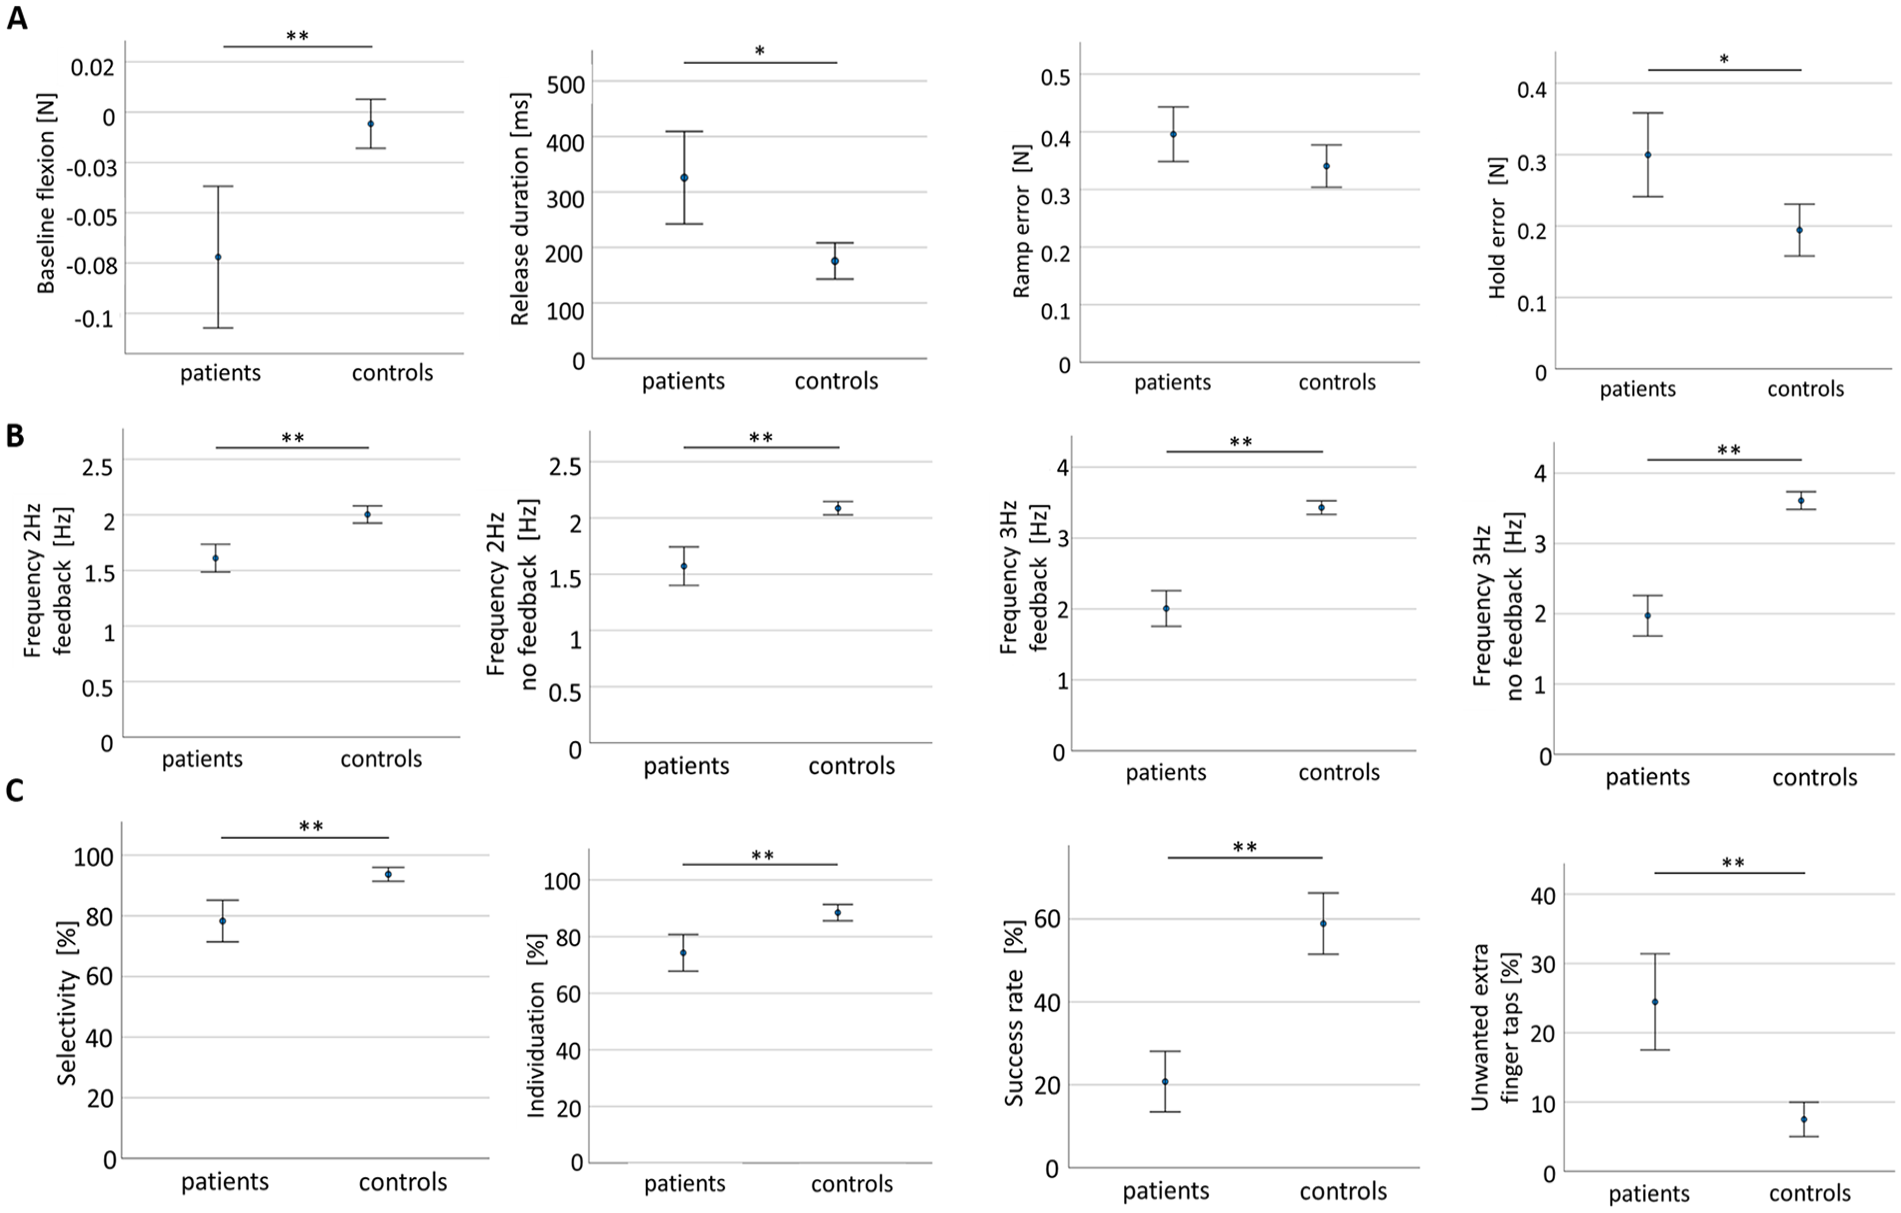
Group comparison between patients and controls for dexterity tasks. Performance in (A). Finger Force-Tracking. (B). Rhythm Tapping. (C). Multi-Finger Tapping. Measures represent mean ± 95% confidence interval.
Rhythm Tapping Task
About 86% of patients (N = 36) and 100% of healthy controls (N = 32) performed this task. The 2-way repeated measures ANOVA revealed a significant main effect of tapping frequency (F(1.169) = 427.1; P < .001; Figure 2B) and feedback (F(1) = 3.99; P = .05). Interaction was found for the frequency × group effect (F(1.169) = 107.03; P < .001). Post-hoc tests revealed a significant group difference at 2 and 3 Hz with significantly slower tapping rates in patients (P < .001; Figure 2B). A significant group × feedback interaction (F(1) = 7.09; P=0.01) was observed with post-hoc tests showing the greatest performance difference at 3 Hz with auditory feedback (patients 2 ± 0.7 4 Hz; controls 3.43 ± 0.26 Hz; P < .001) and without feedback (patients 1.97 ± 0.85 Hz; controls 3.61 ± 0.34 Hz; P < .001; further results, including Post-hoc tests, in Supplemental Material). Compared to controls, patients had slowed rhythm tapping at 2 Hz with feedback (mean difference: −0.39 Hz [−0.54, −0.24]) and without feedback (mean difference: −0.51 Hz [−0.7, −0.33]), almost all stroke patients had slowed tapping at 3 Hz with feedback (mean difference: −1.42 Hz [−1.7, −1.15]) and without feedback (mean difference: −1.63 Hz [−1.96, −1.32]).
Multi-Finger Tapping Task
About 64% of patients (N = 27) and 94% of healthy controls (N = 30) performed this task. Success rate (ability to tap with the finger corresponding to the target finger indicated on the screen), selectivity and UEFT were all significantly different between patients and controls, each with P < 0.001 (Figure 2C). The capacity to select the correct finger (selectivity) was lower in patients (0.78 ± 0.16) than in controls (0.93 ± 0.06; t(52) = −4.786; P < .001) with a mean difference of −0.15 [−0.21, −0.09]. Finger individuation rate was reduced in patients (0.74 ± 0.15) compared to controls (0.88 ± 0.08; t(52) = −4.43; P < .001), with a mean difference of −0.14 [−0.2, −0.08]. Patients also showed a significantly reduced success rate (0.21 ± 0.17) compared to controls (0.59 ± 0.2; t(52) = −7.44; P < .001) with a mean difference of −0.38 [−0.48, −0.28] and had significantly greater number of UEFTs (24.45 ± 16.44) than controls (7.5 ± 6.63; t(52) = 5.16; P < .001; mean difference: 16.96 [10.36, 23.55]).
Proprioception Task
About 64% of patients (N = 27) and 100% of healthy controls (N = 12) performed PRO and VERB conditions (measurement reliability in Supplemental Material). Due to a small sample size for condition NOMM (Supplemental Table 1), main analysis was restricted to PRO and VERB conditions (Supplemental Material for results on NOMM). In patients, the comparison between the affected versus non-affected hand revealed a significant between hand difference for RT and CT in the PRO condition. A significant between hand difference for CT was found in the VERB condition, but not for RT. (Supplemental Material).
The mixed ANOVA for RT revealed a significant main effect of group (F(1) = 25.725; P < .001) with patients showing significant longer RT (926.7 ± 293.9 ms) than controls (644.3 ± 154.7 ms) in PRO condition (B = 282.22 ms [99.14, 465.29]; P = .003, Figure 3A). Similarly in VERB condition, patients had longer RT (965.4 ± 176.7 ms) than controls (683.1 ± 166.2 ms; B = 282.29 ms [160.23, 404.35]; P < .001, Figure 3A). No significant condition effect (F(0.014) = 0.54; P = .47) and no significant interaction for the condition × group effect (F(1) = 0.000; P = .99) were found.
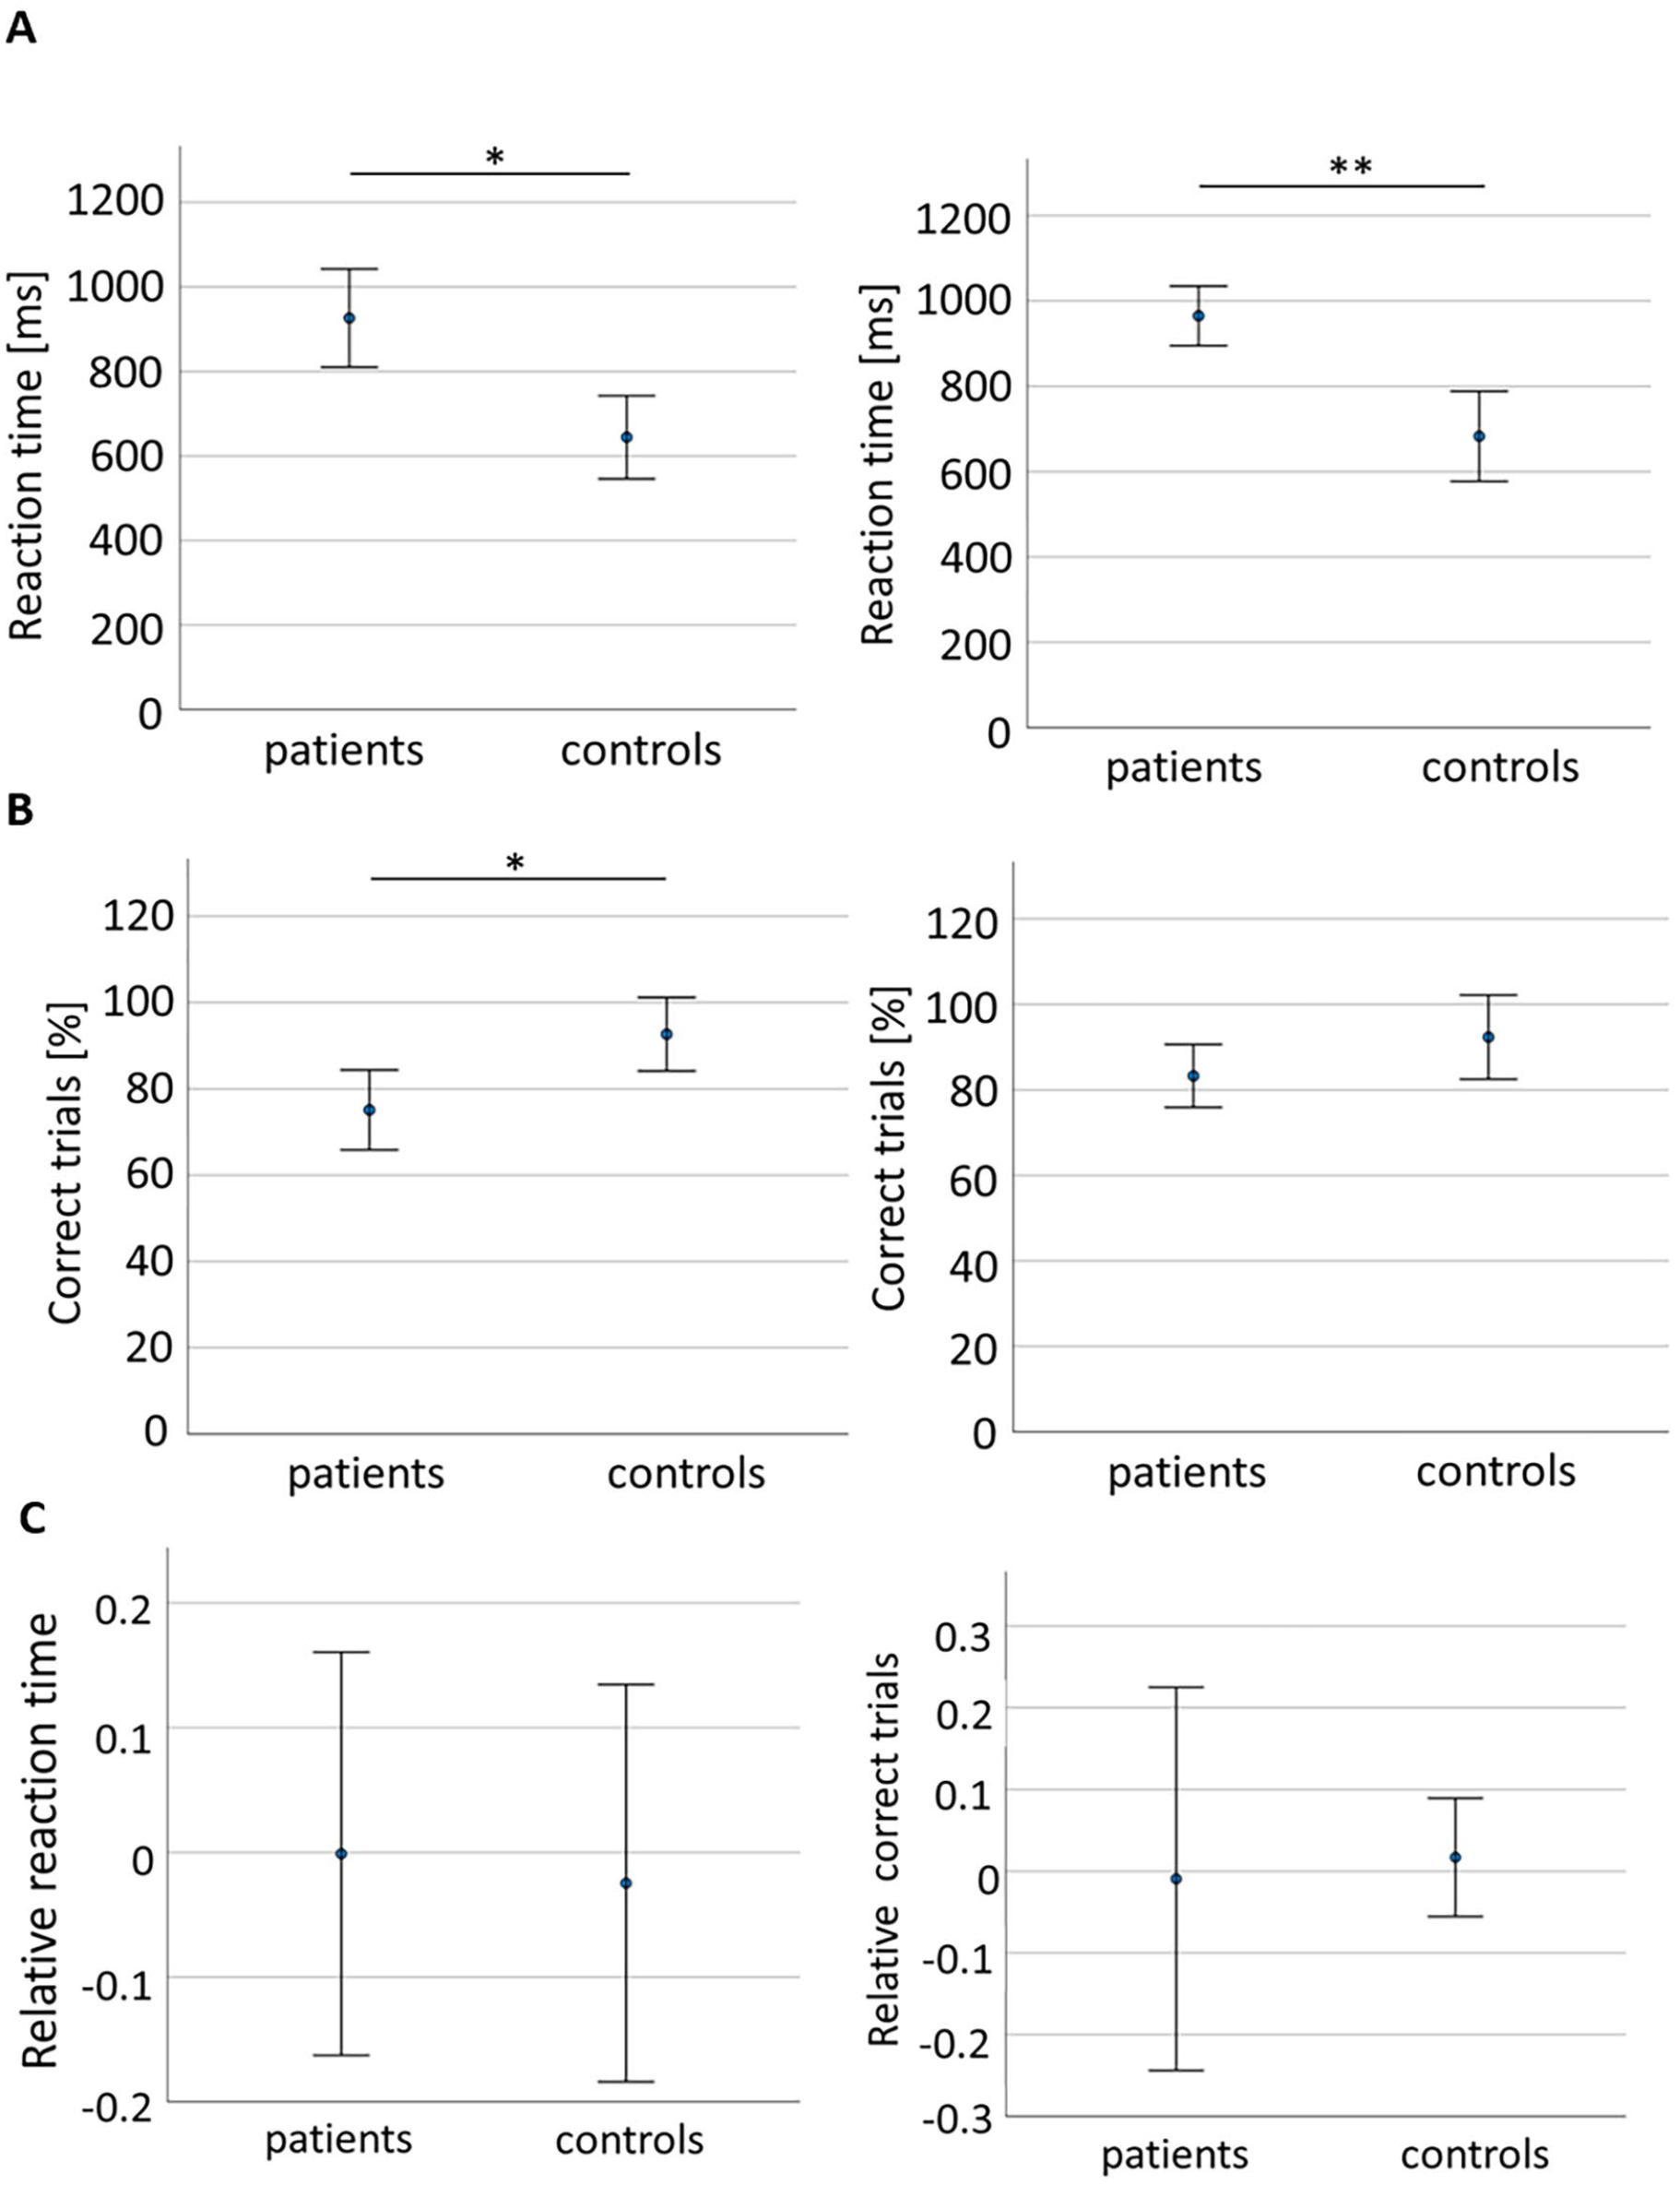
Group comparison between patients and controls for Proprioception tasks. Reaction time in (A). PRO condition (left) and VERB condition (right). Number of correct trials in (B). PRO condition (left) and VERB condition (right). (C). Relative RT, that is, relPRO = (PRO-VERB)/VERB. The mean relative RT was≈0 (patients: −0.001%, controls: −0.02%) and varied by ≈±15% in both groups. Also, number of correct trials showed means≈0 (patients: −0.009%, controls: 0.017%) but varied more in patients (≈±20%) than in controls (≈±10%). Measures represent mean ± 95% confidence interval. Asterisks as in Figure 2.
ANOVA showed a significant main effect of group for CT (F(1) = 5.65; P = .023), significantly lower in patients (0.75 ± 0.23) than in controls (0.93 ± 0.04) in PRO condition (B = −0.18 [−0.32, −0.02]; P = .021), but not in VERB condition (patients: 0.83 ± 0.19 vs controls 0.92 ± 0.15, B = −0.091, P = .15; Figure 3B). No significiant condition effect (F(1) = 1.1; P = .301) or interaction (condition × group) effect (F(1) = 1.29; P = .26) were found.
The relative change (rel, Figure 3C) revealed no significant difference between patients and controls, neither for RT (t(37) = 0.18; P = .86) nor for CT (t(37) = −0.15; P = .88). Both measures were close to zero for patients (t(26) = −0.014; P = .98 for RT and t(26) = −0.08; P = .94 for CT) and controls (t(11) = −0.34; P = .74 for RT and t(11) = 0.52; P = .61 for CT), indicating that there was neither improvement nor deterioration of group performance using the proprioceptive cue (PRO) compared to performance using verbal cueing (VERB).
Univariate Correlation Analysis
Univariate correlations between manual dexterity impairments and activity capacity are shown in Supplemental Tables 2 to 4. Force tracking and rhythm tapping performance were correlated to BBT, MAL, and ARAT scores. Multi finger tapping was correlated to BBT and MAL scores.
Correlations between measures of proprioception and of activity capacity (Supplemental Table 5) revealed 1 significant relation: relRT was correlated to the MPUT score. No significant correlation was found between proprioceptive integration and manual dexterity measures (P > .05). However, a significant correlation was found between the 2 proprioception measures relRT and relCT (R = −.514; P = .006).
Multivariate and Hierarchical Linear Regression Models
We investigated how manual dexterity and proprioception measures, together with conventional impairment scores, explained variance in activity capacity (Table 2). BBT variance was best explained by a model including baseline flexion force and mean tapping frequency at 2 Hz with feedback (adj. R2 = .51). Success rate in Multi-Finger Tapping was the only variable explaining a significant part of the MAL variance (adj. R2 = .46). ARAT variance was partly explained by release duration from the Force-Tracking task and by relRT from Proprioception (adj. R2 = .52). MPUT variance was partly explained by relRT (adj. R2 = .18). In the presence of manual dexterity and proprioceptive variables in the regression, none of the conventional clinical measures added explanatory power. Redoing the analysis including side of lesion as covariate revealed no difference in variance explained or in level of significance. Thus, side of lesion did not affect results.
Stepwise Multiple Regression Models Using Dexterity Measures and Clinical Impairment Scales as Explanatory Variables (Regressors) of the Variance of Activity Capacity as Measured by BBT, MAL_AOU, ARAT, and MPUT.
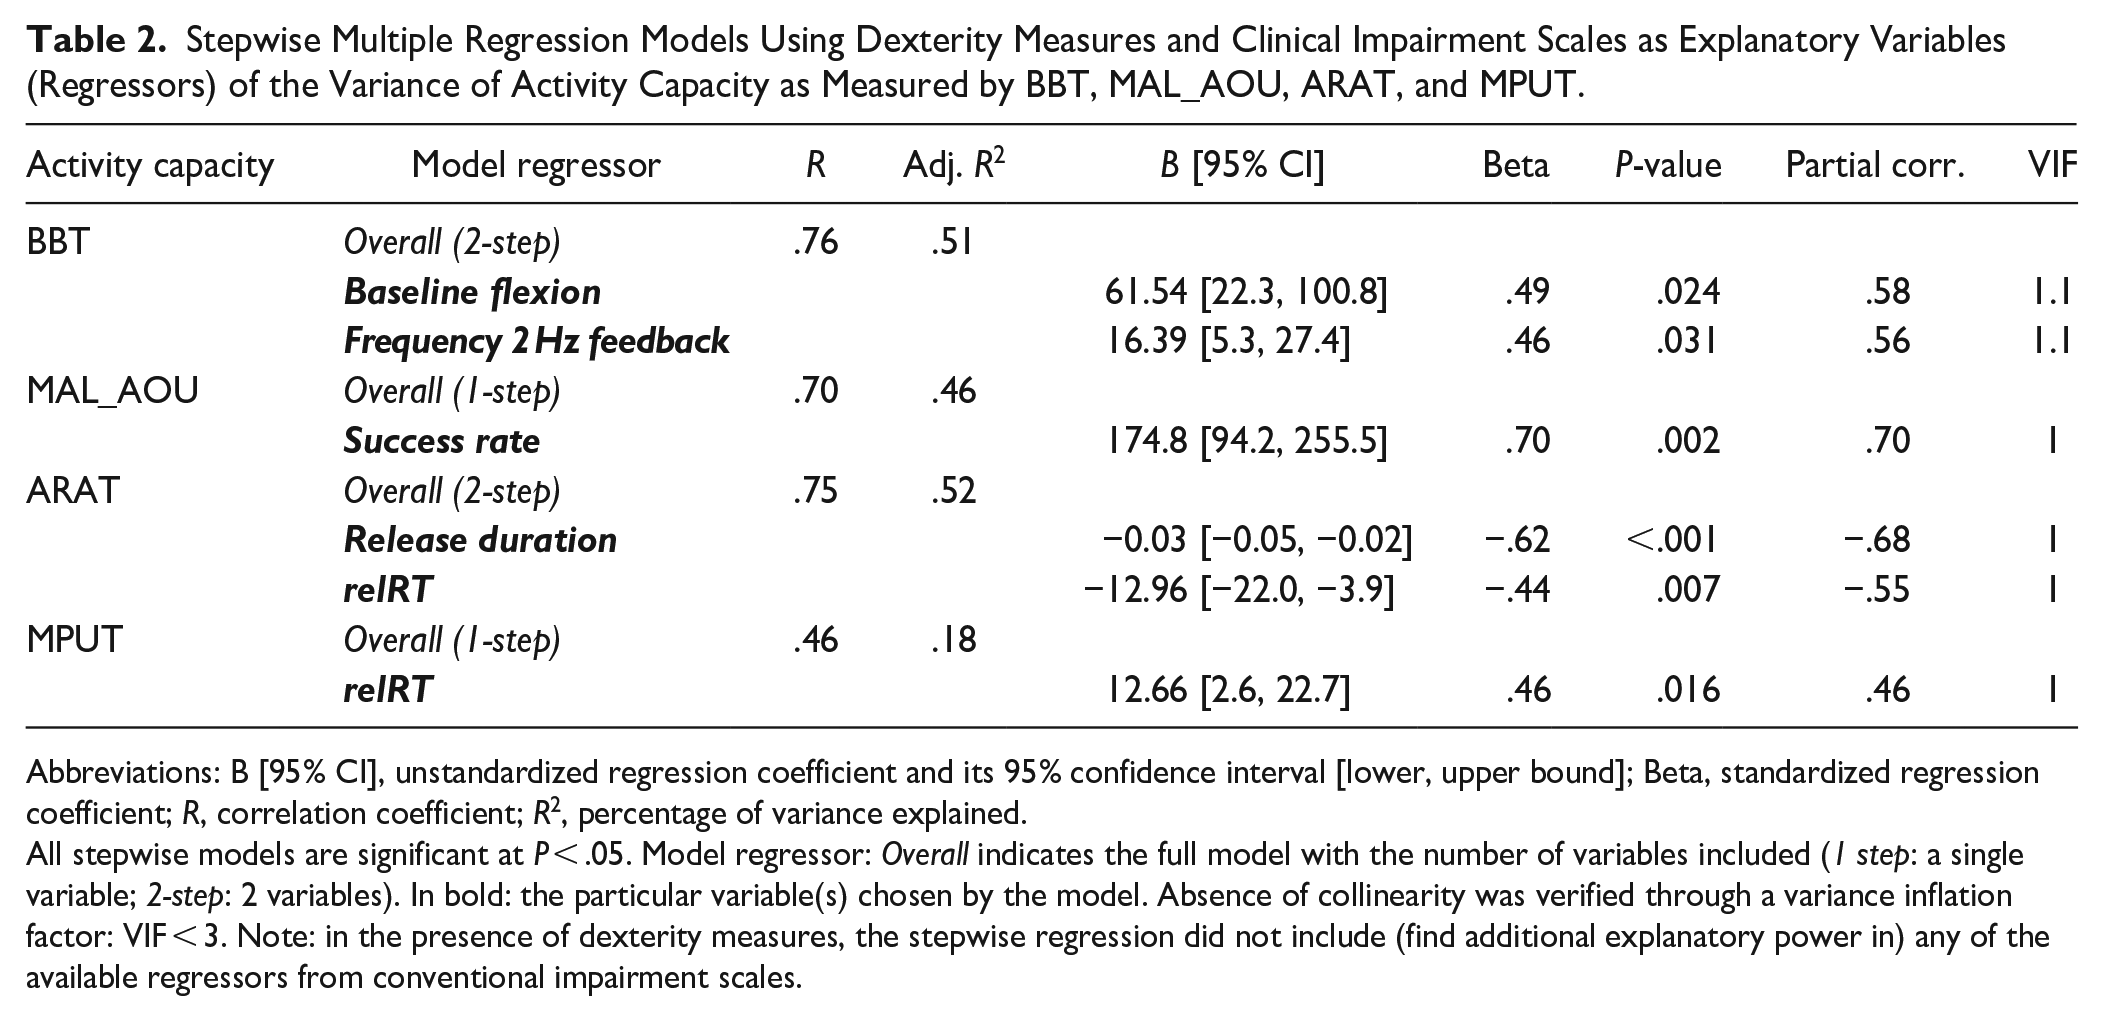
Abbreviations: B [95% CI], unstandardized regression coefficient and its 95% confidence interval [lower, upper bound]; Beta, standardized regression coefficient; R, correlation coefficient; R2, percentage of variance explained.
All stepwise models are significant at P < .05. Model regressor: Overall indicates the full model with the number of variables included (1 step: a single variable; 2-step: 2 variables). In bold: the particular variable(s) chosen by the model. Absence of collinearity was verified through a variance inflation factor: VIF < 3. Note: in the presence of dexterity measures, the stepwise regression did not include (find additional explanatory power in) any of the available regressors from conventional impairment scales.
Hierarchical linear regression models showed that for each activity capacity measure, manual dexterity, and proprioceptive components significantly increased the predictive power compared to conventional scores alone (BBT: R2 Change = .25, P = .001; MAL: R2 Change = .23, P = .003; ARAT: R2 Change = .29, P = .004; MPUT: R2 Change = .12, P = .05; Supplemental Table 6).
Multiple regression analysis in the whole patient sample (N = 42, after replacing missing data) identified the same manual dexterity and proprioception variables as with missing data points (Supplemental Table 7). Additional manual dexterity and proprioception variables explained 0% to 25% more variance in the activity capacity measures (0-2 variables/activity capacity).
For comparison, we identified models explaining variance in activity capacity using only conventional clinical assessments (Table 3). On their own, MFTR, Fmax, or MNS, explained less variance than manual dexterity and proprioception measures. MFTR explained substantial variance of BBT (adj. R2 = .32) and MAL (adj. R2 = .34). Fmax explained some variance of ARAT (adj. R2 = .33), and a small but significant amount of MPUT variance (adj. R2 = .11). Thus, manual dexterity and proprioceptive measures explained more variance in activity capacity than conventional scales alone: BBT (R2 = .51 vs .32), MAL_AOU (R2 = .46 vs .34), ARAT (R2 = .52 vs .33), and MPUT (R2 = .18 vs .11).
Stepwise Multiple Regression Models Using Only Clinical Impairment Scales as Explanatory Variables (Regressors) of the Variance of Activity Capacity as Measured by BBT, MAL_AOU, ARAT, and MPUT.
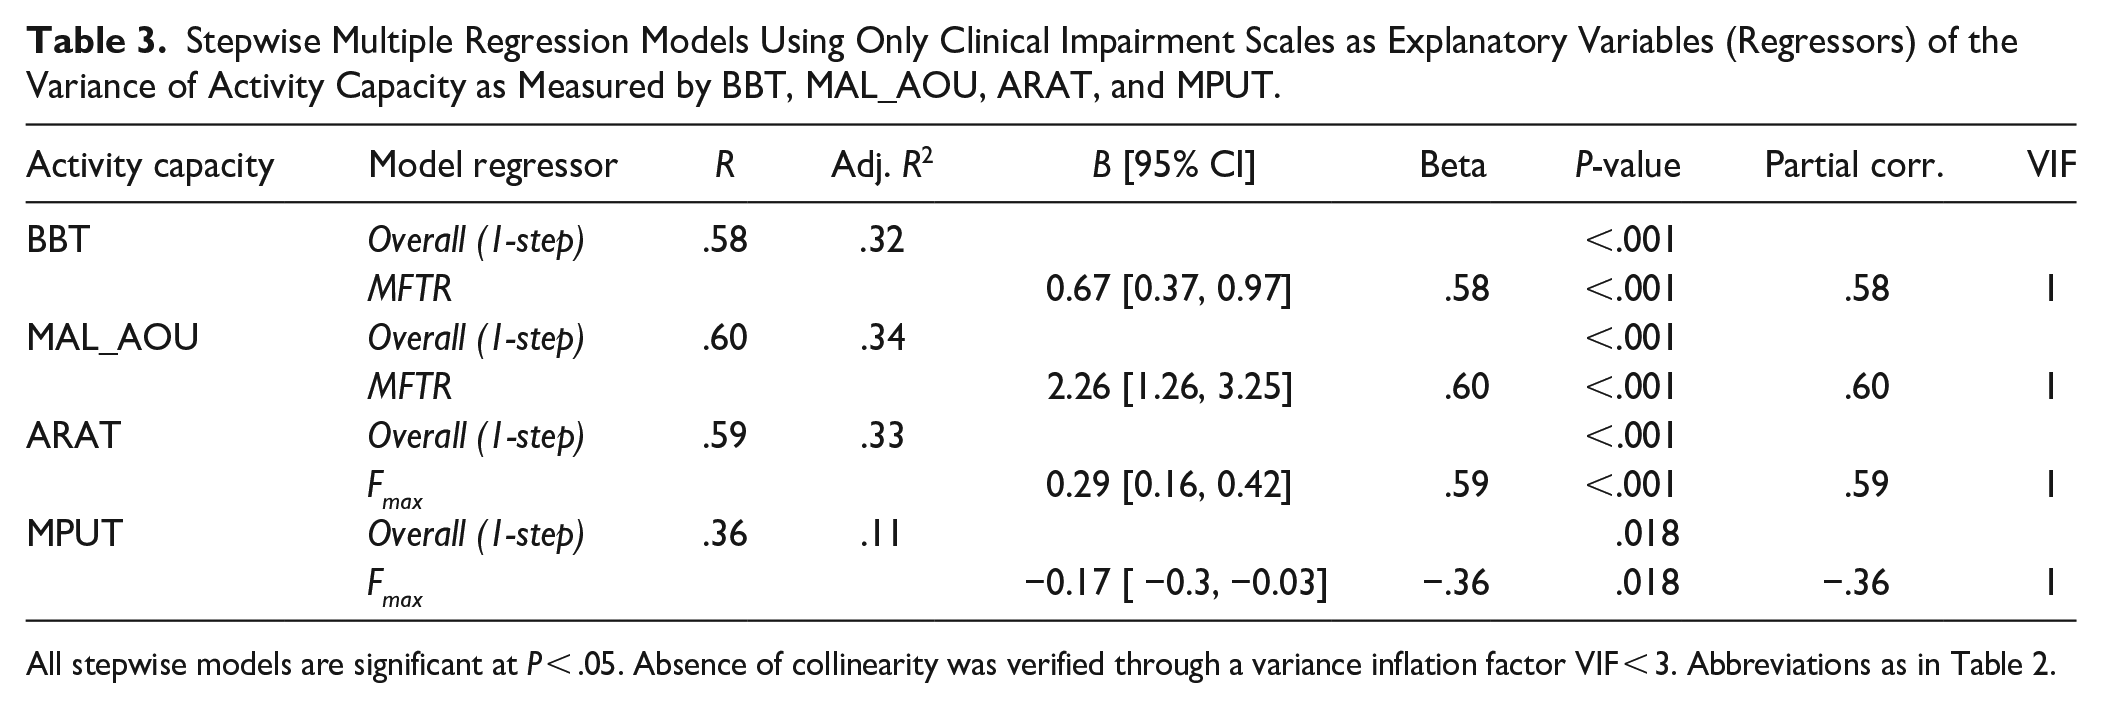
All stepwise models are significant at P < .05. Absence of collinearity was verified through a variance inflation factor VIF < 3. Abbreviations as in Table 2.
Regression models with only Fmax (Supplemental Table 8) were tested as comparison to previous studies22,43 and were found to explain comparatively less variance for BBT (adj. R2 = .22) and for MAL (adj. R2 = .21).
Discussion
We showed that fine-grained technological measures (components) of manual dexterity and finger proprioception explain more variance of activity capacity limitations than conventional clinical assessments of sensorimotor upper limb impairments. Manual dexterity and proprioception impairments were present in late subacute and chronic hemiparetic stroke patients, and the largest variance of activity capacity was explained by these impairments. When manual dexterity and proprioceptive components were included, conventional impairment measures did not capture unique variance in activity capacity.
A New Task to Assess Proprioception With the Dextrain Manipulandum
We developed a new task to assess deficits of proprioception. Analysis of measurement accuracy showed similar variability across trials (CV) between patients and controls (Supplemental Material). We devised 3 conditions to compare proprioceptive integration independent of motor slowing: PRO for proprioceptive cueing of a motor response, VERB for verbal cueing of a motor response, and NOMM for proprioceptive cueing of a verbal response. Even though only 14 patients were evaluated in the NOMM condition, a significant difference was found between controls and patients. Patients showed a correlation between PRO and NOMM conditions, providing cross-validation and suggesting a common underlying neural process of proprioceptive integration that evokes a motor and a verbal response.
In patients, the affected (paretic) and less affected hand were tested for impairments in finger proprioception. The PRO condition revealed proprioceptive deficits for reaction time and number of correct trials in the affected hand, but not in the less affected hand. In contrast, there was no between hand difference in reaction time in the VERB condition, which might be explained by bilateral audio-motor processing (likely more robust to lesions than more lateralized sensorimotor processing). 44
Multi-Component Characterization of Manual Dexterity and Proprioception Impairments in Stroke
Compared to conventional assessments, tasks distinguishing various components of manual dexterity can provide complementary information on hand function impairments post-stroke.11,45 In line with earlier reports,11,27,39 patients were impaired in force tracking and showed deficient (slower) release of force, that is, insufficient voluntary muscular relaxation. Frequent performance deficits in the temporal tapping task (slowed tapping frequency) were also observed, confirming reduced thumb-index tapping cadence after stroke. 46 This might in part be related to reduced finger extension post-stroke 47 and/or to increased baseline flexor tone (in Force-Tracking). Finger individuation, expressed by lower success rate and finger selectivity, was decreased, as previously described.8,11,48,49
Impaired finger proprioception was previously found in stroke patients. 50 In the present study, patients also had slowed and less correct finger tapping responses to proprioceptive and verbal cues. Nonetheless, the relative proprioceptive measure, representing the proprioceptive/auditory gain, was similar in patients and controls (Figure 3C), suggesting that both proprioceptive and verbal cueing may rely (in part) on common mechanisms of sensorimotor integration and depend on the integrity of parieto-frontal networks. 51
Differential Manual Dexterity and Proprioception Impairments Contribute to Upper Limb Activity Capacity
Multivariate models explaining most variance in post-stroke activity capacity included manual dexterity and proprioceptive components, but not clinical scores. BBT was best explained by performance deficits in 2 manual dexterity variables: by force exerted during the baseline period (Force-Tracking task), and by tapping frequency (Rhythm Tapping task). These 2 components may be important for BBT performance in order to maintain a task-relevant tonus and enable rapid hand and finger movements, including finger extension. 48
The best model for explaining variance of the MAL score included degree of finger individuation. A previous study showed that gross manual dexterity (BBT) is a valuable predictor of the MAL. 52 Our results extend these findings and demonstrate that individuated finger movements, most likely implemented through remaining corticospinal projections, 8 are an essential manual dexterity component contributing to the patients’ ability to perform ADL.52,53
The variance of the ARAT was best explained by 2 variables: release duration (Force-Tracking) and relRT (Proprioception). First, it has recently been shown that the appropriate release of power grip force explained a significant part of variance of recovering the ability to grasp and manipulate everyday objects post-stroke, and that this most likely reflects the brain’s capacity to inhibit motor commands. 17 Similarly, in the present study, the ability to release index finger force explained significant variance of ARAT scores. Second, and consistent with our results on finger proprioception, it has previously been shown that proprioceptive deficits correlate negatively with ARAT scores 53 and that upper limb proprioceptive training in stroke patients can improve ARAT scores, 54 indicating that the severity of proprioceptive deficits is negatively associated with functional abilities.
Variance in the MPUT was explained by a single proprioceptive component, consistent with the essential role of finger proprioception for precision gripping and manipulation.18,40,55 Nonetheless, the absence of manual dexterity components as explanatory variables was somewhat unexpected, since the MPUT requires both manual dexterity and functional sensibility to control fine thumb and index finger movements. However, the more specific control of thumb-index precision grip to pick up and release small objects might not correlate with force control, finger individuation, and timing averaged over all 5 fingers.
The hierarchical linear regression showed significantly increased percentage of variance explained by manual dexterity and proprioceptive variables, indicating that these components can significantly explain unique variance associated with all 4 upper limb activity capacity measures.
Models including only conventional clinical assessments of upper limb impairments explained less variance in activity capacity. BBT and MAL variance were both partly explained by Maximal finger tapping rate, which captures speed of alternating finger-thumb flexion/extension, a predictor of ADL. 56 MFTR may relate to picking up blocks with the fingers and to ADL rating, both related to precision grip function. Moreover, ARAT and MPUT variances were partly explained by maximal power grip force (Fmax): the ability to generate considerable motor output (ARAT force and movement items) is most likely responsible for the relation to ARAT scores, 57 whereas the need for fine, adjustable finger movements, requiring low forces to pick up small objects, may by why Fmax only explained 11% of MPUT variance. However, compared to previous studies,26,43 we observed generally less variance explained by Fmax alone, possibly due to power grip being relatively less affected post-stroke and requiring less cognitive involvement. 58
Together, our results demonstrated that (1) dexterity measures contribute specifically to BBT and MAL scores, confirming that dexterous manual control complements gross (whole hand) movements typically involved in these 2 activity capacity scales. That (2) both manual dexterity and proprioceptive measures contribute to the ARAT, which combines gross and finer items as well as dexterous and proprioceptive capacities. And that (3) proprioceptive measures contribute specifically to the MPUT, which requires the finest hand and finger movements among the evaluated scales.
Our models show that combining measures of manual dexterity (control of force, timing, and individuation) and of proprioception explains more inter-subject variance in hand function than using them separately, 58 very likely because these measures express distinct control functions relying partly on separate neural substrates of recovery.27,45,51
A substantial part of the variance in activity capacity remained unexplained in our models, which may be due to factors not measured in this study, but that have previously been shown to be determinants for upper limb function (eg, corticospinal tract injury or cognitive impairments). 17 Inclusion of these and the present measures could clarify, in future studies, their respective contribution to activity capacity in stroke.
Limitations
First, a larger sample size might have increased statistical precision. However, the models revealed significant and consistent findings when including/excluding conventional assessments of impairment and showed low VIF scores (absence of collinearity). Sample size was non homogenous across tasks, conditions, and regression models (smallest for the proprioception NOMM condition), which might have biased the results. This was due to several reasons: task feasibility (difficulty), nonattendance due to lack of time, coronavirus COVID-19 restrictions, or other external factors. Analysis with missing versus imputed data (Supplemental Table 7) did not reveal differences. Second, we included late subacute and chronic hemiparetic stroke patients. Whether similar results pertain to earlier acute and sub-acute cases deserves specific studies. Third, subclinical attentional deficits may have biased performance in the visuomotor Dextrain tasks, 57 although no participant complained of task-related visuo-attentional problems. Unlike the patients, healthy individuals were not assessed for cognitive impairment (MMSE). Fourth, reliability of manual dexterity and finger proprioception measures has not been established. Their measurement error may have biased results. Nonetheless, in the novel finger proprioception task, reproducibility of passive movements was assured by mechanical constraints and standardized stimulus velocity and amplitude, resulting in similar variability across groups (Supplemental Materials). MPUT reliability in stroke is also lacking. Fifth, patients were not clinically screened for proprioceptive deficits preventing testing of association with our measures. 59
Conclusion
The results indicate that specific dexterity and proprioception impairments impact upper limb activity capacities in distinct manners. These impairments account for basic functions beyond those attained with conventional clinical assessments of upper limb sensorimotor impairments. Gross gripping function (BBT) was explained by impaired force generation and slowed tapping speed. Reported hand use (MAL) was best explained by impaired finger individuation. More refined motor control, partially reflected by the ARAT, was explained by less impaired release of force and finger proprioception. Precision grip function (MPUT) was best explained by finger proprioception. For all measures of activity capacity, the degree of variance explained was significantly greater when including dexterity and proprioception variables to the regression model. When considering impairments that contribute to activity capacity after stroke, an assessment of impairments of manual dexterity and finger proprioception would be advantageous. Manual dexterity and finger proprioception measures could enhance precision of post-stroke hand impairment profiling and pave the way for personalized therapy.
Supplemental Material
sj-docx-1-nnr-10.1177_15459683241245416 – Supplemental material for Post-Stroke Impairments of Manual Dexterity and Finger Proprioception: Their Contribution to Upper Limb Activity Capacity
Supplemental material, sj-docx-1-nnr-10.1177_15459683241245416 for Post-Stroke Impairments of Manual Dexterity and Finger Proprioception: Their Contribution to Upper Limb Activity Capacity by Coralie van Ravestyn, Eloïse Gerardin, Maxime Térémetz, Sonia Hamdoun, Jean-Claude Baron, David Calvet, Yves Vandermeeren, Guillaume Turc, Marc A. Maier, Charlotte Rosso, Jean-Louis Mas, Lucile Dupin and Påvel G. Lindberg in Neurorehabilitation and Neural Repair
Footnotes
Acknowledgements
We thank the “Délégation à la Recherche Clinique et à l’Innovation” (DRCI) and the Clinical Research Center (CRC) of GHU Psychiatry and Neuroscience hospital of Paris for their help in conducting this study.
Supplementary material for this article is available on the Neurorehabilitation & Neural Repair website along with the online version of this article.
Author Contributions
Coralie van Ravestyn: Formal analysis; Investigation; Visualization; Writing—original draft; Writing—review & editing. Eloïse Gerardin: Conceptualization; Data curation; Investigation; Methodology. Maxime Térémetz: Conceptualization; Data curation; Funding acquisition; Methodology; Resources; Software. Sonia Hamdoun: Project administration; Resources. Jean-Claude Baron: Project administration; Resources; Validation. David Calvet: Project administration; Resources. Yves Vandermeeren: Supervision. Guillaume Turc: Formal analysis; Project administration; Resources; Validation. Marc A. Maier: Project administration; Supervision; Validation; Writing—review & editing. Charlotte Rosso: Project administration; Resources. Jean-Louis Mas: Project administration; Resources; Supervision. Lucile Dupin: Conceptualization; Data curation; Funding acquisition; Investigation; Methodology; Resources; Software; Supervision; Validation. Påvel G. Lindberg: Conceptualization; Funding acquisition; Investigation; Methodology; Project administration; Resources; Software; Supervision; Validation; Writing—review & editing.
Declaration of Conflicting Interests
The author(s) declared the following potential conflicts of interest with respect to the research, authorship, and/or publication of this article: MT, MAM, and PGL have patented the method for multidimensional measurement of manual dexterity (WO2016184935A3). MT and PGL are founding members of start-up company Dextrain (started in 2021) who owns the commercial rights. MT now works for the start-up full-time. PGL, head of the scientific board, reports no financial gain in advising the company. CR is a member of the scientific board of the company but receives no financial benefits. The other authors report no financial interests or potential conflicts of interest.
Funding
The author(s) disclosed receipt of the following financial support for the research, authorship, and/or publication of this article: This study was supported by grants from Erganeo (University Paris Cité innovation promotion authority) and from the French Stroke Research Foundation (Fondation pour la Recherche sur les AVC).
References
Supplementary Material
Please find the following supplemental material available below.
For Open Access articles published under a Creative Commons License, all supplemental material carries the same license as the article it is associated with.
For non-Open Access articles published, all supplemental material carries a non-exclusive license, and permission requests for re-use of supplemental material or any part of supplemental material shall be sent directly to the copyright owner as specified in the copyright notice associated with the article.