
Abstract
Background
Atlas-based voxel features have the potential to aid motor outcome prognostication after stroke, but are seldom used in clinically feasible prediction models. This could be because neuroimaging feature development is a non-standardized, complex, multistep process. This is a barrier to entry for researchers and poses issues for reproducibility and validation in a field of research where sample sizes are typically small.
Objectives
The primary aim of this review is to describe the methodologies currently used in motor outcome prediction studies using atlas-based voxel neuroimaging features. Another aim is to identify neuroanatomical regions commonly used for motor outcome prediction.
Methods
A Preferred Reporting Items for Systematic Reviews and Meta-Analyses protocol was constructed and OVID Medline and Scopus databases were searched for relevant studies. The studies were then screened and details about imaging modality, image acquisition, image normalization, lesion segmentation, region of interest determination, and imaging measures were extracted.
Results
Seventeen studies were included and examined. Common limitations were a lack of detailed reporting on image acquisition and the specific brain templates used for normalization and a lack of clear reasoning behind the atlas or imaging measure selection. A wide variety of sensorimotor regions relate to motor outcomes and there is no consensus use of one single sensorimotor atlas for motor outcome prediction.
Conclusion
There is an ongoing need to validate imaging predictors and further improve methodological techniques and reporting standards in neuroimaging feature development for motor outcome prediction post-stroke.
Introduction
The development of stroke recovery prediction models can potentially transform stroke rehabilitation practices for the better but remains a challenge. 1 Stroke causes a variety of impairments, of which motor impairment is the most common. 2 Therefore, many prediction models focus on aspects of motor outcome. The neuroanatomical location of a stroke and its effects on brain connectivity are important features in stroke recovery prediction.3,4 Despite this, a review of 13 motor outcome prediction models found that only 3 considered specific neuroimaging features as a predictive variable. 5 To develop more accurate prediction models, it is imperative to consider neuroimaging features and how to implement them into the development pipeline.
Several measures can be derived from neuroimaging, including voxel-based, diffusion, and connectivity features. This review will focus primarily on voxel-based features, meaning that the measures are direct measurements of neuroimaging voxel data such as intensity and location. Voxel-based features can be further sub-divided into data-driven features or atlas-based voxel features.6,7 Data-driven features refers to techniques such as voxel lesion symptom mapping, where statistical analysis methods are used to find specific relationships between a clinical outcome and imaging data. While it may appear to be that voxel lesion symptom mapping may be superior in predictive performance to atlas-based voxel features, further validation is required.7,8 This is because voxel lesion symptom mapping methods often suffer from the “curse of dimensionality,” where model accuracy may be inflated by overfitting as every voxel in an image can be considered a feature. 9 While it is possible to reduce the number of features using feature reduction methods such as principal component analysis, the interpretability of the new features can be challenging. 7 Atlas-based voxel features quantify the interactions between lesions and specific brain atlases or regions, such as the spatial overlap between the lesion and the corticospinal tract. Therefore, atlas-based voxel features use a priori knowledge such as parcellations of the brain into previously defined units. Notably, data-driven feature-reduced features or atlas-based voxel features can result in different and sometimes conflicting results. 10
When looking at atlas-based voxel features, the pipeline for quantifying these types of voxel-based features has many variable components, such as image acquisition, lesion segmentation, image normalization, atlas selection or creation, and lesion quantification. Each step can be approached in different ways, which could hinder the interpretability of the effectiveness of different prediction models. Therefore, it is important to identify trends and variations in methods in order to move towards a better understanding of existing methodologies for atlas-based voxel feature implementation in prediction models.
Objectives
The primary aim of this review is to describe the methodologies currently used in studies that predict motor outcomes after stroke using atlas-based voxel features. The secondary aim of this review is to identify neuroanatomical regions commonly used to predict motor outcomes after stroke.
Methods
Search Strategy
OVID Medline and Scopus electronic databases were systematically searched for all English language studies with publication/indexing dates up to 24 March 2022 using the following search terms:
Scopus: (TITLE-ABS-KEY (stroke) AND TITLE-ABS-KEY (motor OR “upper limb” OR “lower limb” OR gait OR mobilization) AND TITLE-ABS-KEY (recovery OR rehabilitation) AND TITLE-ABS-KEY (predict*)), OVID MEDLINE: (Hemorrhagic Stroke/or Stroke/OR Embolic Stroke/OR Thrombotic Stroke/ OR stroke.mp. OR Stroke, Lacunar/or Ischemic Stroke/) AND (motor.mp. OR limb.mp. OR Extremities/OR Gait/OR gait.mp. OR mobilisation.mp.) AND (recovery.mp. OR Rehabilitation/ or Rehabilitation.mp. or Stroke Rehabilitation/) AND (predict.mp. OR prediction.mp.).
Search results were collated on Mendeley for duplicate removal and then screened by title and abstract by 1 author (J.Y.) for experimental studies that predicted motor outcomes after stroke using atlas-based voxel features with clinically acquirable neuroimaging modalities. atlas-based voxel features included any features that quantified an interaction between lesion voxels and an atlas. Thus, studies that used only diffusion metrics, such as fractional anisotropy, were excluded. The included modalities were non-contrast computed tomography (CT), T1- and T2-weighted magnetic resonance imaging (MRI), and diffusion-weighted imaging (DWI). All other imaging modalities such as functional MRI or high angular resolution diffusion imaging were excluded. Other exclusion criteria were non-English studies, reviews, case series, and dissertations.
Data Extraction
Key methodological details were extracted based on the CHecklist for critical Appraisal and data extraction for systematic Reviews of prediction Modeling Studies. 11 This included the data source, a brief description of participants, the primary prediction outcome and timepoint, predictor type, sample size, statistical analysis method employed and the results, and whether out-of-sample validation was done. Predictor type was categorized for each feature as either imaging, or other (eg, biochemical and biophysiological). Notably, only the analyses related to atlas-based voxel features were extracted from studies that performed multiple analyses. Strokes were classified as acute within 2 weeks of onset, subacute between 2 weeks and 6 months from onset, and chronic when more than 6 months since onset.
One author (J.Y.) recorded details of the neuroimaging analysis pipeline from each article. Details of the imaging modality, acquisition details, image normalization, lesion segmentation, region of interest determination, and imaging features were documented. The image acquisition details for each study was classified as being reported in full detail, partial detail, or no detail, based on the Committee On Best Practice In Data Analysis and Sharing (COBIDAS) reporting standards. 12 To receive a full detail classification, a study was required to report all of the mandatory COBIDAS standards, that is, special accommodations, scanner name, coil, pulse sequence, imaging type, sequence and imaging parameters, phase encoding, and brain coverage. Studies which reported any acquisition details in addition to the imaging modality were classified as partial detail, while studies which only reported the imaging modality were classified as no detail. Since there are no standard reporting guidelines for CT image acquisition details, we simply documented whether CT studies did or did not report any image acquisition details. Lastly, we documented the sensorimotor regions pertaining to any atlas-based voxel features used in prediction models of motor outcomes after stroke.
Results
Search Results
A Preferred Reporting Items for Systematic Reviews and Meta-Analyses (PRISMA) flow diagram was constructed (Figure 1). 2395 studies were retrieved from the electronic databases and 292 duplicates were automatically removed via Mendeley. One duplicate was additionally removed via manual inspection. Next, 2031 studies were removed via title and abstract screening. Full-text evaluation was performed on the remaining 71 studies, which excluded another 54 studies. The remaining 17 studies were included for review, and are summarized in Tables 1 and 2.13 -29
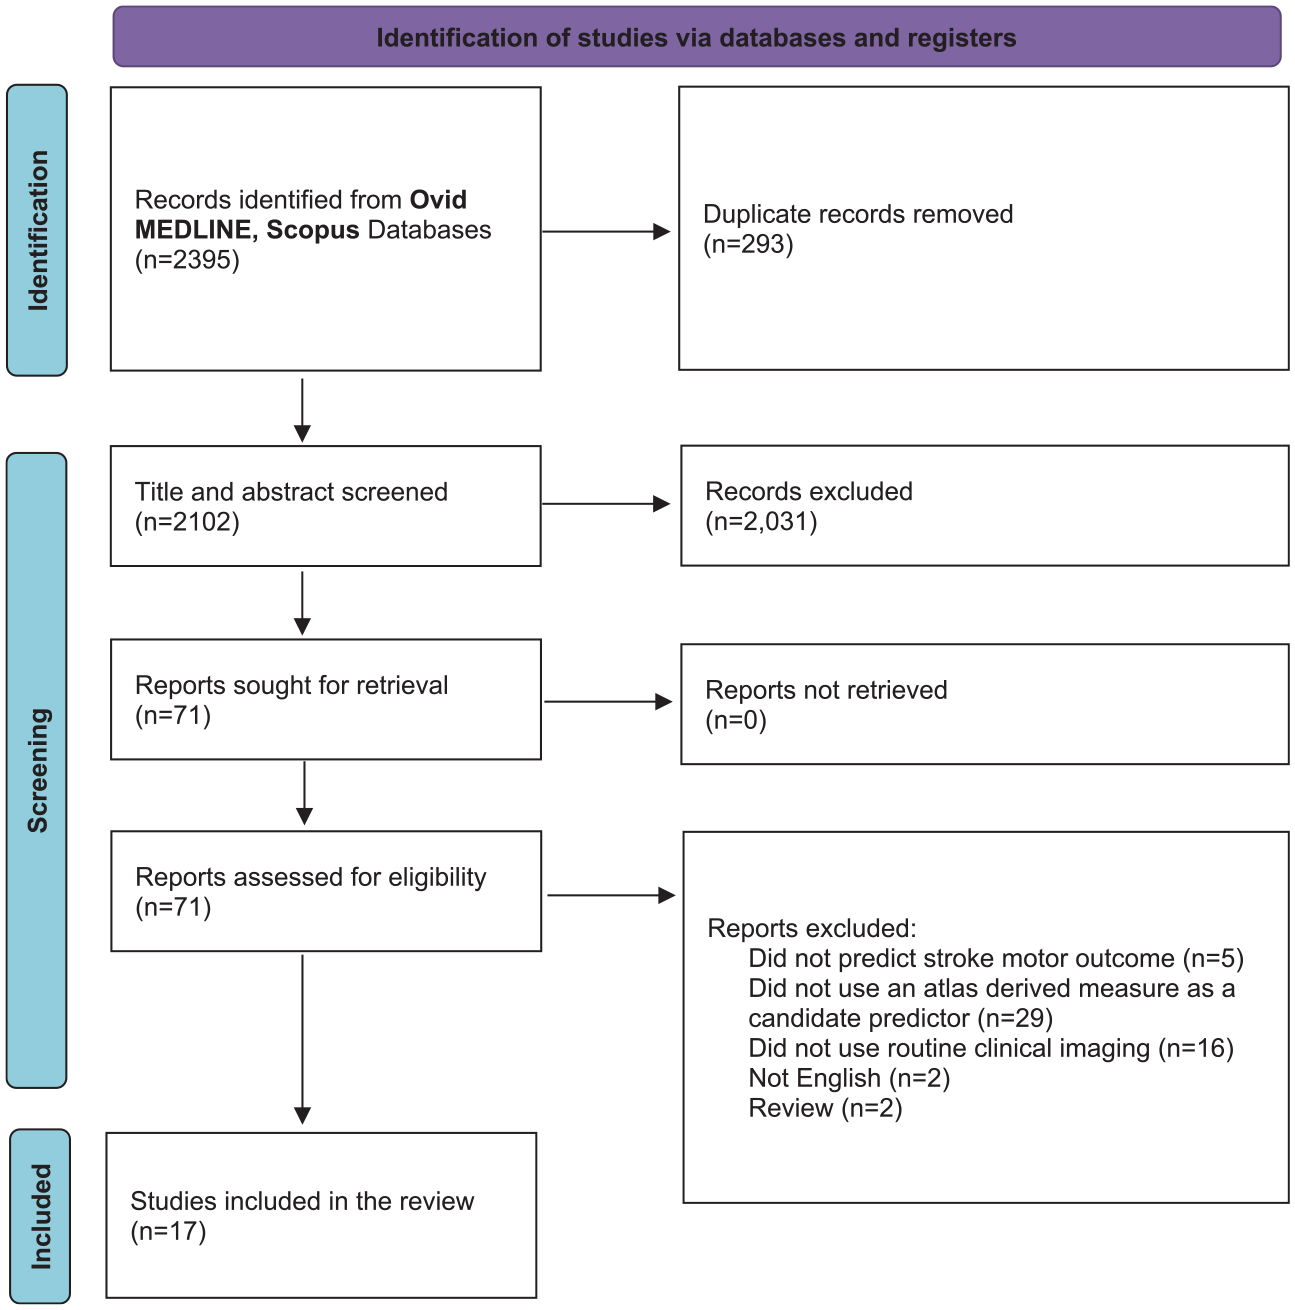
A PRISMA flow diagram of the literature.
Key Details of Included Studies.
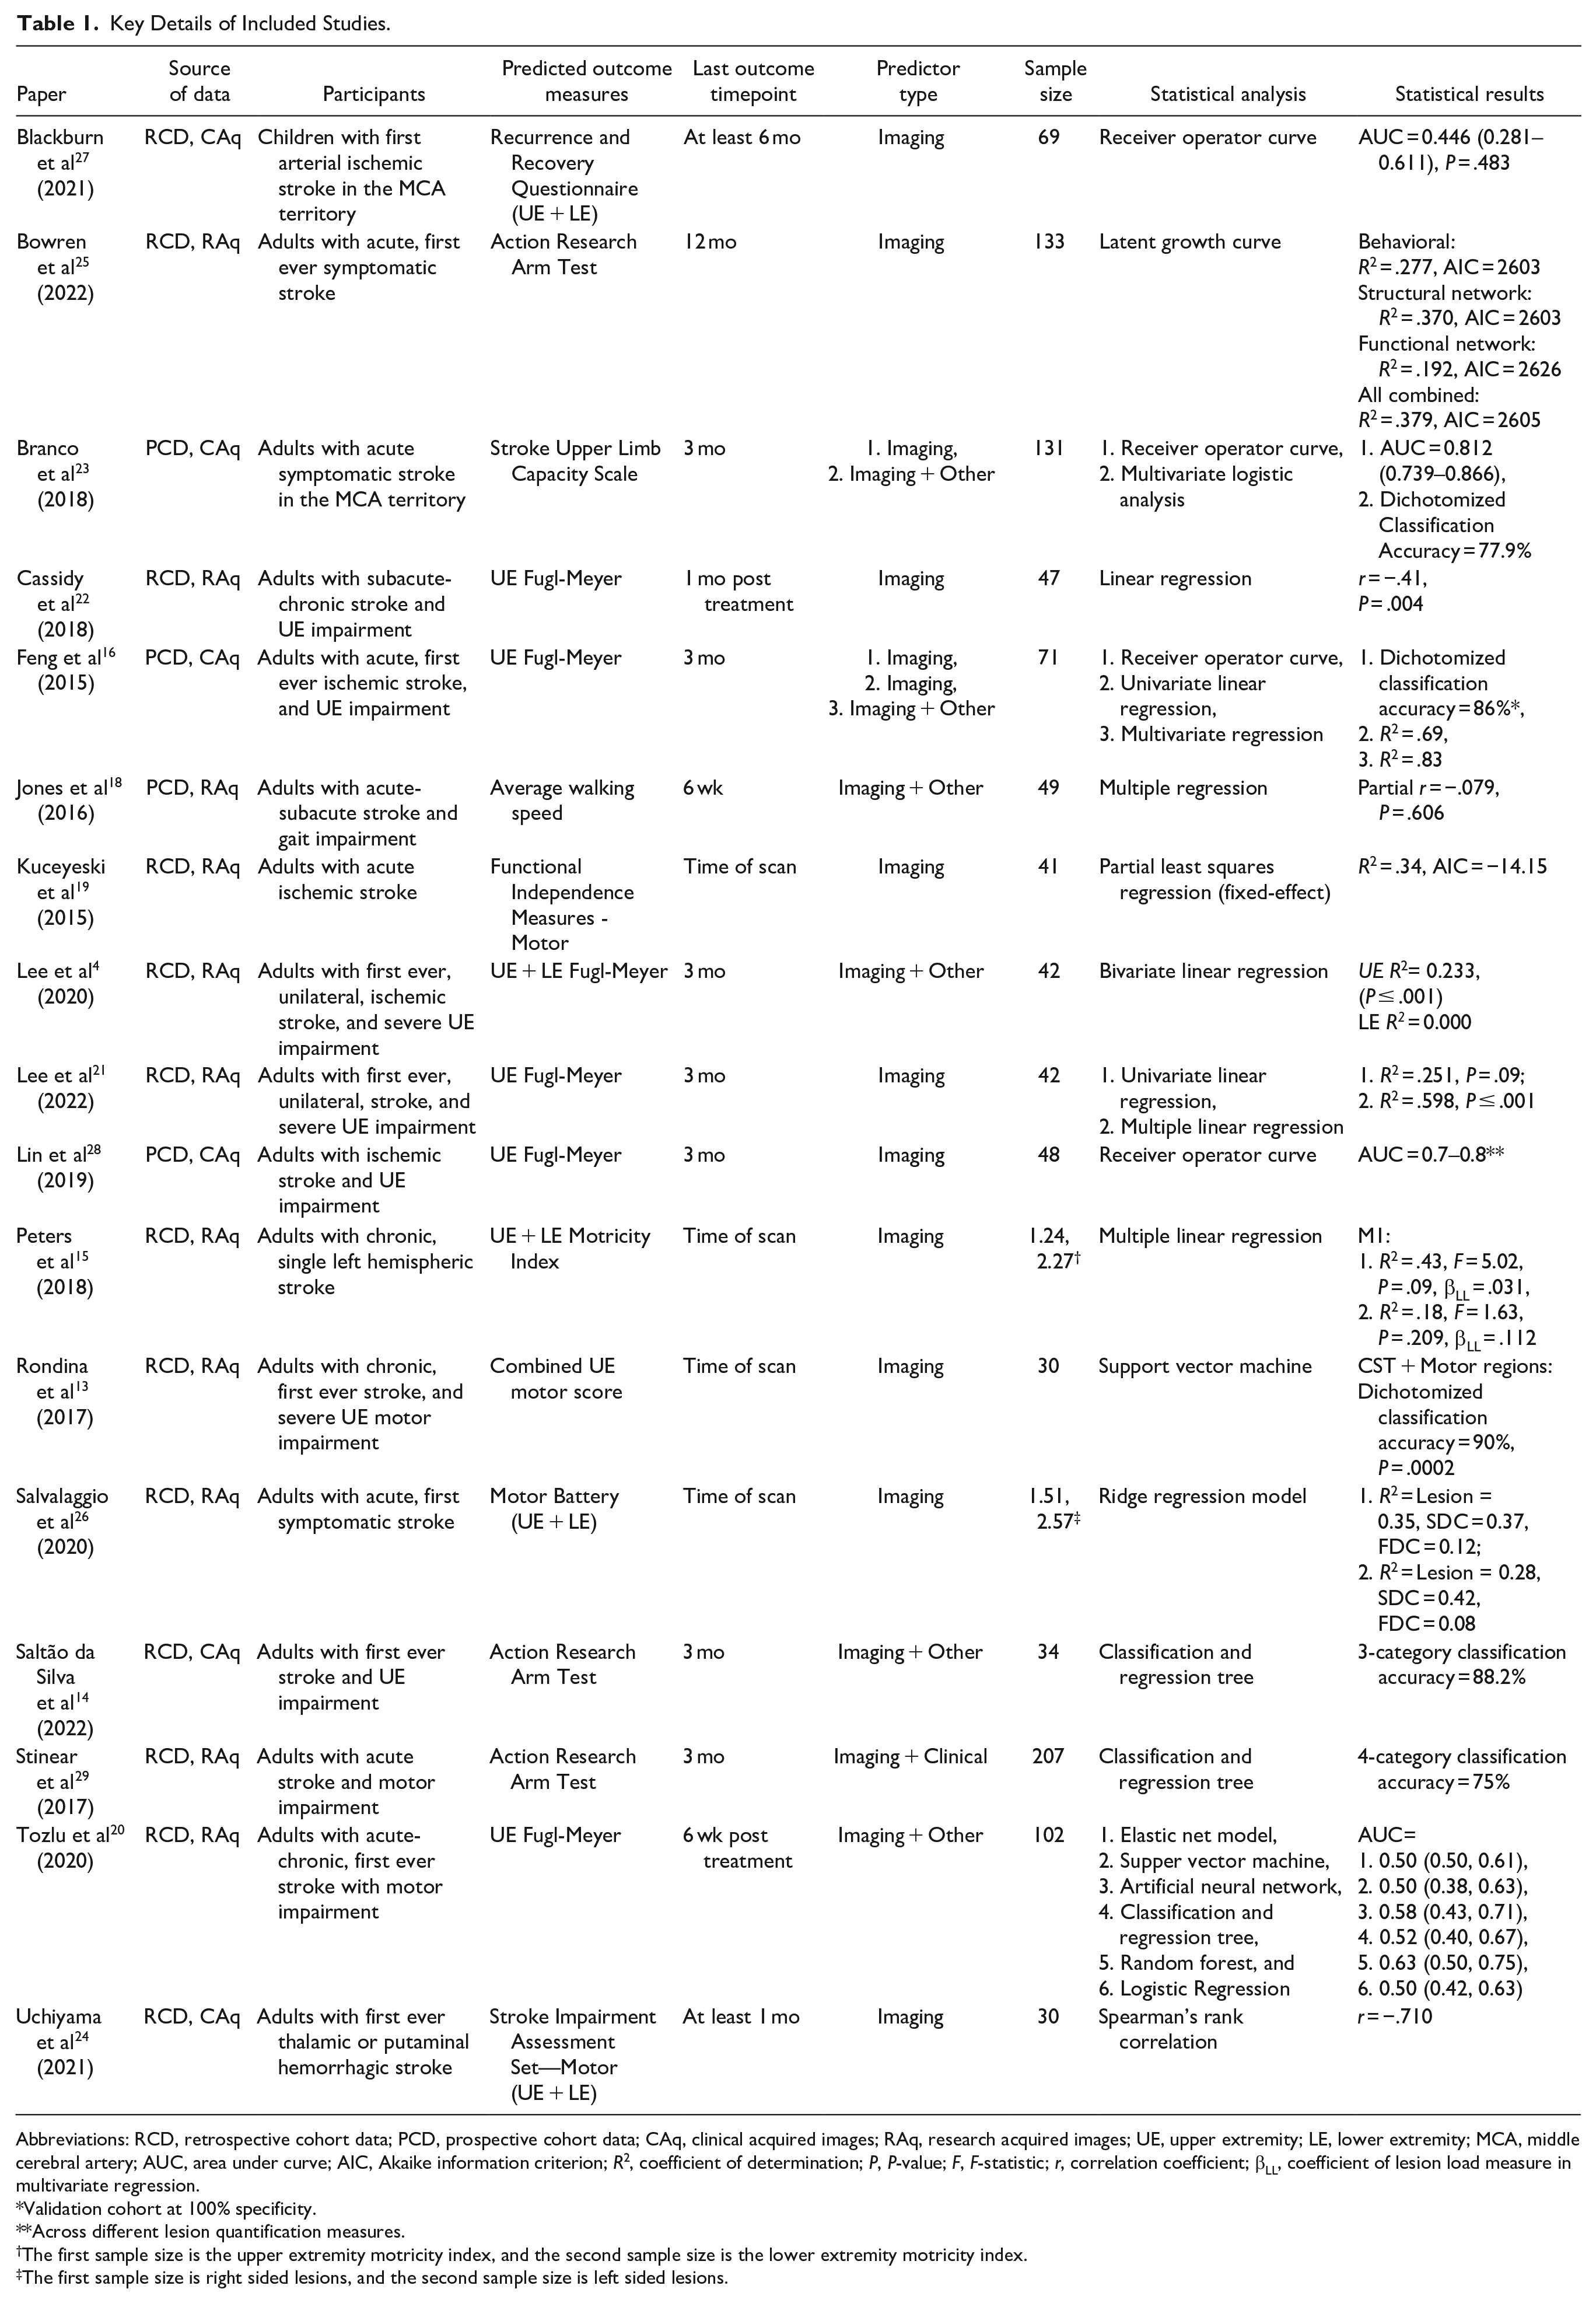
Abbreviations: RCD, retrospective cohort data; PCD, prospective cohort data; CAq, clinical acquired images; RAq, research acquired images; UE, upper extremity; LE, lower extremity; MCA, middle cerebral artery; AUC, area under curve; AIC, Akaike information criterion; R2, coefficient of determination; P, P-value; F, F-statistic; r, correlation coefficient; βLL, coefficient of lesion load measure in multivariate regression.
Validation cohort at 100% specificity.
Across different lesion quantification measures.
The first sample size is the upper extremity motricity index, and the second sample size is the lower extremity motricity index.
The first sample size is right sided lesions, and the second sample size is left sided lesions.
Image Analysis Methods of Included Studies.
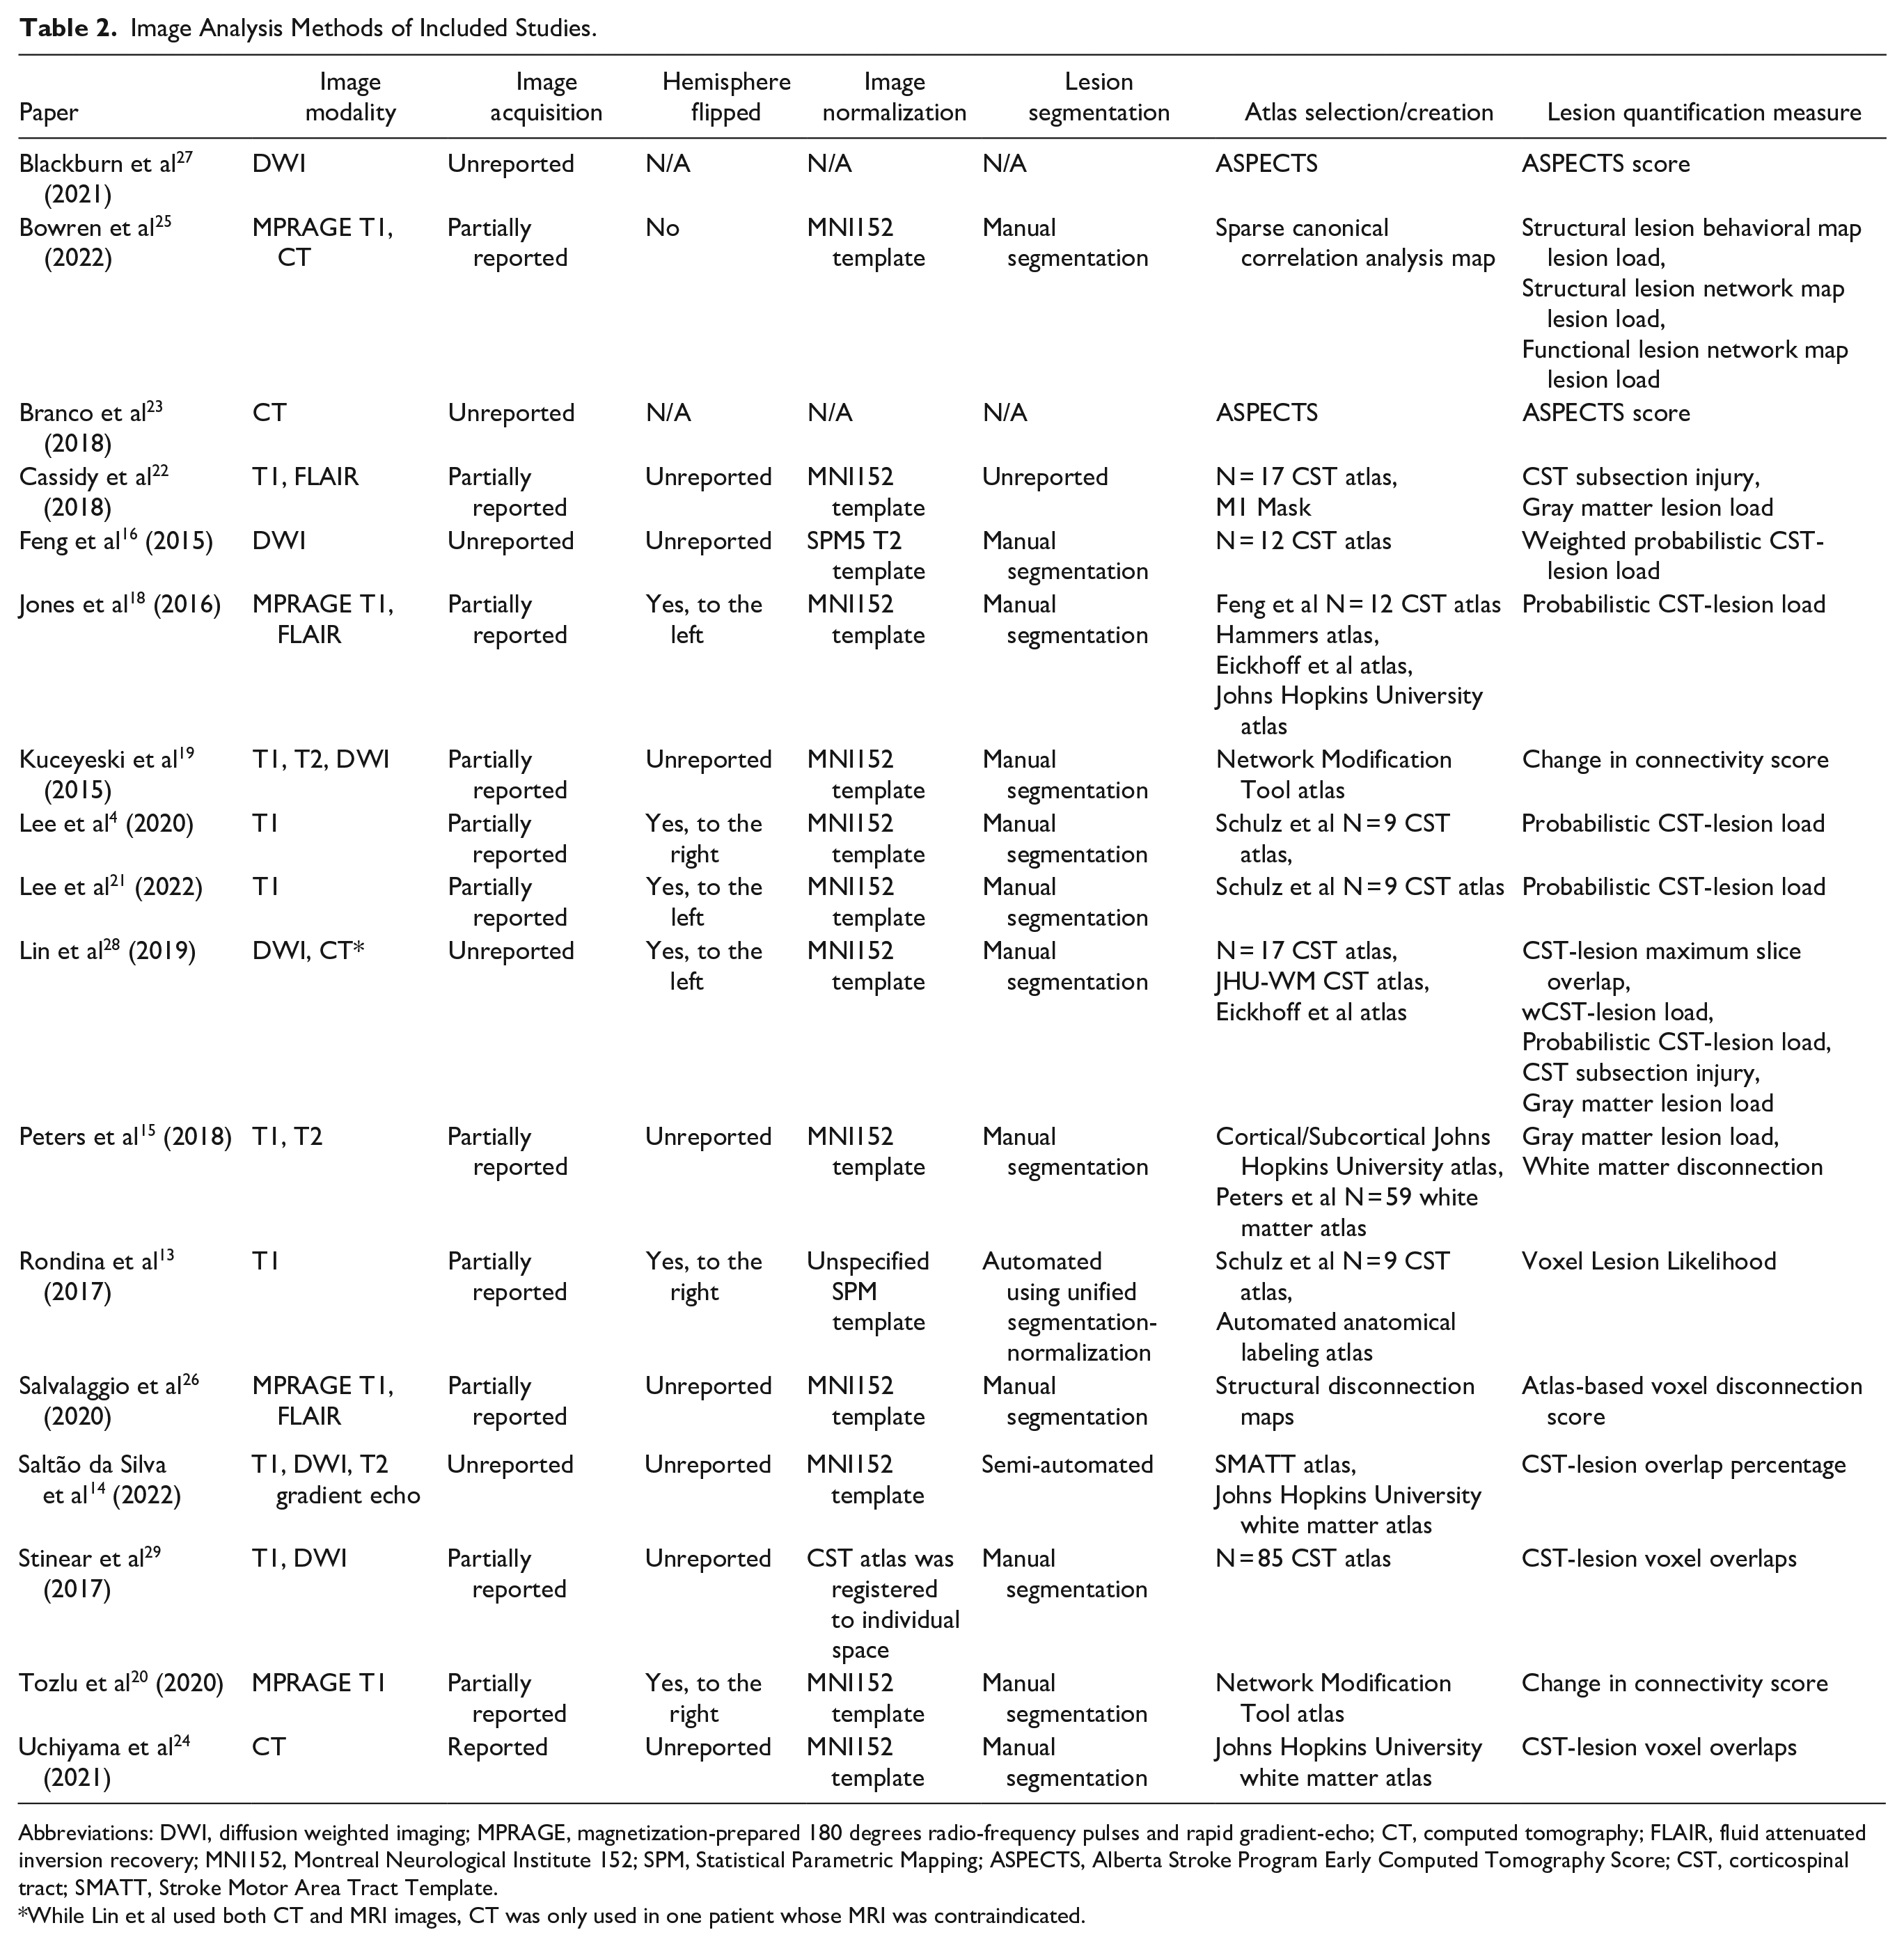
Abbreviations: DWI, diffusion weighted imaging; MPRAGE, magnetization-prepared 180 degrees radio-frequency pulses and rapid gradient-echo; CT, computed tomography; FLAIR, fluid attenuated inversion recovery; MNI152, Montreal Neurological Institute 152; SPM, Statistical Parametric Mapping; ASPECTS, Alberta Stroke Program Early Computed Tomography Score; CST, corticospinal tract; SMATT, Stroke Motor Area Tract Template.
While Lin et al used both CT and MRI images, CT was only used in one patient whose MRI was contraindicated.
Basic Methodological Summary of Studies
A basic summary of the studies’ key methodology is provided in Table 1. Design choices varied between each study widely, and notably, only one study performed out-of-sample validation. 25
Image Modalities and Acquisition
The image analysis pipelines for the included studies are summarized in Table 2. About 13 studies used MRI only,13 –22,26,27,29 2 studies used CT only,23,24 while 2 studies used both MRI and CT.25,28 Of the MRI studies, most used T1-weighted imaging, while 8 used T2-weighted imaging. The T2-weighted studies used either plain T2 images, 15 diffusion-weighted images,14,27 -29 fluid-attenuated inversion recovery images,18,22 or both T2 and diffusion-weighted images. 19 One study used T2 gradient echoes to examine hemorrhagic strokes. 14
With respect to reporting image acquisition details, no MRI studies described their image acquisition in full detail, 11 MRI studies gave partial detail,13 -16,18,20,22,25 -27,29 and 5 MRI studies did not report any acquisition details beyond imaging modality.14,17,19,21,28 Only one study described coil type, 15 and no studies reported the extent of brain coverage or phase encoding details. For the CT studies, one study reported acquisition details, 24 while the other did not. 23
Spatial Normalization and Preprocessing
Twelve studies automatically registered patient images using the Montreal Neurological Institute (MNI) space,14 -22,25,26,28 but only 4 mentioned the specific template used.14,15,24,28 Stinear et al 29 performed an inverse normalization method in which the atlas of interest was registered to each patient’s native space. Rondina et al 13 did not report which normalization space was used, and 2 studies did not perform normalization as they visually determined the regions of interest on each patient.23,27
Twelve of the 14 studies that performed spatial normalization reported details such as whether they used linear, 24 or nonlinear,13 -15,17,18,21,29 or both kinds of transformations.19,20,25,26 Additionally, 4 studies reported additional details about their normalization process such as whether enantiomorphic normalization or cost function masking was performed.15,18,25,28,29
Several different software tools were utilized for image analysis, of which the Functional MRI of the Brain Software Library and Statistical Parametric Mapping (SPM) programs were the most commonly used across the included studies.
Lesion Segmentation
Twelve studies performed manual lesion segmentation.15 –21,24 -26,28,29 Saltão da Silva et al 14 used a semi-automated lesion segmentation method, although this still required considerable manual input as every axial slice had to be manually traced. Rondina et al 13 used a fully automated lesion segmentation method which utilizes fuzzy clustering to identify outlier voxels. Cassidy et al 22 did not report their lesion segmentation method, and two studies did not perform lesion segmentation23,27 as they measured the Alberta Stroke Program Early CT Score (ASPECTS), which can be determined via visual inspection. 30
Lesion Quantification Measures
Several different atlas-based voxel features were derived from the corticospinal tract (CST), a descending white matter tract important for fine motor function. Many of these voxel features are similar and traditionally defined under the umbrella term “CST lesion load.” For this paper, we have further named the measures, mostly retaining the terminology used in their respective studies. These include CST lesion voxel overlap, 24 CST lesion overlap percentage,14,29 CST lesion maximum slice overlap, 28 probabilistic CST lesion load,17,18,21,28 weighted probabilistic CST lesion load,16,28 and CST subsection injury.22,28 CST lesion voxel overlap measures the number of voxels in the CST that overlap with the stroke lesion. Similarly, the CST overlap percentage measures the percentage of voxels in the CST that overlap with the stroke lesion. CST lesion maximum slice overlap identifies the largest voxel overlap between the lesion and CST in the transverse plane, out of all transverse slices. Probabilistic CST lesion load measures the overlap between the lesion and CST, weighted by a probabilistic CST template. Weighted probabilistic CST lesion load measures the voxel overlap between the lesion and CST, and multiplies the overlap by the ratio of the cross-sectional area of each slice over the maximum cross-sectional airea of the CST. This accounts for the narrowing of the CST as it descends from the motor cortex. CST subsection injury divides the CST into 16 subsections, and measures the percentage of subsections that are injured, defined as >5% slice to lesion overlap that subsection. Another entirely different measure, a voxel-lesion likelihood measure, was integrated with the unified segmentation tool. 13 ASPECTS was used in two studies.23,27 Other lesion features included total lesion volume and gray matter lesion load.
Four studies investigated structural connectivity measures by superimposing lesion masks onto a tractography atlas.19,20,25,26 Two studies used the Network Modification tool,19,20 which generates a total disconnection score based on the number of white matter streamline disconnections within a tractogram derived from 73 healthy individuals. Salvalaggio et al 26 used a tractography atlas derived from 176 individuals to measure the probability of a lesion crossing various white matter streamlines. Bowren et al 25 created their own lesion-behavior maps by using sparse canonical correlation analysis to identify clusters, then delineating the identified regions with a publicly available multimodal parcellation map of the cortex. 31 These regions of interest were then used to calculate connectivity measures. White matter tract streamlines were also derived from the sparse canonical correlation analysis maps, 25 which were then used to calculate the number of streamlines disconnected by a lesion.
Regions of Interest Determination
All studies explored the CST tract.13 –29 11 studies used a template of the CST,13 –18,21,22,24,28,29 6 of which solely analyzed the CST.14,16 -18,21,24,29 Several different white matter atlases were utilized, including inhouse CST templates by Schulz et al, 32 Feng et al, 16 Cassidy et al, 22 Stinear et al, 29 the Johns Hopkins University white matter atlas, 33 and the Sensorimotor Area Tract Template (SMATT) atlas. 34 The 3 studies using structural connectivity measures used tractography atlases that contained multiple white matter tracts beyond the CST. However, the two studies using the Change in connectivity score did not list which white matter tracts were significant.19,20 Bowren et al 25 used the Human Connectome Project white matter atlas and only found significant associations in CST regions.
Eight studies examined gray matter regions,13,15,18,22,23,25,27,28 however, the exact gray matter atlases or atlases used for feature extraction differed between studies. Considerable variation exists between gray matter atlases, including the regions of interest it aims to parcellate, the MNI template to which the atlas is normalized to, and the sample size from which the atlas was derived from.35 –37 Two studies used the ASPECTS atlas.23,27 The studies generally did not explain the rationale for their choice of atlas. Gray matter regions considered for the prediction of motor outcomes included postcentral gyrus, precentral gyrus, premotor cortex, supplementary motor area, superior frontal gyrus, middle frontal gyrus, inferior and superior parietal regions, cerebral peduncle, red nucleus, thalamus, and other ASPECTS regions.
Discussion
Trends and Limitations in Image Preprocessing
This review identified several trends, or lack thereof, in the methodology of stroke motor outcome prediction studies that used atlas-based voxel features. MRI was the most commonly used imaging modality in the reviewed studies, likely because ischemic stroke lesions are better visualized on MRI than CT, especially in subacute and chronic settings. 38 Two studies investigated multimodal imaging for prediction modeling.25,28 Multimodal imaging features could provide complementary information to prediction models and improve prediction accuracy, but at a greater resource and time cost that may not be practical for clinical implementation. However, it is important for more studies to attempt to develop their models with different imaging modalities to allow for redundancy and improve generalizability.
While image acquisition details are not as important as other methodological aspects for reproducibility, it is still valuable to report as it helps with understanding the nuances of analyzed images. 12 While most studies reported some acquisition details, no study described all the mandatory details suggested by the COBIDAS report. In future, researchers of neuroimaging studies should consult the COBIDAS report as a guideline for best reporting practice.
The analysis pipeline for atlas features usually involves spatially normalizing images, lesion masks, and atlases between native patient space and the standard template space. Various image manipulation tools can be used to normalize images between patient space and template space. Of these, the Advanced Normalized Tool’s symmetric image normalization method and the Automatic Registration Toolbox are the most consistent and accurate normalization methods for gray matter regions. 39 Moreover, linear normalization alone may not be fully accurate, especially for patients with significant brain atrophy. A combination of linear and nonlinear normalization can improve normalization accuracy, 40 at the cost of greater processing time. Studies should aim to report the parameters and tools that they use for image normalization.
The MNI space was the most common standard coordinate space for image normalization. While this enhances interpretability of results, only 3 studies reported the specific MNI template used.14,15,24 It is possible to infer which MNI template was used if the software is known, but this is not always reliable as the templates used by a given software may change over time. For example, the MNI152 template has received several updates and variants since its inception.41 –44 Moreover, some templates are created in the MNI space, such as the template by Rorden et al, 13 which was derived from an older-aged population to better match the demographic of stroke patients. 45 In contrast, the traditional MNI152 templates were derived from relatively younger-aged adults. 46 While it is unclear whether different normalization templates affect the accuracy of stroke recovery prediction, it may be beneficial to use templates that reflect the specific population of interest (ie, an older-aged population for stroke recovery) rather than templates derived from the general population.
Another relatively common preprocessing step, performed in 6 of the reviewed studies,13,17,18,20,21,28 was the act of flipping the lesion masks to one hemisphere. This helps increase the signal to noise ratio, especially when the sample size is small. 20 However, doing this removes any hemisphere-specific associations and may affect overall prediction accuracy.
Lesion segmentation was mostly performed manually, which remains the gold standard with respect to segmentation accuracy. 47 However, while manual segmentation is viable in research settings, it is not practical for clinical use due to the extensive time and effort required. Therefore, researchers should ultimately aim to develop or test their models with automated segmentation methods. Rondina et al13,48 utilized an automated method which uses unified segmentation-normalization and fuzzy clustering to identify outlier voxels. Other automated lesion segmentation methods are also available in SPM. Another challenge of stroke lesion segmentation is that the imaging characteristics of a stroke change over time. It is therefore important for automatic segmentation methods to be validated at different stages of stroke as most are only validated for chronic stroke lesions. 49 Furthermore, studies which utilize automated segmentation methods should examine and report their segmentation accuracy.
Variability of Atlas Choice and Use
Almost every reviewed study used a different atlas-based voxel features. While it is good to see many novel imaging features, the field generally lacks validation studies. Researchers should move toward validating and reproducing existing prediction models in new patient cohorts as a step toward implementation in clinical practice. Notably, the CST is the most commonly used white matter region of interest for stroke recovery prediction. However, several different CST atlases exist, some of which are not publicly available, making validation difficult.16,22,29,50 Many of these CST atlases are a single binary template, which may not perfectly fit all patients at the individual level. Atlases that capture multiple related pathways such as the SMATT may better account for inter-individual anatomical variability than a single template of the CST. 34
Gray matter regions appear to be less useful for the prediction of stroke outcome after stroke compared to white matter regions. However, the analysis of atlas-based voxel features derived from gray matter regions can be challenging. This is because stroke lesion distribution maps in study datasets often show more strokes in non-cortical regions than cortical regions. 47 Therefore, prediction models may be more representative of people with non-cortical strokes than those with cortical strokes. Further investigation of gray matter imaging features with larger sample sizes is required to fully determine their utility in stroke outcome prediction.
Furthermore, a priori selection of imaging features relevant to the clinical outcome of interest can improve accuracy, especially when sample size is small.8,51 Thus, future motor outcome prediction studies could focus on motor-related or motor-adjacent imaging features, rather than an ensemble of features from the whole brain.
Many studies quantified the spatial overlap between the lesion and the CST, using a variety of different methods. To allow researchers to compare and validate these lesion quantification measures, it may be useful to develop a toolbox that can calculate all of the different types of lesion quantification measures. One comparison of some of the lesion quantification measures suggests that maximum lesion overlap and percent of subsections injured are the most effective lesion quantification measures for prediction of motor outcomes after stroke. 52 This suggests that finer information about the location of the lesion within the CST is relevant for motor outcomes after stroke.
Other types of imaging measures included voxel-lesion likelihoods and lesion connectivity measures. Lesion likelihood data can produce a large number of features which raises the risk of overfitting, so external validation is required before definitive conclusions can be drawn. 9 Lesion connectivity measures such as white matter streamlines are a promising avenue for future feature development since white matter streamlines account for the longitudinal alignment of neuronal axons, which traditional lesion load measures do not do. More work should be done to explore the predictive potential of white matter connectivity measures. 53
Study Limitations and Future Direction
The literature search performed in this review was limited in scale and conducted by one author. This review was limited to imaging modalities used in routine clinical practice as prediction models based on these modalities will be the most accessible to clinical practice; however, other more advanced imaging techniques could help predict stroke motor outcomes such as diffusion spectrum imaging, diffusion kurtosis imaging, and diffusion tractography imaging.54 –57 Furthermore, this review focused on motor outcomes, however other outcomes such as quality of life, independence, and mortality are also highly relevant for stroke patients. The low number of identified studies and their methodological heterogeneity meant that results between studies could not be meaningfully compared.
The comparison and validation of existing prediction models that utilize atlas-based voxel features is currently limited by small sample sizes, atlases which are not publicly available, and poor reporting of study methods. One solution could be to create an image-processing toolbox that includes many of the commonly used atlases and imaging measures. Currently, Neuroparc offers a collection of common human brain atlases registered into the same MNI space, although it has limitations such as inaccurate normalization and subjective labeling. 58 Future work can also look to other domain prediction studies for methodological inspiration, such as the Predicting Language Outcome and Recovery After Stroke study which validates prediction models to work with neuroimaging features derived from scans at multiple time points. 59
Atlas-based voxel features remain challenging to implement and are currently unfit for clinical practice. However, components of the image analysis and feature extraction pipeline continue to be improved, which may allow the creation of clinically feasible prediction tools in the future. Automated lesion segmentation methods, increasingly large databases of atlases, and the development and refinement of atlas-based voxel features may facilitate the development of stroke recovery prediction models. Moreover, ongoing work across feature development, atlas selection, and outcome prediction may eventually reveal particular atlases or imaging features that are optimal for predicting motor outcomes after stroke. Rondina et al 8 identified potential regions of interest beyond the CST that could improve prediction accuracy for upper limb motor outcomes, which can be an initial guide for regions to explore.
The study designs and methodologies differed considerably between the reviewed studies. For studies investigating individualized outcome prediction, it is important to go beyond descriptive association statistics and report prediction statistics such as prediction accuracy. 60 Studies should also report uncertainty measures for their prediction results so appropriate conclusions can be drawn. This is especially important for studies that only perform in-sample validation. 60 Prediction models using atlas-based voxel features should also aim to include clinical biomarkers, since they are cheap and easy to measure, and measures of baseline performance are one of the best predictors of recovery and outcome. Furthermore, the added predictive value of imaging features can be quantified by comparing prediction models to a benchmark model of clinical features only. Not only that, but a diversity of features can help build redundancies so that models can be more resilient to missing data.
While this review focused on atlas-based voxel features, they are only one out of many different classes of neurological biomarkers. 61 The abundance of different biomarkers means researchers should consider the validity, quality, and utility of potential biomarkers. 62 Validity refers to the reliability and reproducibility of biomarker measurement. Quality is the strength of the association between a biomarker and a clinical endpoint, which is ideally validated with an out-of-sample cohort. Lastly, utility refers to how practical it is to use a biomarker in a clinical setting. Ideally, all biomarkers should have high validity, quality, and utility, but this is challenging to achieve. 63 Researchers may wish to consider whether the associations between biomarkers and what they predict are underpinned or explainable by feasible biological mechanisms. For instance, biomarkers derived from neuroimaging is likely to be better at predicting direct impairment than measures of activity and participation as contextual factors beyond pathophysiology impacts activity and participation outcomes. 63
Clinically, prediction of motor outcomes after stroke should occur at the acute stage, so that rehabilitation can be tailored during the early sub-acute stage when most recovery occurs. 5 It is also important to consider the relevant clinical endpoints for motor recovery. Most studies included in this review examined only motor outcomes, which refers to performance at a fixed time point. However, studies may also investigate motor recovery, which refers to change in performance over time. While both variables are clinically meaningful, predicting motor outcomes may be more suitable for discharge and treatment planning, while predicting motor recovery may be useful for tracking patients longitudinally such as monitoring deterioration. Moreover, recovery can be measured in either absolute or relative terms, and it is still unclear as to which is most suitable for clinical use.
Conclusion
This review identified current trends and limitations in the use of atlas-derived methods to predict motor outcomes after stroke. We hope our findings will encourage future researchers to solve some of the existing limitations of atlas-based features, as a step toward their use in clinically feasible prediction models for stroke outcomes and recovery.
Footnotes
Declaration of Conflicting Interests
The author(s) declared no potential conflicts of interest with respect to the research, authorship, and/or publication of this article.
Funding
The author(s) disclosed receipt of the following financial support for the research, authorship, and/or publication of this article: This work was partially supported by the Health Research Council of New Zealand (grant number 21/144).