
Abstract
Background
Post-stroke depressive symptoms are prevalent and impairing, and elucidating their course and risk factors is critical for reducing their public health burden. Previous studies have examined the course of post-stroke depression, but distinct depressive symptom dimensions (eg, somatic symptoms, negative affect [eg, sadness], anhedonia [eg, loss of interest]) may vary differently over time.
Objective
The present study examined within-person and between-person associations between depressive symptom dimensions across 3 timepoints in the year following discharge from in-patient rehabilitation hospitals, as well as the impact of multiple clinical variables (eg, aphasia).
Methods
Stroke survivors completed the Center for Epidemiologic Depression Scale (CES-D) at discharge from post-stroke rehabilitation (“T1”) and at 3-month (“T2”) and 12-month (“T3”) follow-ups. Scores on previously identified CES-D subscales (somatic symptoms, anhedonia, and negative affect) were calculated at each timepoint. Random intercept cross-lagged panel model analysis examined associations between symptom dimensions while disaggregating within-person and between-person effects.
Results
There were reciprocal, within-person associations between somatic symptoms and anhedonia from T1 to T2 and from T2 to T3. Neither dimension was predictive of, or predicted by negative affect.
Conclusions
The reciprocal associations between somatic symptoms and anhedonia may reflect a “vicious cycle,” and suggest these 2 symptom dimensions may be useful indicators of risk and/or intervention targets. Regularly assessing depression symptoms starting during inpatient rehabilitation may help identify stroke survivors at risk for depression symptoms and facilitate early intervention.
Introduction
Stroke is one of the paramount causes of disability and mortality. 1 Annually, 13.7 million people worldwide encounter a first-ever stroke and one-third of stroke survivors experience post-stroke depression.2 -4 Post-stroke depression may negatively influence quality of life, social functioning, and cognitive outcomes, which in turn can limit participation in post-stroke rehabilitation and negatively impact recovery. Given the public health burden of post-stroke depressive symptoms and their adverse (and potentially reciprocal) effects on recovery, it is critically important to identify risk factors that predict the course of depressive symptoms following a stroke.
Studies investigating the course of post-stroke depression indicate that it is often persistent, with highest frequency during the first year, and is predicted by stroke severity, premorbid history of depression, cognitive impairment, and aphasia.3,5,6 However, psychometric studies consistently indicate that post-stroke depression measures capture multiple empirically distinct symptom dimensions rather than a single construct.7,8 The multidimensionality of depression has been increasingly considered in studies of neurologically healthy individuals, 9 but has received less consideration in studies that investigate the natural course of post-stroke depression, which may obfuscate important differences between the longitudinal trajectories and/or interrelationships of depression symptom dimensions. For example, somatic symptoms such as fatigue may be more prominent and persistent than other depression symptoms after a stroke,10,11 anhedonia/apathy may be uniquely associated with post-stroke cognitive deficits, 12 and negative affect and motivational deficits (eg, anhedonia) may be associated with less efficient use of rehabilitation services. 13 Elucidating how different symptom dimensions interact and change following a stroke can help elucidate different psychological mechanisms of depression, identify at-risk individuals, and highlight novel, more specific intervention targets.
As intervention implications and theoretical models typically focus on within-person processes, it is important to disaggregate within-person versus between-person effects. For example, in a daily diary study of neurologically healthy individuals, people with high somatic symptoms of depression were more likely to have high negative affect. However, within-person fluctuations in somatic symptoms over time were correlated with within-person fluctuations in positive symptoms. 14 Furthermore, separating these effects will help to determine who is most at risk and when they are most likely to benefit from intervention. For instance, between-person effects have important implications for post-stroke depression screening and identifying high-risk individuals for selective prevention, which has been more effective than universal prevention in other populations. 15 Within-person effects may inform clinical decisions regarding when to intervene.16,17
In this study, we explored within- and between-person associations between post-stroke depressive symptom dimensions (negative affect, somatic symptoms, and anhedonia) at discharge (“T1”) and at 3 (“T2”) and 12 months (“T3”) following discharge from in-patient rehabilitation hospitals. Lastly, age and certain clinical characteristics (eg, aphasia, hemiplegia, lack of functional independence) are associated with increased risk for post-stroke depression,18,19 and it is possible that longitudinal relationships between symptom dimensions might differ as a function of these characteristics. We therefore conducted exploratory analyses testing whether these characteristics moderated longitudinal relationships between depressive symptom dimensions.
Methods
Participants
Analyses were conducted using data from the Stroke Recovery in Underserved Populations database (2005-2006), 20 a prospective observational study of first-ever stroke patients (N = 1219; 51.3% female; Mage = 68.5, SD = 13.3) from 11 rehabilitation facilities across the United States. Aphasia and hemiplegia were diagnosed in 540 (44.3%) and 421 (34.5%) participants, respectively, and were unassociated with each other (P = .716). Retention rates were 85.8% at T2 and 69.2% at T3. All participants provided informed consent prior to participation. Additional sample characteristics are available in Table 1. The data are publicly available on https://www.icpsr.umich.edu/web/ADDEP/studies/36422.
Participant Characteristics.
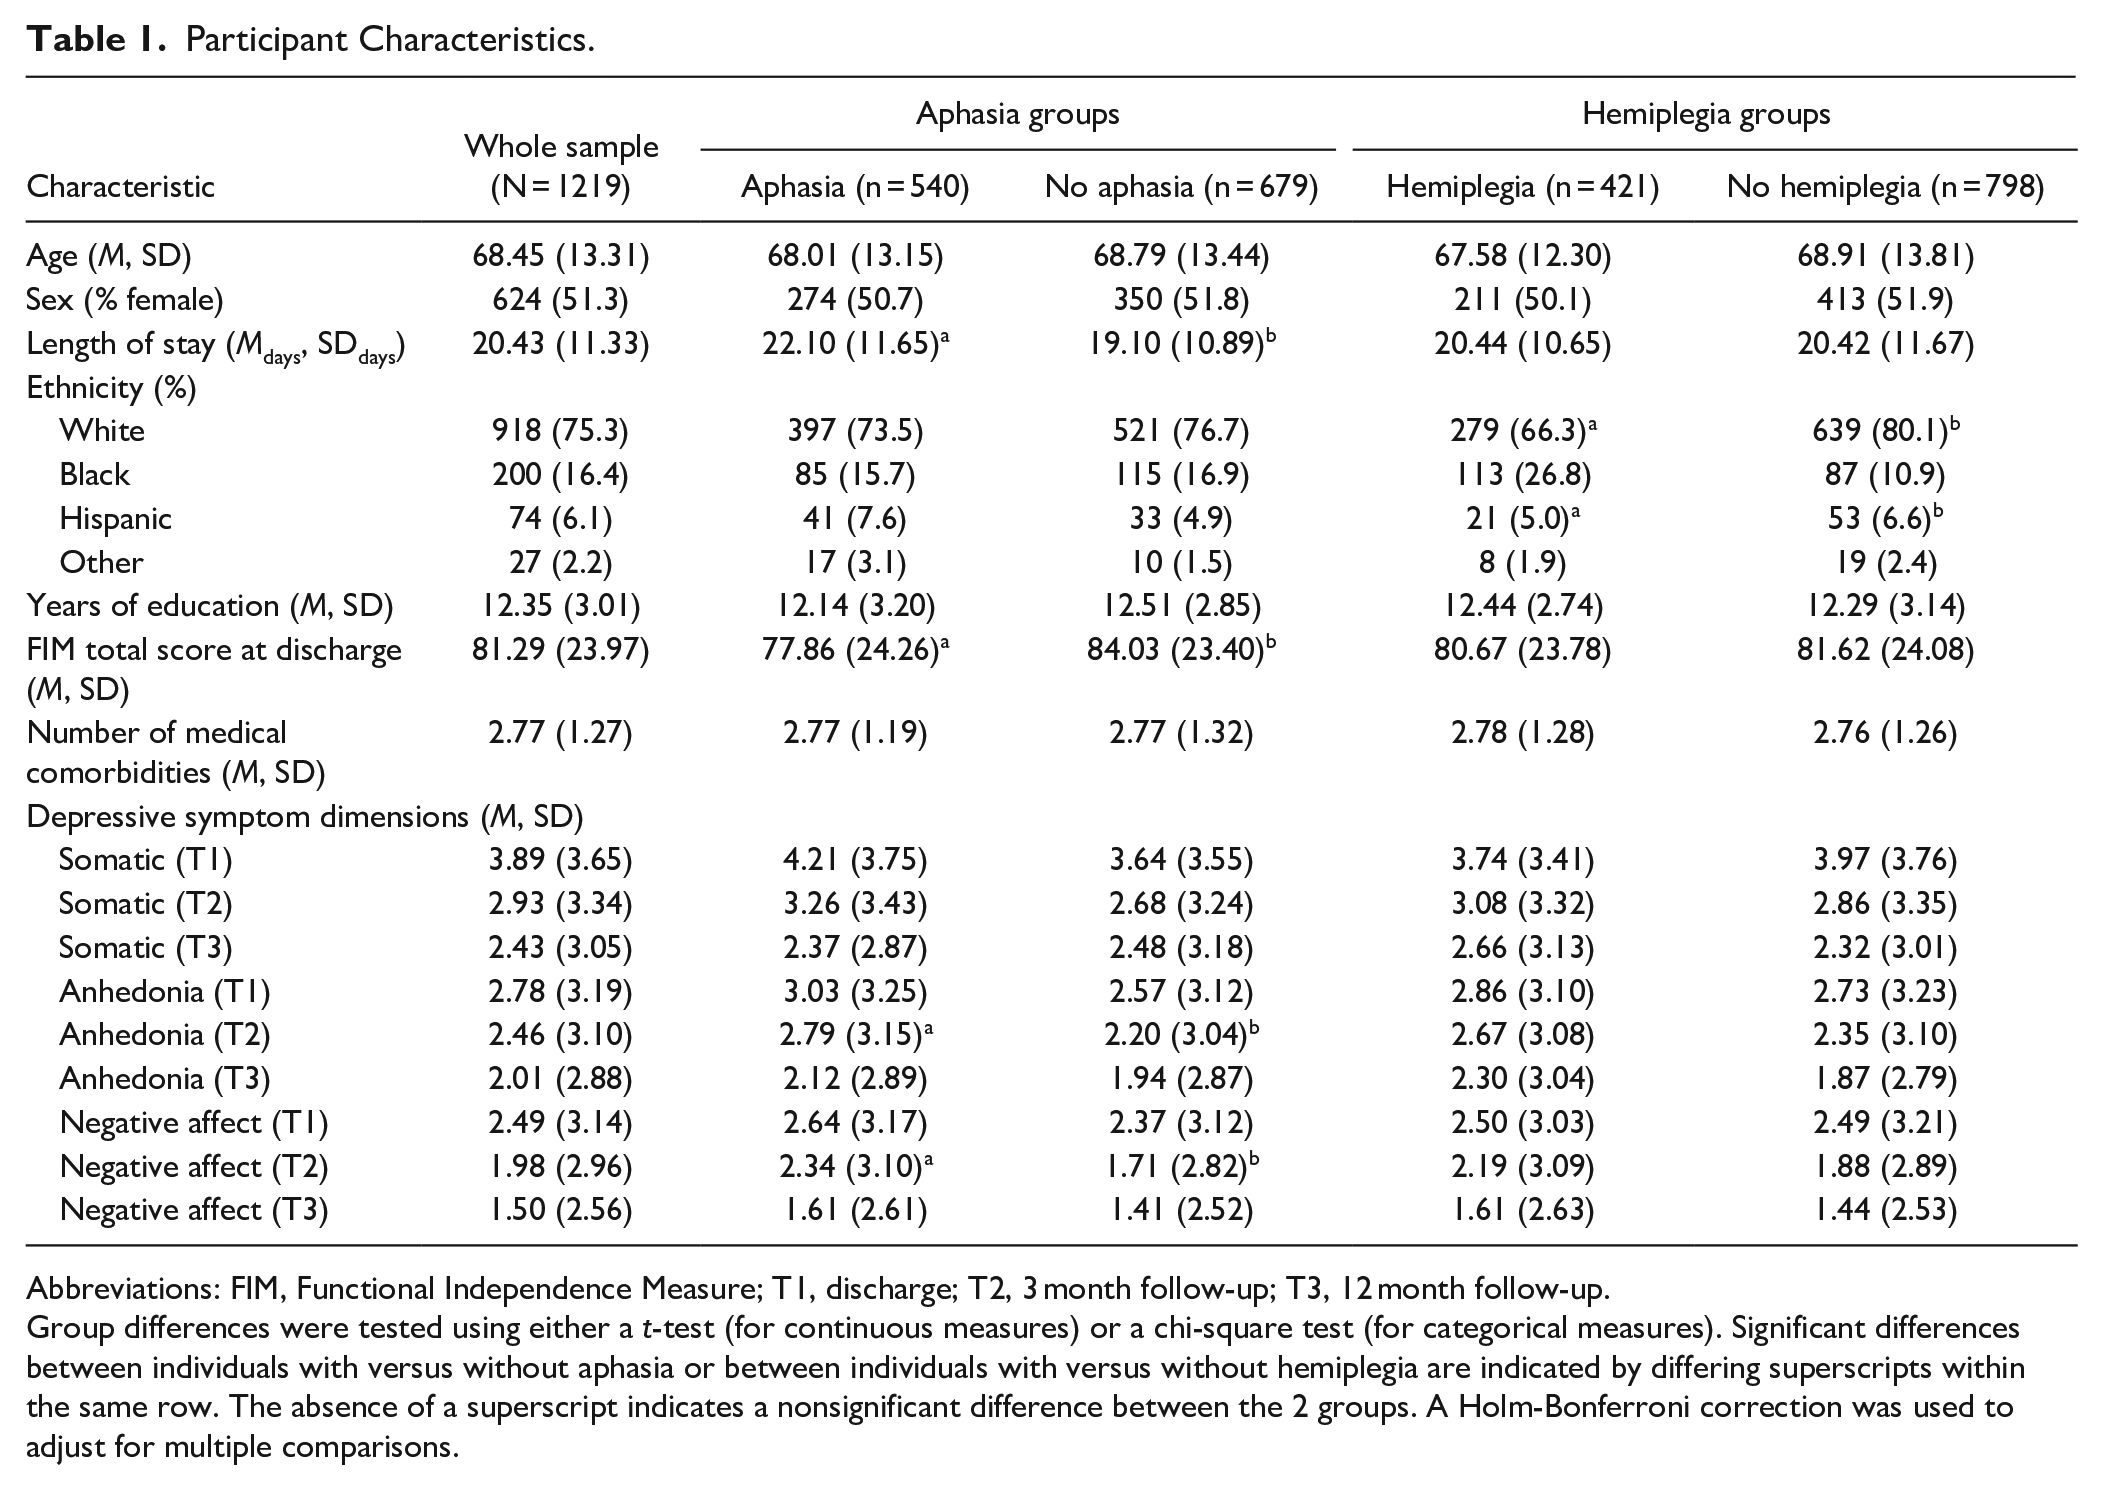
Abbreviations: FIM, Functional Independence Measure; T1, discharge; T2, 3 month follow-up; T3, 12 month follow-up.
Group differences were tested using either a t-test (for continuous measures) or a chi-square test (for categorical measures). Significant differences between individuals with versus without aphasia or between individuals with versus without hemiplegia are indicated by differing superscripts within the same row. The absence of a superscript indicates a nonsignificant difference between the 2 groups. A Holm-Bonferroni correction was used to adjust for multiple comparisons.
Measures
Depression
Depression symptom dimensions were assessed at each timepoint using the Center for Epidemiologic Studies Depression Scale (CES-D). 21 The CES-D contains 20 items scored from 0 (rarely or none of the time) to 3 (most or almost all the time), has been found to be valid and reliable in assessing post stroke depression,22,23 and is highly correlated with other depression measures including the Beck Depression Inventory. 24 Meta-analysis also suggests that the CES-D is an optimal post-stroke depression screening instrument. 25 Consistent with CES-D scoring recommendations 26 and a findings from a psychometric evaluation of the CES-D in this sample, 8 subscales representing negative affect (items 3, 6, 14, and 18; αs = .86-.89), anhedonia (items 4, 8, 12, and 16; αs = .79-.83), and somatic symptoms (items 1, 2, 7, 11, and 20; αs = .74-.77) were calculated as sum-scores. Item 5 (“I had trouble keeping my mind on what I was doing”) was excluded from the somatic symptoms subscale because it was negatively correlated with all other somatic items at T2 and T3. Table S1 in the Supplemental Material has a list of CES-D items with their corresponding dimensions.
Functional Independence
Functional independence was assessed at discharge using the total score of the Functional Independence Measure (FIM). 27 The FIM contains 18 items that use a 7-point Likert scale to assess the degree of independence when completing various motor and cognitive tasks (eg, activities of daily living). Higher scores reflect greater functional independence.
Data Analysis
Intraclass correlations (ICCs) first quantified the between-person versus within-person variation in each dimension. Longitudinal relationships between negative affect, anhedonia, and somatic symptoms were then modeled. These relationships were first modeled using a traditional cross-lagged panel model (CLPM), which estimates each cross-lagged association and accounts for temporal stability in each construct by controlling for autoregressive effects. Although widely used, the traditional CLPM conflates between-person and within-person effects. 28 This conflation is problematic because post-stroke depression largely comprises within-person processes, and theoretical models and many intervention implications pertain to within-person effects. To estimate both within-person and between-person effects, we also fit a random-intercept cross-lagged panel model (RI-CLPM; see Figure S1 in the Supplemental Material). 28 The RI-CLPM improves upon the traditional CLPM by separating within-person and between-person effects through the inclusion of latent random intercepts. The random intercepts represent each person’s mean level, or stable between-person differences. The model also contains within-person components at each timepoint reflecting a person’s variation around their own mean. The within-person components are specified by regressing each observed variable on its own latent factor with the loading constrained to one. Within-person fluctuations over time are then modeled using autoregressive and cross-lagged paths, which indicate the extent to which within-person deviation in a symptom dimension predicts within-person deviation in the same (for autoregressive effects) or different (for cross-lagged effects) symptom dimension at the next timepoint. In other words, the autoregressive paths test the stability of within-person fluctuations around one’s mean. The cross-lagged paths test whether experiencing higher levels than is average for you on 1 symptom dimension at timepoint t predicts your severity on another symptom dimension at the next timepoint (time t + 1). All cross-lagged effects control for the other symptom dimensions (including the outcome) at timepoint t and are therefore independent of the within-person stability of the outcome. 29 Residual variances of the observed scores are constrained to zero, meaning that variation in observed scores is fully explained by the between-person and within-person structure. Concurrent T1 correlations and correlated residuals at T2 and T3 are also specified for the latent within-person factors. Because the RI-CLPM only differs from the traditional CLPM in its addition of random intercepts, the traditional CLPM is nested within the RI-CLPM and the 2 models can be compared empirically using a chi-bar-square difference test. 30 We therefore compared the traditional CLPM and RI-CLPM to test whether there were significant trait-like, time-invariant individual differences in these data.
Model fit was evaluated using traditional fit indices including the comparative fit index (CFI), Tucker Lewis index (TLI), root mean square error of approximation (RMSEA), and standardized root mean square residual (SRMR). Acceptable fit was determined using generally accepted criteria for the CFI (>.95), TLI (>.95), RMSEA (<.05), and SRMR (<.10). 31 No equality constraints were imposed over time because timepoints were not equally spaced. 32
The moderating effects of demographic and clinical characteristics were examined by first refitting the better fitting cross-lagged model (CLPM or RI-CLPM) as separate multi-group models in which all parameters were free to vary across age group (older vs younger; defined by median split), aphasia status (present vs absent), hemiplegia status (present vs absent), or functional independence level (high vs low). To simplify these exploratory moderation analyses, age and functional independence were dichotomized using a median split. Chi-square difference tests then tested whether constraining each autoregressive or cross-lagged path to be invariant across groups significantly decreased model fit. 33 Significant omnibus effects were followed up with chi-square difference tests of individual parameters. All models were fit in the lavaan R package using maximum likelihood with robust standard error estimation, and missing data were handled using full information maximum likelihood. 34
Results
Means, standard deviations, and zero-order correlations between symptom dimensions at each timepoint are displayed in Table S2 and Figure S2 in the Supplemental Material. ICCs indicated that 48%, 45%, and 44% of the variance in the negative affect, anhedonia, and somatic symptom dimensions, respectively, could be explained by between-person differences. The remaining variance is attributable to within-person fluctuations over time.
The traditional CLPM had acceptable fit, χ2(9) = 82.11, P < .001, CFI = .986, TLI = .942, RMSEA = .08, SRMR = .05. The RI-CLPM had excellent fit, χ2(3) = 1.43, P = .698, CFI = 1.00, TLI = 1.00, RMSEA < .01, SRMR = .01, and had significantly better fit than the traditional CLPM, X¯ 2(6) = 80.70, P < .001. This indicates that there were statistically significant trait-like, time-invariant individual differences in the depressive symptom dimensions. To account for these stable individual differences, the remaining analyses and interpretations focused on the RI-CLPM. At the between-person level, correlations between the 3 symptom dimensions were strong and positive (rs = .65-.86, Ps < .001). These positive correlations indicate that individuals who reported greater severity on 1 symptom dimension across time tended to also report greater overall severity on the other symptom dimensions, which was expected based on prior psychometric studies. 26 At the within-person level (see Figure 1 and Table S3), there were moderate concurrent associations between symptom dimensions at each timepoint. Thus, individuals experiencing greater severity on 1 symptom dimension (relative to their own mean) at a given timepoint were more likely to experience greater-than-expected severity on the other symptom dimensions at the same timepoint. Within-person autoregressive effects from T1 to T2 were small (βs = .14-15) yet significant or marginally significant for somatic symptoms (P = .025), negative affect (P = .036), and anhedonia (P = .057). No autoregressive paths from T2 to T3 were significant (autoregressive estimates in the RI-CLPM are generally weaker than in the traditional CLPM because they only reflect stability of within-person fluctuations around one’s own mean33. In contrast, autoregressive effects in the traditional CLPM capture the stability of the rank-order of individuals from one timepoint to the next, which is influenced by both within- and between-person effects). Regarding cross-lagged effects, there were significant bidirectional relationships between anhedonia and somatic symptoms from both T1 to T2 (βs = .14-15, Ps < .042) and T2 to T3 (βs = .21-.22, Ps < .042). This indicates that individuals who reported elevated anhedonia relative to their own expected score were more likely to report elevated somatic symptoms relative to their own expected score at the next timepoint, and vice versa. Cross-lagged effects from negative affect to anhedonia or somatic symptoms were not significant. Similarly, anhedonia and somatic symptoms did not significantly predict negative affect at the next timepoint.
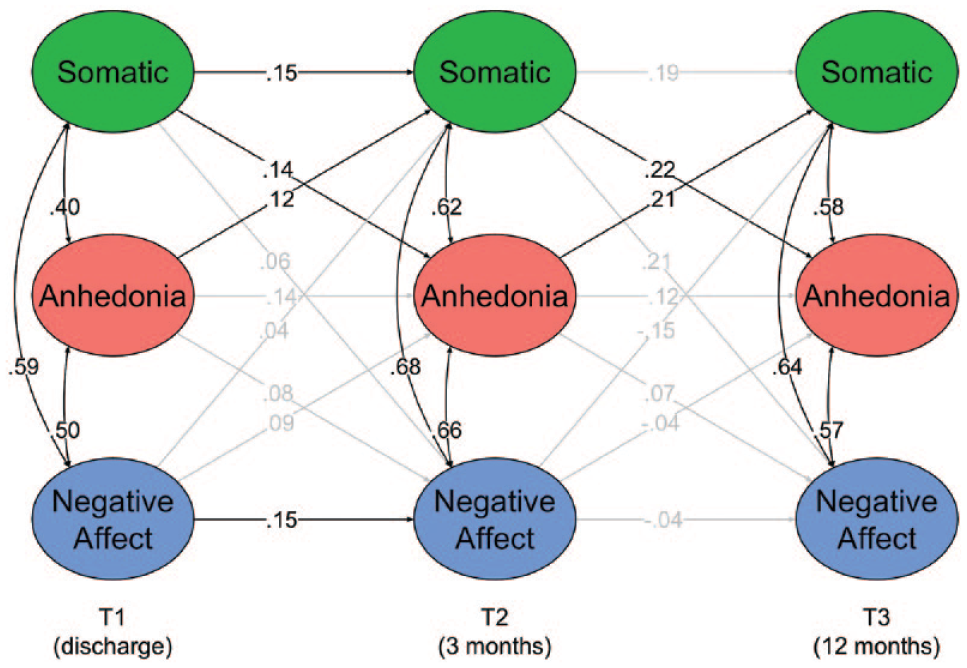
Standardized path coefficients for the within-person level of the random intercept cross-lagged panel model. Significant paths (P < .05) are colored black, and nonsignificant paths are shaded gray. Residual variances and means are omitted. The latent variables represent a person’s score at a given timepoint relative to their own mean. The positive concurrent associations (denoted by curved arrows) indicate that individuals experiencing increased severity on 1 symptom dimension relative to their own mean were more likely to experience increased severity on the other dimensions at the same timepoint. Lagged associations (denoted by straight arrows) indicate the extent to which experiencing higher levels on 1 dimension relative to one’s mean predicted symptom dimension severities at the next timepoint. For example, the significant bidirectional cross-lagged associations between anhedonia and somatic symptoms indicate that individuals who reported more severe anhedonia than usual were more likely to report more severe somatic symptoms than usual at the next timepoint, and vice versa.
Moderation by Demographic and Clinical Characteristics
Models with parameters freely estimated across age group, aphasia status, hemiplegia status, or functional independence all had excellent fit (Ps > .307, CFIs = 1.00, TLIs = 1.00, RMSEAs < .02, SRMRs < .01). Chi-square difference tests indicated that lagged parameters significantly differed across hemiplegia status, Δχ2(18) = 32.87, p = .017, but did not significantly differ across age group, Δχ2(18) = 27.74, P = .066, aphasia status, Δχ2(18) = 21.11, P = .274, or level of functional independence, Δχ2(18) = 16.33, P = .569. Follow-up tests of individual parameters revealed that hemiplegia moderated 5 cross-lagged relationships. Among individuals without hemiplegia (N = 798) (but not among those with hemiplegia, N = 421), anhedonia at T1 and T2 positively predicted somatic symptoms at T2 (β = .22, P = .002) and T3 (β = .39, P = .020), respectively, and negative affect at T2 predicted lower anhedonia (β = −.24, P = .040) and somatic symptoms (β = −.43, P = .003) at T3. The relationship between T2 anhedonia and T3 negative affect was also moderated by hemiplegia, Δχ2(1) = 4.28, P = .038, but did not significantly differ from zero in individuals with (β = −.18, P = .209) or without (β = .24, P = .181) hemiplegia.
Discussion
Prior research examining the course of post-stroke depression has generally conceptualized post-stroke depression as a single construct, 3 which is inconsistent with psychometric evidence that post-stroke depression reflects multiple empirically distinct symptom dimensions rather than a single construct.7,8 This study extended prior research by incorporating this psychometric evidence and examining prospective relationships between previously identified post-stroke depressive symptom dimensions (somatic symptoms, anhedonia, and negative affect) over the year following discharge from a rehabilitation facility. We disaggregated within-person and between-person effects and found reciprocal, prospective, within-person associations between somatic symptoms and anhedonia across all timepoints. In other words, individuals with relatively high anhedonia (relative to their own mean) were more likely to have relatively high somatic symptoms at the next timepoint, and vice versa, after controlling for within-person fluctuations in the other symptom dimensions and the autoregressive effect. Negative affect did not predict somatic symptoms or anhedonia within-person. Exploratory analyses suggested that certain prospective associations may be specific to individuals without hemiplegia.
These findings suggest that examining different depressive symptom dimensions identified by psychometric studies may improve understanding of their course, risk factors, and potential etiological processes and could guide clinicians in implementing targeted treatments. These results are consistent with preliminary evidence that important correlates of post-stroke depression (eg, cognitive deficits, use of rehabilitation of services) may be specific to certain depressive symptoms.12,13 There is also preliminary evidence that interventions targeting specific dimensions of post-stroke depression (eg, behavioral activation for anhedonia) may lead to improved therapeutic outcomes compared to usual care,35,36 further supporting the potential benefit of examining dimensions of post-stroke depression rather than just total scale scores. According to studies applying the network theory of psychopathology to post-stroke depression,37,38 biological, psychological, and social risk factors likely interact in complex and dynamic ways to contribute to and maintain post-stroke depressive symptoms. Consistent with the network theory, the results of this study suggest that certain depressive symptoms may increase risk for other depressive symptoms. Depressive symptom dimensions may also reciprocally influence risk factors, thereby maintaining elevated risk.
These findings also provide insights regarding disagreements in the literature about the role of anhedonia and somatic symptoms in post-stroke depression. For example, within-person increases in anhedonia predicted subsequent increases in somatic symptoms, suggesting that somatic symptoms 3 months post-discharge were not entirely caused by stroke itself. 5 If these within-person associations are causal (ie, depression symptoms can be caused by stroke but also cause each other), anhedonia and somatic symptoms could be targeted through intervention to prevent other symptoms, regardless of their initial cause(s). However, the initial cause(s) of a symptom dimension may be important for treatment selection. Nevertheless, this approach allows one to predict how a certain depression symptom dimension may impact other depression symptom dimensions and how targeting certain depression dimensions with certain treatments may improve other depression dimensions. Therefore, we suggest that post-stroke depression symptom dimensions are screened during patients’ inpatient stay in the rehabilitation hospital so that specific depression interventions can be implemented early. Post-stroke depression symptoms should continue to be routinely assessed during outpatient rehabilitation and beyond as these symptoms fluctuate and may impact other post-stroke behaviors. 39
We also found that hemiplegia (but not age, aphasia, or level of functional independence) moderated certain cross-lagged relationships, although these exploratory results should be interpreted with caution. In individuals without hemiplegia, anhedonia consistently predicted future increases in somatic symptoms, and negative affect at T2 predicted decreased anhedonia and somatic symptoms at T3. Anhedonia may therefore connote risk for and potentially contribute to somatic symptoms only in individuals without hemiplegia. This study is among the first to examine whether hemiplegia moderated prospective associations between depressive symptom dimensions, and understanding the relationship between distinctive depression symptom dimensions and hemiplegia in a more systematic manner is important since the severity of physical disability at follow-up may be related to post-stroke depression at baseline. 40
Study strengths include the examination of distinct depressive symptom dimensions, large sample size, inclusion of 3 timepoints, disaggregation of within-person and between-person effects, and exploratory tests of moderation. However, we did not consider other factors potentially involved in post-stroke depression (eg, familial factors, severity of stroke deficits, therapy services, pre-stroke psychopathology). Additionally, although these results elucidate within-person changes over months, results may not generalize to other time lags. 32 A continuous time approach could help address the issue of time-interval dependency and also account for variation in time between assessments. 41 Lastly, it is unclear if/how the CES-D administration was adapted for individuals with aphasia and aphasia may have interfered with item comprehension and responding. 42
Conclusion
This study examined cross-lagged effects between depression symptom dimensions in individuals with stroke during the year following discharge from rehabilitation units. We found reciprocal within-person associations between anhedonia and somatic symptoms over the first 3 months post-discharge and across the subsequent 9 months. These bidirectional relationships may be important for targeted intervention since targeting 1 symptom dimension may prevent increases in others. Future research should use ecological momentary assessments 43 to further investigate the dynamic nature of these depression symptoms and examine how somatic symptoms and anhedonia are impacted by different treatments in different stroke groups.
Supplemental Material
sj-docx-1-nnr-10.1177_15459683221143464 – Supplemental material for Longitudinal Trajectories of Post-Stroke Depression Symptom Subgroups
Supplemental material, sj-docx-1-nnr-10.1177_15459683221143464 for Longitudinal Trajectories of Post-Stroke Depression Symptom Subgroups by Sameer A. Ashaie, Carter J. Funkhouser, Roxana Jabbarinejad, MD, Leora R. Cherney and Stewart A. Shankman in Neurorehabilitation and Neural Repair
Footnotes
Declaration of Conflicting Interests
The author(s) declared no potential conflicts of interest with respect to the research, authorship, and/or publication of this article.
Funding
The author(s) disclosed receipt of the following financial support for the research, authorship, and/or publication of this article: Sameer A. Ashaie was funded by the Switzer Merit Research Fellowship #90SFGE0014 from the National Institute on Disability, Independent Living, and Rehabilitation Research (NIDILRR). Carter J. Funkhouser was funded by the National Institute of Mental Health (F31 MH123042).
Supplementary material for this article is available on the Neurorehabilitation & Neural Repair website along with the online version of this article.
References
Supplementary Material
Please find the following supplemental material available below.
For Open Access articles published under a Creative Commons License, all supplemental material carries the same license as the article it is associated with.
For non-Open Access articles published, all supplemental material carries a non-exclusive license, and permission requests for re-use of supplemental material or any part of supplemental material shall be sent directly to the copyright owner as specified in the copyright notice associated with the article.