
Abstract
Background
Transcranial direct current stimulation (tDCS) promotes recovery after stroke in humans. The underlying mechanisms, however, remain to be elucidated. Animal models suggest tDCS effects on neuroinflammation, stem cell proliferation, neurogenesis, and neural plasticity.
Objective
In a longitudinal study, we employed tDCS in the subacute and chronic phase after experimental focal cerebral ischemia in mice to explore the relationship between functional recovery and cellular processes.
Methods
Mice received photothrombosis in the right motor cortex, verified by Magnetic Resonance Imaging. A composite neuroscore quantified subsequent functional deficits. Mice received tDCS daily: either 5 sessions from day 5 to 9, or 10 sessions with days 12 to 16 in addition. TDCS with anodal or cathodal polarity was compared to sham stimulation. Further imaging to assess proliferation and neuroinflammation was performed by immunohistochemistry at different time points and Positron Emission Tomography at the end of the observation time of 3 weeks.
Results
Cathodal tDCS at 198 kC/m2 (220 A/m2) between days 5 and 9 accelerated functional recovery, increased neurogenesis, decreased microglial activation, and mitigated CD16/32-expression associated with M1-phenotype. Anodal tDCS exerted similar effects on neurogenesis and microglial polarization but not on recovery of function or microglial activation. TDCS on days 12 to 16 after stroke did not induce any further effects, suggesting that the therapeutic time window was closed by then.
Conclusion
Overall, data suggest that non-invasive neuromodulation by tDCS impacts neurogenesis and microglial activation as critical cellular processes influencing functional recovery during the early phase of regeneration from focal cerebral ischemia.
Introduction
Stroke is a leading cause of death and disability in our society, primarily as specific therapeutic rehabilitation strategies remain limited.1-4 The potential of novel non-invasive brain stimulation methods, for example, transcranial direct current stimulation (tDCS), to promote recovery in human patients has been investigated for decades and is widely considered promising after stroke and other conditions,5-14 although large randomized clinical trials are lacking. Furthermore, the neurobiological mechanisms underlying non-invasive brain stimulation remain poorly understood, and standardized protocols have not been established. As a result, non-invasive neuromodulation has not yet found its way into clinical routine.
We and others have contributed to further understanding of tDCS effects using experimental animal models and found relevant tDCS impacts on neuroinflammation, stem cell proliferation, neurogenesis, and neural plasticity.15-18 Moreover, in line with clinical studies in patients, tDCS accelerates motor recovery in the rodent after stroke.19-21 However, functional recovery after a stroke occurs much faster in rodents than humans, requiring caution in translating results. 22 Besides, to further our understanding of the molecular and cellular processes underlying tDCS-enhanced recovery of function, it is crucial to correlate the molecular and cellular effects evoked by tDCS to the time course of functional recovery in the experimental animal due to establish the actual relevance of these observations and ultimately aid translation into the clinic.
The current study aimed to characterize the effects of tDCS of different polarities and current densities in a mouse model in the subacute and chronic phase of focal cortical stroke in a longitudinal fashion. We hypothesized an electrophysiologically modifiable reciprocal interplay of cellular responses and functional recovery.
Recovery of function was measured by a dedicated composite neuroscore.23,24 Immunohistochemical readouts characterized tDCS-effects on neurogenesis, microglial activation, and –polarization. Additional non-invasive multimodal imaging by Magnetic Resonance Imaging (MRI) and Positron Emission Tomography (PET) should facilitate the translation of the acquired data.
Methods
Animal procedures followed the German Laws for Animal Protection and were approved by the local animal care committee and governmental authorities (Landesamt für Natur-, Umwelt- und Verbraucherschutz Northrhine-Westfalia, Germany, AZ 84-02.04.2015.A389). In total, 62 male C57BL/6JRj mice were investigated, aged 10 to 12 weeks (Janvier Labs, Le Genest St Isle, France), weighing 28 to 35 g. Ten mice had to be excluded due to insufficient infarct demarcation, missing functional deficits, or problems during experimental processing. Figure 1A illustrates the timeline of all experimental procedures, and Figure 1B offers more details on the quantities of animals in the study.
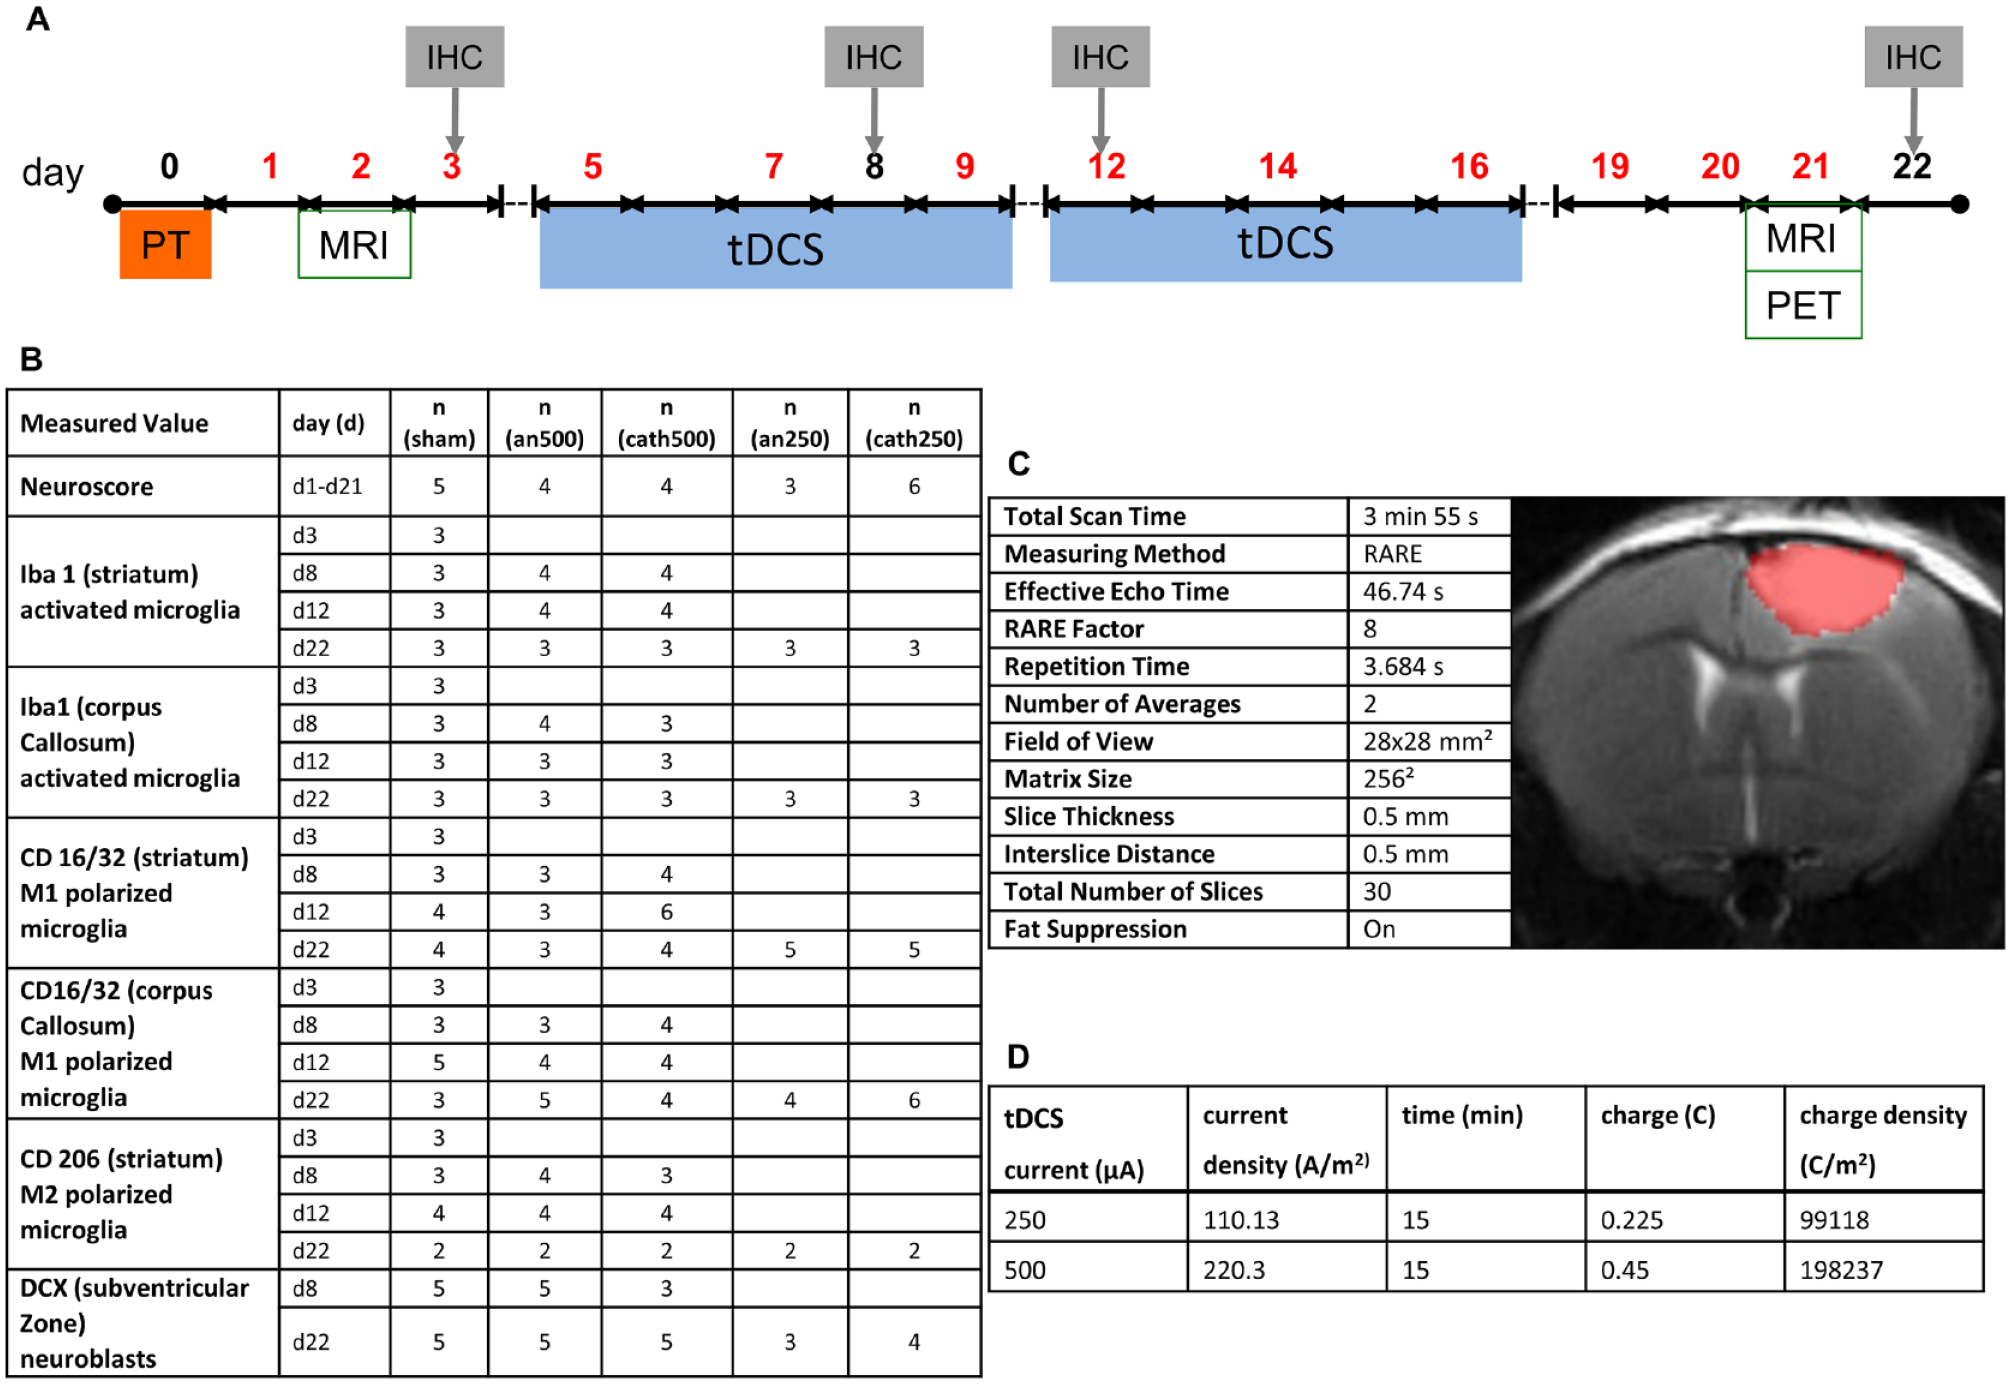
Overview of the experimental procedures. (A) Two days after photothrombosis (PT), magnetic resonance imaging (MRI) quantified the ischemic lesion. From day 5 to 9 and day 12 to 16, mice received transcranial direct current stimulation (tDCS, blue bar). Motor function was assessed by neuroscore on days 1, 2, 3, 5, 7, 9, 12, 14, 16, 19, and 20 (red digits). On day 21 (d21), selected animals underwent another MRI session, followed by Positron Emission Tomography (PET) using the tracers [18F]FLT and [11C]PK11195. The following day, animals were sacrificed for immunohistochemistry (IHC). Additional animals were sacrificed at days 3, 8, and 12 for immunohistochemical analyses only. (B) Number (n) of male C57BL/6JRj mice submitted to tDCS of different polarities at certain timepoints/-periods and related measurements of the functional deficit and immunohistochemical analysis. (C) Details on tDCS. (D) MRI (T2) details and representative image of a photothrombotic infarct before treatment. Infarct sizes did not vary between treatment groups (not shown).
Photothrombosis
In order to produce focal cortical lesions of consistent size and localization in the defined forelimb area, we chose photothrombosis as a stroke model.25-29 The induced cortical ischemic lesions with subsequent functional deficits were highly reproducible on anatomic, topographic, and functional levels.
For surgery, animals were anesthetized by inhalative isoflurane (4% induction; 1%-1.5% maintenance) and received local analgesia by bupivacaine hydrochloride (subcutaneously, 0.25%; Actavis, München, Germany). Carprofen (intraperitoneal, 4 mg/kg; Pfizer, Berlin, Germany) served as postsurgical analgesia. Physiological body temperature and respiration rate were monitored using in-house equipment and DASYLab 9.0 (DasyLab, Moenchengladbach, Germany). Photothrombosis was carried out as described previously +1.5 mm lateral and +0.5 anterior to the bregma.24,30 Briefly, anesthetized animals were placed into a stereotactic frame. The skull was exposed via a midline skin incision. Five minutes after intraperitoneal injection of the photosensitizer dye Rose Bengal (0.1 ml at 10 mg/ml; Sigma-Aldrich), the right hemisphere was illuminated with an LED light source (cold light source Zeiss CL 6000 LED, intensity: LED70) through an aperture measuring 3 × 2.5 mm2 that was placed directly onto the skull for 15 minutes. After that, the scalp incision was sutured, and the mice were transferred to their home cage to recover.
Magnetic Resonance Imaging
T2-weighted MRI was performed on days 2 and 21 after photothrombosis to evaluate stroke induction and measure the resulting infarct size. We used an 11.7 T BioSpec system (Bruker BioSpin, Ettlingen, Germany). For further technical details, please refer to Figure 1C. Animals were anesthetized with isoflurane (4% initially and 1%-2% maintenance) and placed on a specifically designed cradle for mice MRI (BioSpec® Bruker, Ettlingen, Germany). Physiological body temperature and respiration rate were continuously surveilled by DASY Lab version 9.0 software. After imaging had been finalized, animals were transferred to a recovery box before returning to their homecages.
Infarct sizes were measured by VINCI 5.06 for Windows (Max Planck Institute for Metabolism Research, Cologne, Germany). 31
Transcranial Direct Current Stimulation
After verification of ischemia by MRI on day 2, mice were randomized to receive either sham or anodal (an) or cathodal (cath) tDCS with 250 µA (110.13 A/m2) or 500 µA (220.3 A/m2) from days 5 to 9 and partly also days 12 to 16 after stroke (Figure 1D). TDCS was applied ipsilaterally directly adjacent to the photothrombotic lesion at −1.5 mm posterior and +1.5 mm lateral to the bregma with a contact area of 2.27 mm2 as described previously.32,33 Charge (Q) and contact area (A) were used to calculate charge- and current-density. Each tDCS session took 15 minutes (Figure 1D). The duration of tDCS sessions was adapted from previous studies by us and others.33-36
Behavioral Tests
Behavioral tests were carried out in a double-blinded fashion at baseline before the stroke and on days 1, 2, 3, 5, 7, 9, 12, 14, 16, 19, and 21 after stroke using a composite neuroscore, primarily testing motor function of the left forelimb as it has been established in previous studies.23,24,37,38 Figure 2A lists the complete parameters of the neuroscore. In brief, we investigated the left forelimb flexion in suspension, paw placement of the left front and hind paw, the whisker reflex of the left side, and the mice’s ability to walk on a ladder (length 50 cm, bars every 2 cm). The maximum score was 22. Animals were excluded if they did not reach the maximum score of 22 before induction of ischemia and scored better than 11 on day 1 or 2 after stroke.
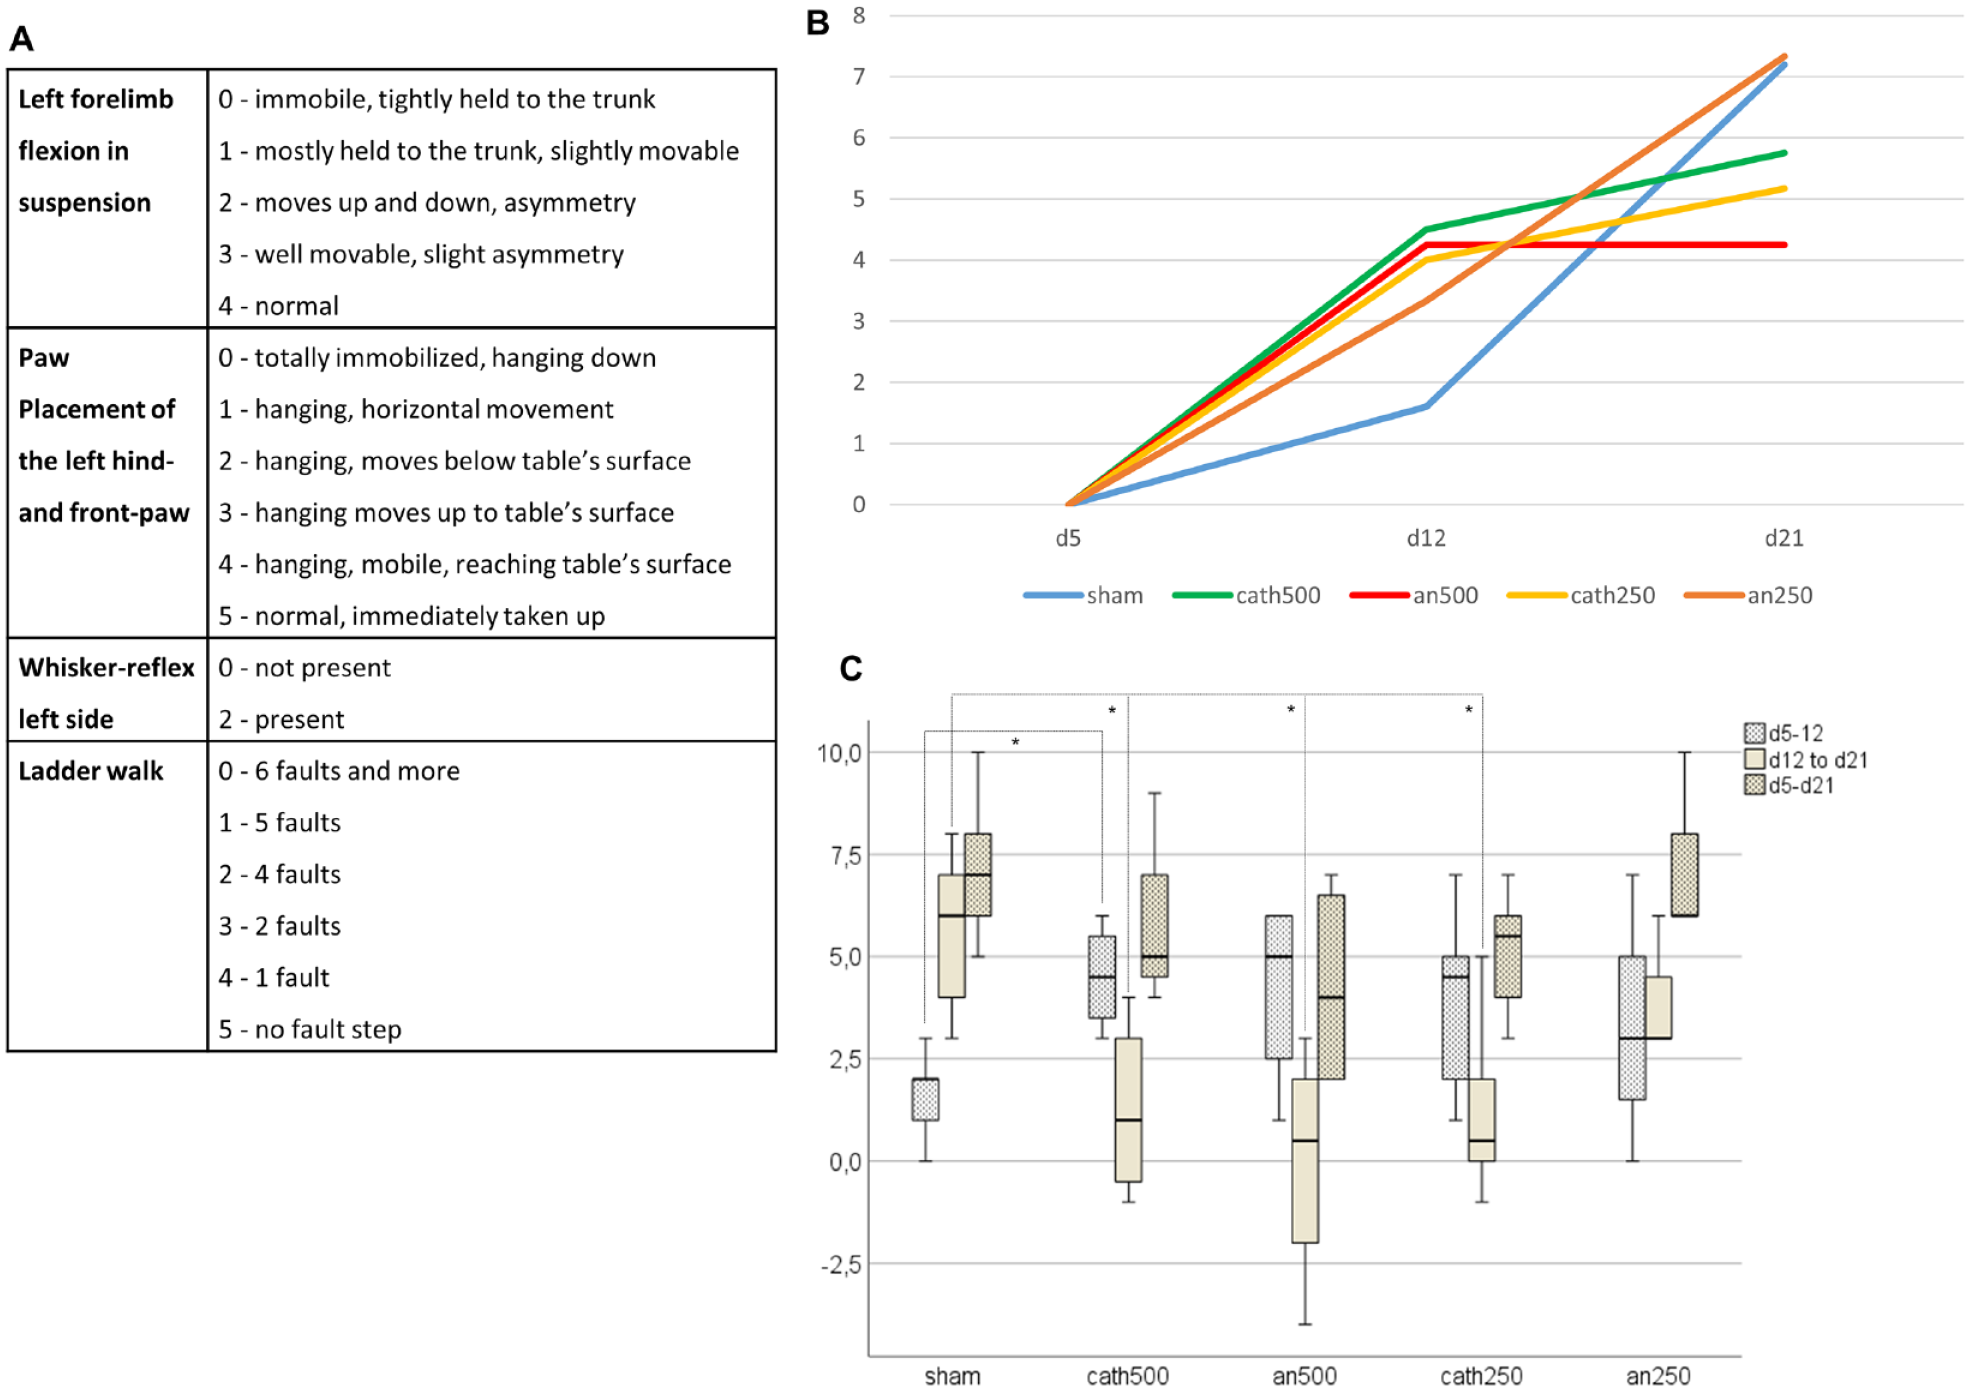
Cathodal tDCS accelerated motor recovery after stroke. (A) Details on the applied neuroscore. (B) Mean of recovery to day 5 over time in different treatment groups (neuroscore dx-neuroscore d5): sham (blue), cathodal tDCS at 500 μA (cath500, green), anodal tDCS at 500 μA (an500, red), cathodal tDCS at 250 μA (cath250, yellow), anodal tDCS at 250 μA (an250, orange). Recovery was enhanced under tDCS compared to sham until day 12, especially under 500 μA cathodal. (C) Boxplots of the recovery scores in each stimulation mode from day 5 to 12, day 12 to 21, and the entire stimulation period, that is, from day 5 to day 21. Mice stimulated with tDCS at 500 μA presented a significantly higher recovery score from day 5 to 12 than sham animals in the corresponding period (P = .019). During the following period, that is, from days 12 to 21, sham animals caught up and recovered significantly better than the groups at cath500, an500, and cath250 (P(sham to cat500) = .037; P(sham to an500) = .019; P(sham to cat250) = .017). Over the entire period, that is, from day 5 to day 21, groups did not differ.*P< = .05, **P< = .005, ***P< = .0005.
Positron Emission Tomography
Eight animals received PET-imaging for in vivo analysis of inflammatory and proliferative cellular processes at day 21 before being sacrificed for immunohistochemical investigations the day after, when radiation was effectively reduced (n(sham, FLT) = 1; n(sham, PK) = 0; n(cath250, FLT) = 2; n(cath250, PK) = 1; n(an250,FLT) = 1; n(an250, PK) = 1; n(cath500, FLT) = 2; n(cath500, PK) = 1; n(an500, FLT) = 2; n(an500, PK) = 1). The used tracers [11C]PK11195 (PK) and [18F]FLT (FLT) were produced as described elsewhere in more detail.39-41
The numbers of FLT- and PK-scans differ due to procedural problems in the availability of tracers. Four animals received PK and FLT simultaneously, while in the other 4, only FLT could be injected.
Animals were anesthetized with isoflurane as described above and placed into a MicroPET Focus 220 scanner (Concorde Microsystems, Inc., Knoxville, TN; USA). A thermostatically controlled heating pad maintained the physiological body temperature of 37°C ± 0.5°C, and the respiration rate was surveilled by a sensor connected to DASY Lab version 9.0 software (DasyLab, Moenchengladbach, Germany).
The first scan was a 10 minutes transmission scan using a 57 Co source for attenuation correction. The tracer [11C]PK11195 was measured in concentrations of 3.7 to 7.4 MBq/mouse immediately after the intravenous administration for up to 30 minutes. Animals remained in the scanner for the following 80 minutes while the 11C-labeled radiotracer underwent 4 halftimes, and before the following [18F]FLT PET tracer was injected in concentrations of 11.1 to 16.7 MBq/mouse. Emission data were acquired for the following 60 minutes. Afterward, animals were transported to a recovery box and transferred to their home cages.
After full 3D rebinning (span 3, ring difference 47), images were reconstructed using an iterative OSEM3D/MAP procedure, 42 [11C]PK11195 as summed images over 30 minutes, [18F]FLT as 2 frames à 30 minutes. Voxel sizes were 0.47 × 0.47 × 0.80 mm. Using the software VINCI 4.72 for MacOS X (Max Planck Institute for Metabolism Research, Cologne, Germany), images were normalized to the background with the help of a 4.3 mm3 volume of interest (VOI) in the midbrain. Images were divided by the mean value (Bq/ml) of their respective background VOI, resulting in the dimensionless standardized uptake value ratio SUVRbg. For visual inspection, PET images were projected onto their matching MR images.
Immunohistochemistry
On days 3, 8, 12, and 22 after the stroke, animals were euthanized by perfusion with 4% paraformaldehyde (PFA, Science Services, Munich, Germany) and decapitated under analgoanesthesia with a Ketamine/Xylazine mix (K: 100 mg/kg and X: 10 mg/kg; i.p.) (Figure 1B). Brains were removed and stored at −80°C, cut in coronal sections of 10 µm thickness using a Leica CM 30509 microtome, and mounted on glass slides. Sections were stained with Anti-Iba1 (dilution 1:4000 in light and 1:500 in fluorescence, #019-19741, Wako Chemicals GmbH Neuss, Germany), Anti-CD16/32 (dilution 1:2000 in light and 1:500 in fluorescence, #553141, BD Biosciences, San Jose, USA), Anti-CD206 (dilution 1:200 in light and fluorescence, #AF2535, R&D Systems Inc., Minneapolis, USA), and Anti-Doublecortin (DCX) (dilution 1:200, sc-8066, Santa Cruz Biotechnology, Dallas, USA). We used the ABC-Kit (Vector Laboratories, Burlingame, CA, USA) for light microscopy. For fluorescent images, the corresponding Alexa Fluor Secondary Antibodies were adapted. The contralesional hemisphere served as a negative control in each staining result.
Cell counts quantified inflammatory processes in 40× magnified predefined bilateral regions of interest (ROI) in the peri-infarct-zone and the corpus callosum (181 × 136 µm2) or the striatum (362 × 272 µm2). Data were collected on day 22 for sham, 250 µA, and 500 µA stimulation in anodal and cathodal mode. We analyzed 3 to 6 slides with 3 brain slices each per animal. Results from the hemisphere contralateral to photothrombosis served as a negative control for Iba1 and CD 16/32-cell counts. Values were thus intra- and interindividually normalized. As there occurred hardly any CD206-signaling within the contralesional hemisphere, we used the absolute values from the ipsilateral hemisphere here.
We bilaterally measured doublecortin (DCX) immunoreactivity in the subventricular zone (SVZ) to quantify the number of neuroblasts as a surrogate for neurogenesis. A rectangular ROI of defined length (l = 100 µm) was fitted to the SVZ; its width (w) varied according to the amount of immunoreactivity for DCX. Using microscope images in 40× magnification, the area of the resulting rectangle (100 µm × w) was quantified as described previously. 43 DCX was collected on day 8 at 500 µA-tDCS and on day 22 at 250 µA- and 500 µA-tDCS.
For imaging, we used a Keyence Biorevo BZ-9000E-Microscope and ImageJ software (Version 1.84, NIH) for further analysis. All quantifications were performed in a blinded fashion.
Statistics
SPSS (IBM SPSS Statistics 25) and Excel (Microsoft Excel 2016) served for statistical analyses. Normal distribution was controlled using the Shapiro–Wilk and Kolmogorov–Smirnov normality tests.
As data were either not normally distributed, non-parametric, or based on small group sizes, we performed Kruskal–Wallis-Tests with Bonferroni correction as stated in the results section. Statistical significance was set at P < .05.
Results
Cathodal tDCS Accelerated Motor Recovery After Stroke
Photothrombosis generated homogenous cortical infarcts as assessed by MRI on day 2 (Figure 1C). A composite neuroscore focusing on the affected left forelimb assessed motor recovery after stroke (Figure 2A). In all treatment- and control groups, animals recovered from their motor deficits over time, which is typical for mice with this stroke model (Figure 2B). As the neuroscore did not deliver continuously scalable metric data, we used the Kruskal–Wallis test for analysis.
On day 21 (d21), after having received 10 sessions of tDCS, functional results of the recovery scores from d5, that is, before the first tDCS session, to d21, that is, after 10 tDCS sessions (score[d21]-score[d5]) did not vary among groups (Kruskal–Wallis, H(4) = 5.085, P = .279) nor reveal any significances tested in pairs (cath500 to sham: Kruskal–Wallis, H(1) = 1.552, P = .213; P(cath500 to sham) = .213; anodal 500 to sham: Kruskal–Wallis, H(1) = 2.215, P = .137; P(an500 to sham) = .137; cath250 to sham: Kruskal–Wallis, H(1) = 2.776, P = .096; P(cath250 to sham) = .096; an250 to sham: Kruskal–Wallis, H(1) = 0, P = 1; P(an250 to sham) = 1).
However, mice stimulated with cathodal tDCS at 500 µA regained function significantly faster than the other groups: from d5 to d12, that is, after 5 tDCS sessions, their recovery score (score[d12]-score[d5]) was significantly higher than that of sham-operated animals (Kruskal–Wallis, H(1) = 5.507, P = .019; P(cath500 to sham) = .019, Figure 2C). The recovery scores from d5 to d12 of other tDCS-modalities were due to high variations within the groups non-significant compared to sham, although all tDCS-stimulated animals recovered mostly better than sham in this study period (Kruskal–Wallis, H(1) = 3.093, P = .079; P(cath250 to sham) = .079; Kruskal–Wallis, H(1) = 0.576, P = .448; P(an250 to sham) = .448; Kruskal–Wallis, H(1) = 2.600, P = .107; P(an500 to sham) = .107; Figure 2C). The grouped Kruskal–Wallis test of all 5 taken together (sham, cath250, an250, cath500, an500) for a gain of function from d5 to d12 was not significant (Kruskal–Wallis, H(4) = 5.436, P = .245).
As expected, the recovery scores were converging in the third week after stroke as they were approaching full recovery status (Grouped Kruskal–Wallis: H(4) = 10.990, P = .027, non-significant in paired tests after Bonferroni-Correction). In the paired tests sham-animals recovered significantly better from d12 to d21 than animals having received tDCS at cath500, an500, and cath250 (Paired Kruskal–Wallis: H(1) = 4.371, P(sham to cat500) = .037; H(1) = 5.461, P(sham to an500) = .019; H(1) = 5.659, P(sham to cat250) = .017; H(1) = 1.512, P(sham to an250) = 0.219; Figure 2C).
TDCS Enhanced Neurogenesis in the Subventricular Zone
The amount of DCX-positive neuroblasts within the SVZ was quantified, measuring the extent of the DCX-immunoreactive area ipsi- and contralateral to ischemia (Figure 3A) to assess the effects of tDCS on neurogenesis. Data were acquired on days 8 and 22 after photothrombosis. Due to the small group size and lacking normal distribution concerning values of sham animals on day 8 and an500-animals on day 22, we used non-parametric tests.
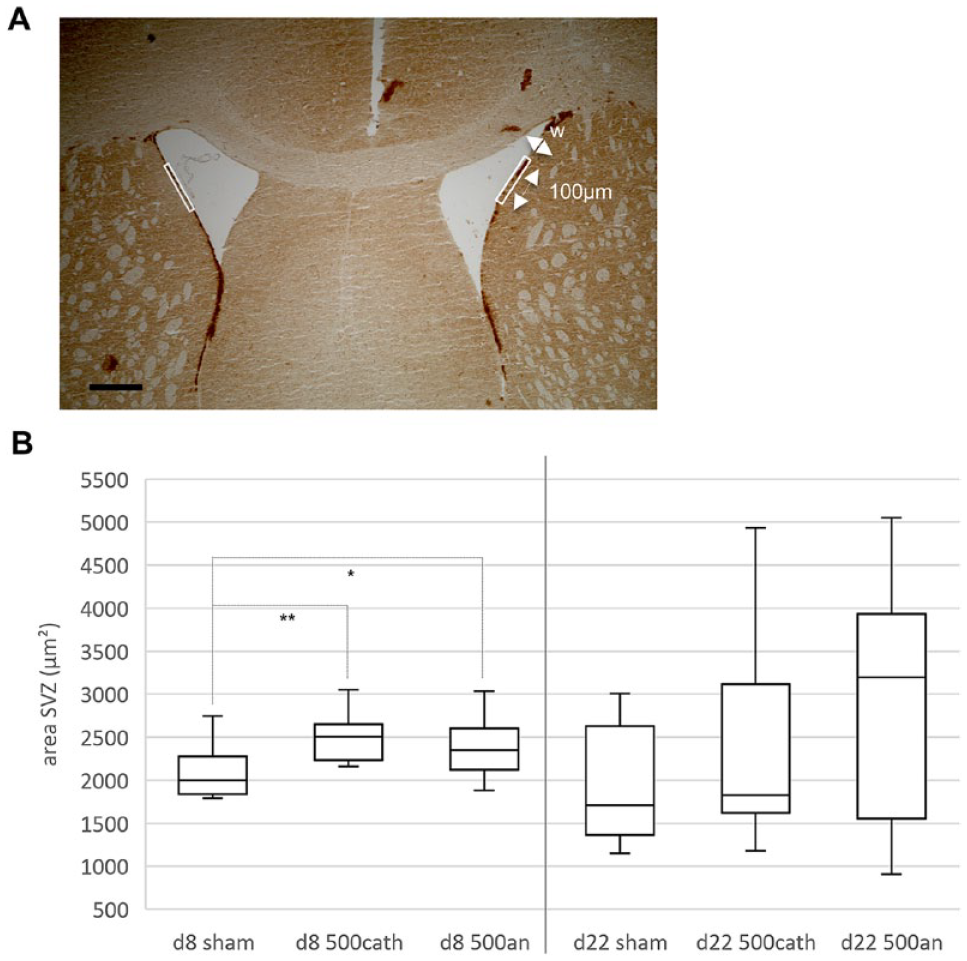
TDCS enhanced neurogenesis in the subventricular zone (SVZ). (A) Neurogenesis was assessed by bilaterally quantifying the amount of doublecortin (DCX)-positive neuroblasts in the SVZ (white rectangles). We measured an area of defined length (100 μm) and variable width (w) dependent on the extent of the DCX-immunoreactive tissue (scale bar represents 100 μm). (B) Both cathodally as well as anodally stimulated animals presented with significantly enlarged DCX-positive areas of the SVZ as compared to sham-stimulated mice 8 days after photothrombosis (P(sham/an500) = .013, P(sham/cath500) = .001). On day 22, this effect had vanished.
Eight days after photothrombosis, mice stimulated with tDCS at 500 µA in either polarity showed significantly increased neurogenesis compared to sham-stimulated animals (Kruskal–Wallis, H(2) = 14.4, P < .001; P(sham to an500) = .013, P(sham to cath500) = .001; Figure 3B). Notably, this effect was only detected 8 days after ischemia and dispersed later.
Cathodal tDCS Mitigated Microglia Activation
Activated microglia immunoreactive for Iba1 were counted in the peri-infarct zone adjacent to the ischemic lesion, in the corpus callosum, and the striatum (Figure 4A). As data were not continuously normally distributed within the 12 tested groups (sham d3, sham d8, an500 d8, cath500 d8, sham d12, an500 d12, cath500 d12, sham d22, an250 d22, cath250 d22, an500 d22, cath500 d22) and due to limited group sizes, we performed non-parametric statistical analysis by Kruskal–Wallis.
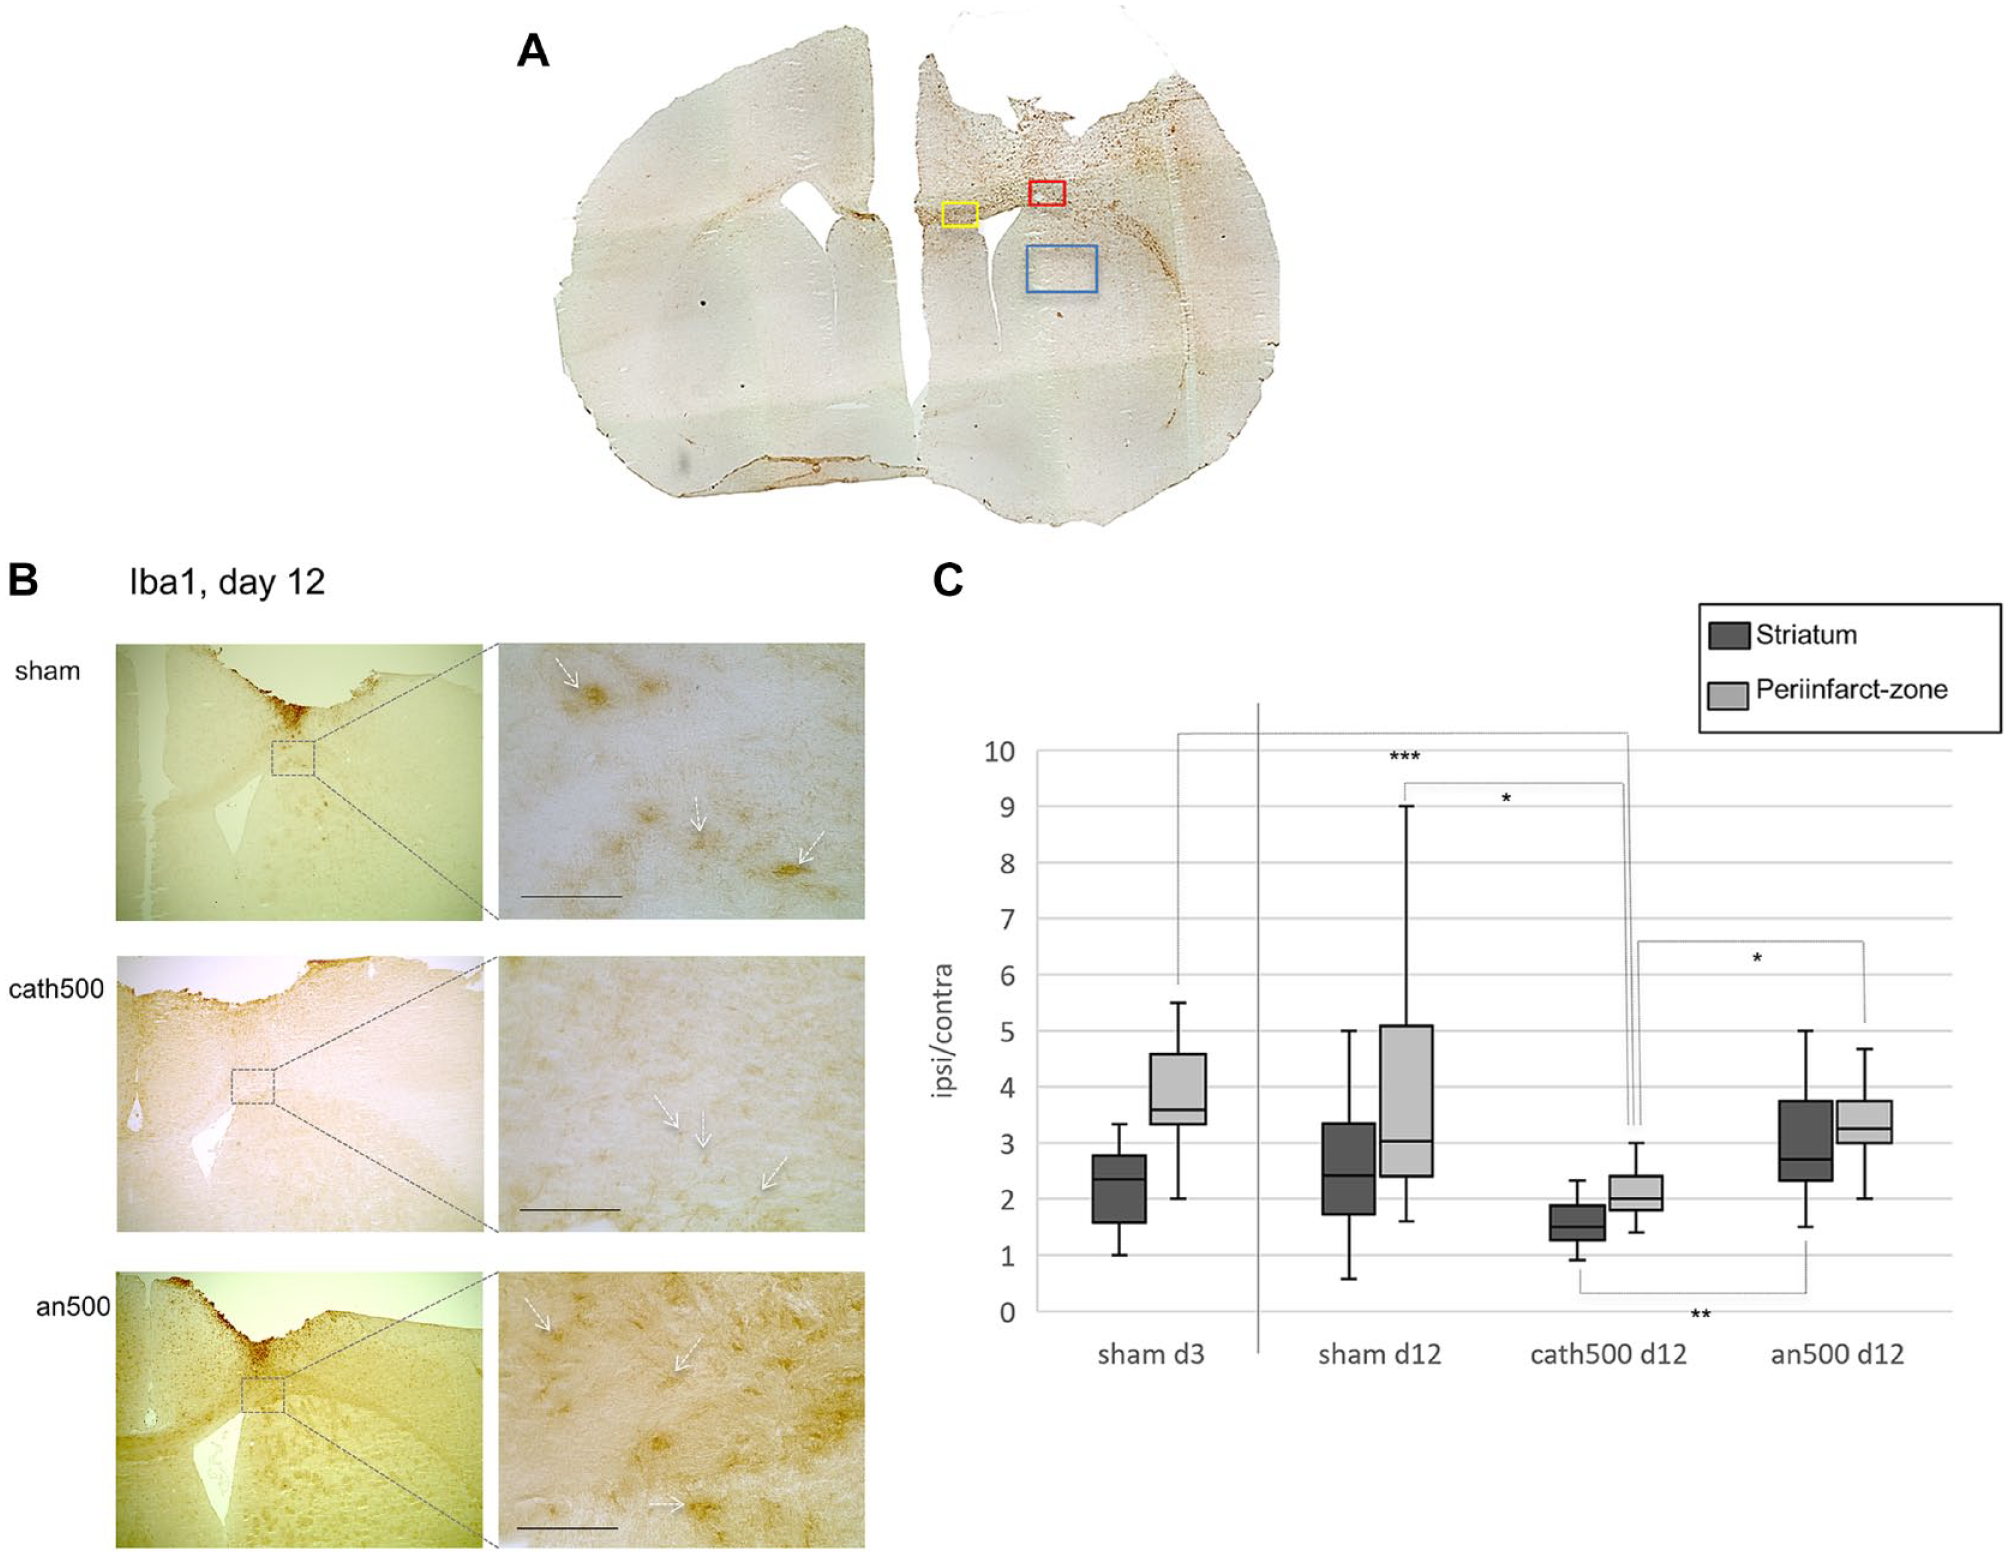
Cathodal tDCS mitigated microglia activation. (A) Microglia activation was assessed by counting Iba1-, CD16/32-, and CD206-positive microglia in the peri-infarct zone (red rectangle), the corpus callosum (yellow rectangle), and the striatum (blue rectangle), here in a CD16/32-stained example. (B) Representative immunohistochemical images within the peri-infarct zone stained against Iba1, 12 days after cerebral ischemia following sham-, cathodal-, or anodal tDCS. In animals treated with cathodal tDCS at 500 μA (cath500), fewer Iba1+ cells were detected, and their phenotype remained ramified, while amoeboidshaped microglia were observed after sham- and anodal stimulation (white arrows indicate examples, scale bars represent 100 μm). (C) Data represent Iba1+ activated microglia within the ipsilateral region of interest (striatum, peri-infarct zone) in relation to the corresponding contralateral region of interest. Following cathodal tDCS at 500 μA, microglia activation was reduced in the peri-infarct zone 12 days after cerebral ischemia in comparison to sham or anodal stimulation (P(cath500 d12 to an500 d12) = .013; P(cath500 d12 to sham d12) = .016), and compared to values on day 3 (P(cath500 d12 to sham d3) < .0001). In the striatum, cathodal tDCS reduced activated microglia as compared to anodal stimulation 12 days after cerebral ischemia (P(cath500 d12 to an500 d12) < .001).
In the periinfarct zone (Kruskal–Wallis, H(11) = 45.5, P < .0001), cathodal tDCS at 500 µA led to downregulation of activated microglia in quantity and morphology by day 12 after ischemia (P(cath500 to an500 d12) = .013; P(cath500 to sham d12) = .016; Figure 4B and C). There were significantly fewer Iba1+ cells, and their shape remained ramified under cathodal tDCS with 500 µA (Figure 4B). This effect, however, did not persist during the rest of the time course as the amount of Iba1-positive cells reincreased significantly until day 22 (P(cath500 d12 to cath500 d22) = .008), so that on day 22, all stimulation modalities presented comparable amounts of Iba1+ cells within the peri-infarct zone.
In the striatum (Kruskal–Wallis, H(11) = 61.6, P < .0001), Iba1-positive microglia were downregulated following cathodal tDCS at 500 µA 12 days after cerebral ischemia compared to anodal stimulation (P(cath500 d12 to an500 d12) < .001; Figure 4C). By day 22, Iba1-autoreactive microglia were again found in equal numbers between sham, 500 µA, and 250 µA anodally and cathodally stimulated mice within the striatum, as the quantity under anodal stimulation had significantly decreased by then (P(an500 d12 to an500 d22) < .0001). In sham stimulated animals, the quantity of Iba1+ cells decreased by trend only from d12 to d22.
Modulation of Microglia Polarization by tDCS
To assess the effects of tDCS on M1-polarized (neurotoxic) microglia, we stained against CD16/32, detecting FC-receptors expressed on phagocytes (Figure 5A). As data were not normally distributed within the tested groups and given the small group size, we performed a non-parametric statistical analysis.
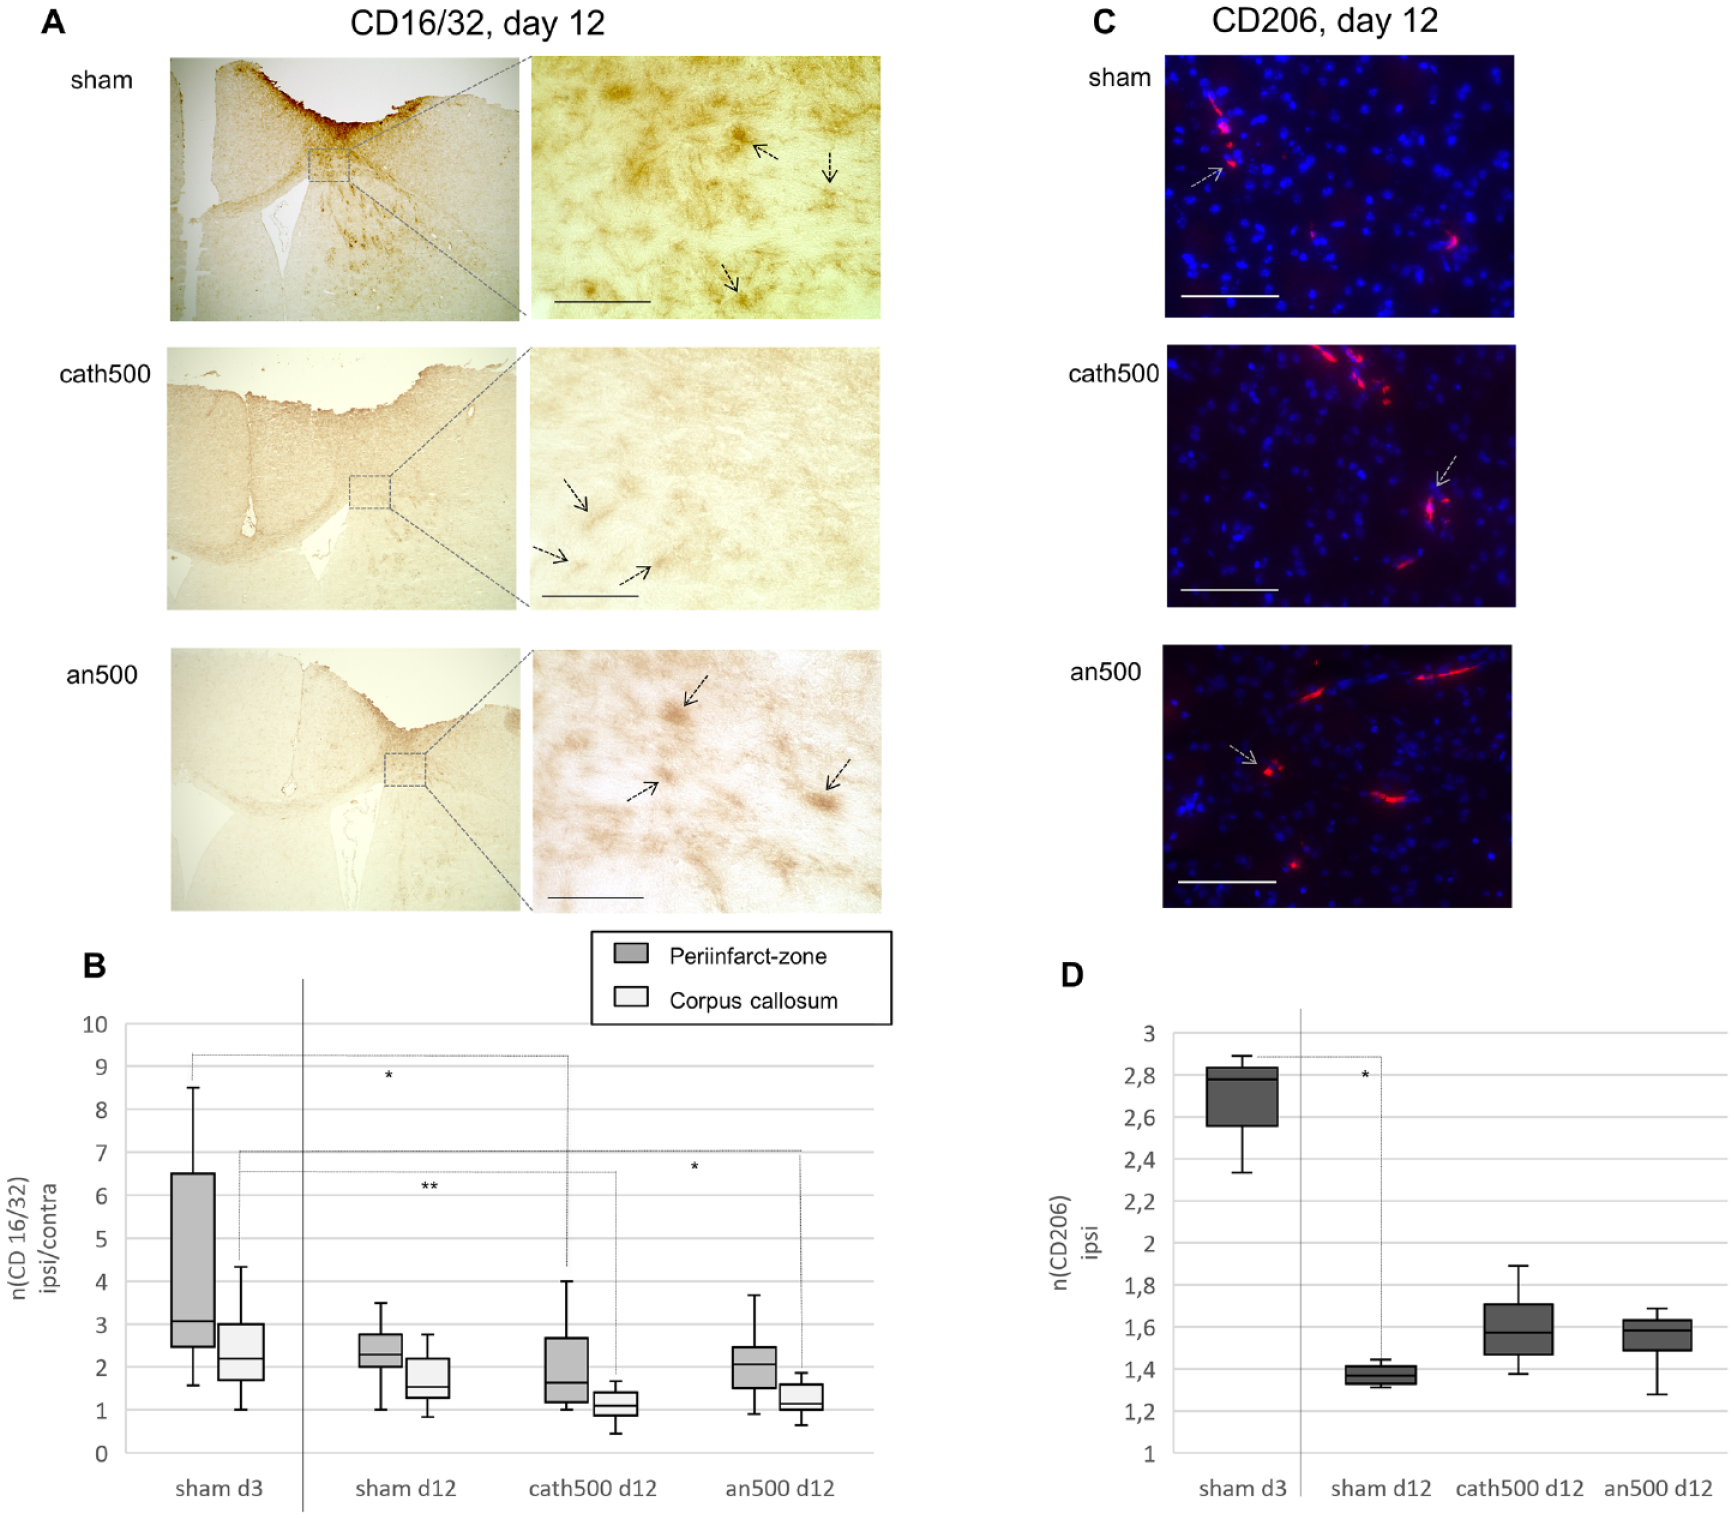
TDCS modulated microglia polarization. (A) CD16/32+ (M1) microglia in the peri-infarct zone 12 days after focal cerebral ischemia after sham-, cath500-, or an500-tDCS (black arrows indicate examples, scale bars represent 100 μm). (B) Data represent CD16/32+ (M1) microglia within the ipsilateral corresponding contralateral regions of interest (peri-infarct zone, corpus callosum). Following cathodal tDCS at 500 μA, CD16/32+ microglia decreased in the peri-infarct zone by day 12 after cerebral ischemia (P(cath500 d12 to sham d3) = .017). In the corpus callosum, both cathodal and anodal tDCS decreased numbers of CD16/32+ (M1) microglia by day 12 (P(cath500 d12 to sham d3) = .001; P(an500 d12 to sham d3) = .012). (C) CD206+ (M2) microglia within ipsilateral striatum after tDCS or sham stimulation, 12 days after cerebral ischemia (red = CD206, gray arrows indicate examples, blue = nuclear staining by Hoechst, scale bars represent 100 μm). (D) After cerebral ischemia, CD206+ (M2) microglia were downregulated over time. However, in contrast to sham, reduction of CD206+ microglia from d3 to d12 was not significant under tDCS with 500 μA (P(sham d3 to sham d12) = .02; P(sham d3 to cath500 d12) = .554; P(sham d3 to an500 d12) = .289).*P < = .05, **P < = .005, ***P < = .0005.
TDCS with 500 µA in both cathodal- as well as in anodal polarity led to a faster downregulation of CD16/32+ and thus neurotoxic microglia, in the corpus callosum (Kruskal–Wallis, H(11) = 19.2, P < .002) from day 3 to 12 (P(cath500 d12 to sham d3) = .001; P(an500 d12 to sham d3) = .012; P(sham d12 to sham d3) > .05; Figure 5B). In the peri-infarct zone (Kruskal–Wallis, H(11) = 57.0, P < .0001), the same effect was mediated only by cathodal but not by anodal, tDCS (P(cath500 d12 to sham d3) = 0.017; Figure 5B). In the striatum, CD16/32+ neurotoxic M1-microglia was unaffected by tDCS. As postischemically expected, the amount of CD16/32+ cells under all tDCS-modalities and sham peaked within the striatum, as a site of secondary postischemic inflammatory processes after cortical stroke, around day 12 and gradually decreased in the following.
Cells were stained against the mannose-receptor 1 marker CD206 to assess the effects of tDCS on M2-polarized microglia (Figure 5C). There was hardly any signal observable in the peri-infarct zone or the corpus callosum. Thus, we only investigated the striatum for CD206 (Figure 4A). Focal ischemia led to a transient upregulation of CD206+ microglia lasting from day 3 to day 8, followed by a fast decrease to day 12 and further to day 22, when CD206 had merely vanished (Figure 5D). While CD206+ microglia were reduced significantly under sham stimulation, their level remained more stable under 500 µA-tDCS without significant decrease between day 3 and day 12 (Kruskal–Wallis, H(3) = 8.7, P < .03; P(sham d3 to sham d12) = .02; P(sham d3 to cath500 d12) = .554; P(sham d3 to an500 d12) = .289) (Figure 5D). Due to the small group size and lacking normal distribution, non-parametric statistical analysis was performed.
These findings suggest a negative correlation between tDCS and M1-microglia and a positive correlation between tDCS and microglia of M2-phenotype during the subacute phase after stroke, although there was no significant difference between groups at d12.
Within the Contralateral Hemisphere, Neuroinflammation was Not Altered by tDCS
Values of Iba1, CD16/32, and CD206 within the contralateral hemisphere were not modified by tDCS. The corresponding cell counts did not show any differences between the stimulation groups at any time.
Non-Invasive Imaging of Proliferation and Neuroinflammation
Multimodal non-invasive imaging, including structural MRI (Figure 6A) and PET-imaging (Figure 6B-E), was performed on day 21 in 8 selected animals.
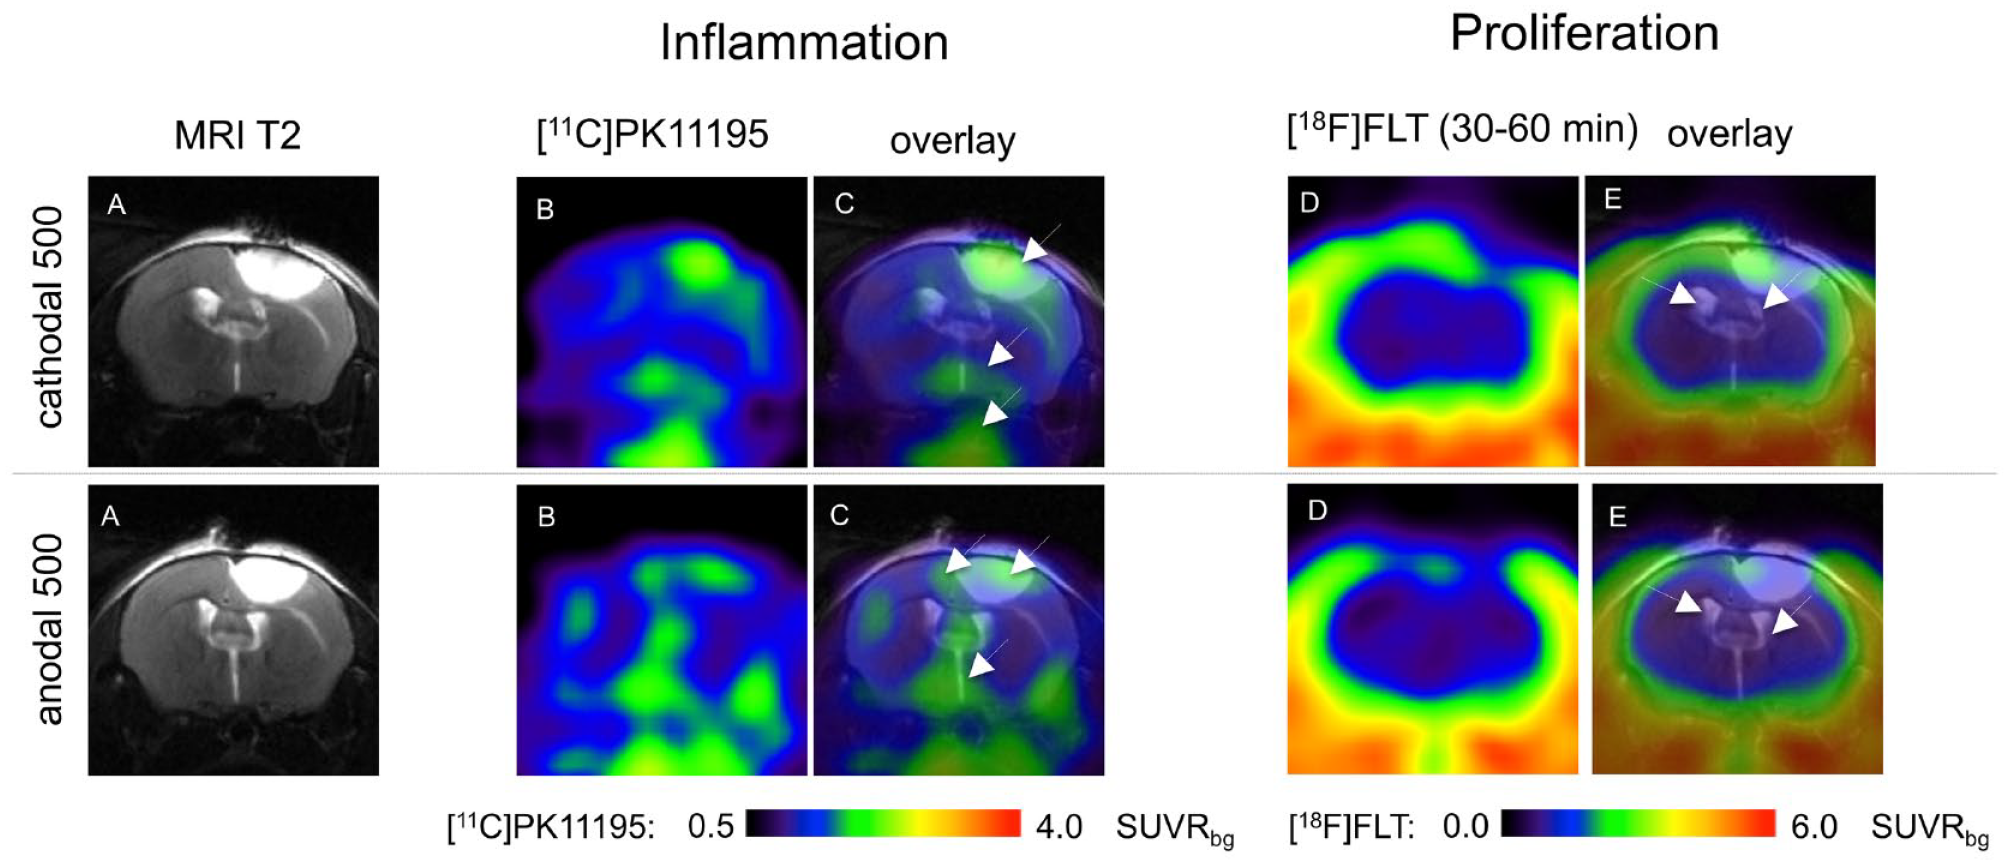
Non-invasive imaging of proliferation and neuroinflammation; Multimodal imaging 21 days after cerebral ischemia was performed in selected animals. It included structural T2-weighted Magnetic Resonance Imaging (T2-MRI) (A) and Positron-Emission-Tomography (PET) with [11C]PK11195 to detect neuroinflammation (B, C) and [18F]FLT to assess proliferative activity (D, E). Columns (C) and (E) show MRI- and PET-data individually co-registered as overlaid images. The upper row presents an animal stimulated with cath500 tDCS, and the lower an animal stimulated with an500 tDCS. Data are depicted as standard uptake values (SUV). The presented images are located at the site of photothrombosis (+1.5 lat./+0.5 ant. to bregma). Data revealed inflammatory processes within the infarct and in the peri-infarct zone as well as at sites of secondary neurodegeneration (arrows). [18F]FLT did not reveal any signs of proliferation in this late phase of 3 weeks after stroke, especially not within the subventricular zone (arrows).
Due to the restricted number of animals, quantification was not pursued. In line with ex vivo immunohistochemistry and previously published data, in vivo PET revealed neuroinflammatory processes in the (peri-)infarct zone and—to a lesser extent—in the striatum and further downstream toward the midbrain and brainstem at sites of secondary degeneration.40,44 Polarization of tDCS did not impact these, and proliferative processes were not detected in vivo by FLT-PET 3 weeks after ischemia.
With the study under way, immunohistochemical analyses revealed that tDCS did not impact neuroinflammation and proliferation beyond day 12 after stroke. Thus, after obtaining the first PET results, we did not expect further information here. Accordingly, we abandoned further late PET studies for animal welfare.
Discussion
Our data show that tDCS beneficially modulates neurogenesis and neuroinflammatory processes when applied 5 to 9 days after focal cerebral ischemia. TDCS stimulated neurogenesis, mitigated microglia activation, and diminished microglia polarization toward the neurotoxic CD16/32+ M1-phenotype while stabilizing microglia polarization toward neuroprotective CD206+ M2-phenotype within the second week after induction of stroke. Notably, tDCS-associated enhancement in motor recovery occurred within the same period, suggesting a direct link between cellular responses and functional recovery. Effects were most pronounced with cathodal tDCS, but neurogenesis and effects on microglia polarization were also observed following anodal tDCS.
Other studies have previously implied a role of tDCS in modulating neuroinflammation in the rodent brain after focal cerebral ischemia.16,17,19,21,45,46 Our data corroborate recent findings on the downregulation of post-stroke inflammatory responses in the peri-infarct area following cathodal tDCS.21,47 Besides, our results support the hypothesis that downregulation of inflammatory processes correlates with improved recovery of function and that M1 polarized microglia play a more detrimental role—while M2 polarized microglia are more supportive in tissue reorganization and functional recovery after stroke.23,48-51 We could non-invasively verify our findings on cellular responses after tDCS by PET-imaging on day 21, which qualitatively confirmed our ex vivo results as one of the keys to a successful clinical translation in the future.40,44 However, future PET studies should be performed at earlier times post-stroke for visualization of neuroinflammation.
The present data demonstrate an acceleration but no long-term recovery improvement. From a translational perspective, human stroke leads to neurological deficits that mainly persist, albeit to a variable extent. Any acceleration of recovery (by tDCS) will be precious in such a situation. Unlike the experimental setup, any step forward in the human rehabilitation process will likely facilitate further progress impacting early and long-term rehabilitation.52-54 Patients might even be less prone to post-stroke depression, representing a severe burden to recovery after stroke. 55 The application of tDCS as an adjunctive treatment in rehabilitation regimes after stroke could thus effectively improve recovery of function. Consistently, the recent literature shows that in humans, tDCS improved long-term motor recovery when applied in addition to established rehabilitation regimes but not alone.56-58 In this context, it would be interesting to investigate tDCS combined with physical exercise or an enriched environment, which was not addressed in this study. However, both enhanced recovery of function and modulation of inflammation after stroke have repeatedly been demonstrated.50,59-62
Moreover, data from human studies revealed that a higher current density but not a larger number of tDCS sessions led to functional improvement in stroke patients.58,63 We applied tDCS at a high current density up to 220.3 A/m2 (500 µA) as a proof-of-principle setup in analogy to previous studies and reproduced a dose-dependent effect in our experiments.16,32,33,45 Regarding the optimal polarity of tDCS, results from human and animal studies are inconclusive. 64 Experimental rodent studies suggested that tDCS in either polarity might reduce neuronal damage, decrease microglia activity, and enhance functional recovery during the acute or subacute phase after stroke.18-20,47 Our data suggest that 5 sessions of cathodal tDCS applied ipsilesionally starting the first week after focal cortical stroke is most effective in mice. Additional tDCS sessions on days 12 to 16 after stroke did not benefit recovery, the modulation of neuroinflammation, or neurogenesis.
Spatial distribution of the electric field of tDCS over the rodents’ brains probably includes a range of magnitudes varying across the whole brain of the mouse with a supposed stimulation depth of about 2.48 mm.65-70 In our study, tDCS-associated inflammatory processes occurred in regions near the site of electric stimulation. We did not obtain any alteration of post-stroke inflammation in the contralateral hemisphere, suggesting focal tDCS-effects on inflammatory processes. Future research monitoring electric fields over the brain, for instance, by electrocorticographic instruments, could shed further light on the spatial distribution of electric fields in this setup.
We chose photothrombosis as a stroke model, although its translational validity has been criticized since it does not account for the heterogeneity of human stroke. Human stroke lesions typically extend beyond the cortex, and the penumbra is wider than the perilesional rim of photothrombosis. 29 However, we just recently described the similarity of network alterations after stroke across species, including the model of photothrombosis facilitating its clinical translation71,72 and reconfirming the advantages of photothrombosis for our setup: It is a minimally invasive, easily performed technique that produces homogenous ischemic lesions in specifically defined cortical regions of the rodent’s brain, which, unlike middle-cerebral-artery-occlusion-induced lesions, are well retained during procedures.23,27,30,73 Lesion homogeneity further facilitates in vivo image investigations, for example, matching frames in the case of multimodal imaging as in the present study. Moreover, a cortical stroke induced by photothrombosis is especially amenable to tDCS-studies as the superficial electric field of tDCS reaches the lesion and its surrounding tissue.
For rodent behavior experiments, photothrombosis can be used to produce predictable and interindividually comparable functional deficits, as the homogenous lesions may be located in nearly any desired cortex region. 26
However, due to the small lesion size, the functional deficit is relatively discrete. Since mice’s motor deficits recover quickly due to natural flight responses, it is challenging to define a behavioral test, especially in longitudinal studies covering the chronic post-stroke phase. We recently described that the here applied neuroscore is a suitable tool, providing better data than, for example, the catwalk. 24 Still, in our study, a ceiling effect must be considered. 74 Our composite score decreases data granularity, and the obtained data is neither parametric nor continuously scalable, which limits statistical analysis. Putative additional subtle effects of tDCS might thus have been masked, especially in the late phase of the study. Moreover, the number of animals investigated was relatively low, providing small group sizes further impeding statistical analysis (Figure 1B). For future research, we would consider more extensive group sizes, fewer statistical variables, and behavioral tests providing continuous scales such as nest building activity, the cylinder test, or the grip strength test, whose exceptional consistency in detecting functional deficits in mice in the chronic phase after motor cortex lesions has been reported. 20
Conclusion
Our data provide evidence for a reciprocal interplay between structural and functional changes after focal cerebral ischemia and suggest an optimal time window for cathodal tDCS 5 to 9 days after focal cerebral ischemia in mice to modulate cellular regenerative processes and accelerate recovery. Deeper insights into the corresponding neuronal network changes will help further decipher the underlying mechanisms and translate tDCS into human studies.
Footnotes
Acknowledgements
There was no commercial interest in this study.
Declaration of Conflicting Interests
The author(s) declared no potential conflicts of interest with respect to the research, authorship, and/or publication of this article.
Funding
The author(s) disclosed receipt of the following financial support for the research, authorship, and/or publication of this article: The study was supported by the Deutsche Forschungsgemeinschaft ((DFG, German Research Foundation): project ID 431549029–SFB 1451) and by the “Köln-Fortune-Programm” (project number 158/2013).