
Abstract
Background
The integration of oxygen cost into the accelerometer’s algorithms improves accuracy of total energy expenditure (TEE) values as post-stroke individuals walk. Recent work has shown that oxygen cost can be estimated from specific prediction equations for stroke patients.
Objective
The objective is to the validity of the different oxygen cost estimation equations available in the literature for calculating TEE using ActigraphGT3x as individuals with stroke sequelae walk.
Method
Individuals with stroke sequelae who were able to walk without human assistance were included. The TEE was calculated by multiplying the walking distance provided by an ActigraphGT3x worn on the healthy ankle and the patient’s oxygen cost estimated from the selected prediction equations. The TEE values from each equation were compared to the TEE values measured by indirect calorimetry. The validity of the prediction methods was evaluated by Bland–Altman analysis (mean bias (MB) and limits of agreement (LoA) values).
Results
We included 26 stroke patients (63.5 years). Among the selected equations, those of Compagnat and Polese obtained the best validity parameters for the ActigraphGT3x: MBCompagnat = 1.2 kcal, 95% LoACompagnat = [−12.0; 14.3] kcal and MBPolese = 3.5 kcal, 95% LoAPolese = [−9.2; 16.1] kcal. For comparison, the estimated TEE value according to the manufacturer’s algorithm reported MBManufacturer = −15 kcal, 95% LoAManufacturer = [−52.9; 22.8] kcal.
Conclusion
The Polese and Compagnat equations offer the best validity parameters in comparison with the criterion method. Using oxygen cost prediction equations is a promising approach to improving assessment of TEE by accelerometers in post-stroke individuals.
Introduction
Limitation of an individual’s physical mobility is a common effect of stroke and frequently lowers participation in physical activities. 1 Consequently, increasing physical activity is a relevant treatment with positive effects on the entire stroke recovery pathway. 2 Physical activity is defined as ‘any bodily movement produced by skeletal muscles that results in energy expenditure’. 3 Thus, evaluating energy expenditure provides information on the level of physical activity because it has been shown that the variations in total energy expenditure (TEE) during an individual’s day is highly correlated to physical activity (r = .79).3,4 In clinical practice, practitioners seldom measure TEE due to the difficulty related to setting up a viable recording system. On one hand, indirect calorimetry is the reference procedure to assess TEE, but this method is expensive and restrictive because the time of calibration and parameterization is important and wearing the mask can alter patients’ tolerance of the device. 5 On the other hand, the limitations of subjective monitoring techniques as self-questionnaires are well-documented and include recall errors. 6 Another solution could be using accelerometers, which are frequently used in people with neurological sequelae. 7 This technology uses the accelerations of the limb segment on which the device is placed to assess duration, intensity and TEE during physical activity. 8 Estimating TEE requires computation of raw data, which is of great complexity. Indeed, the device must be able to convert the raw accelerometry data into a physiological variable depending on multiple factors such as the type of task, intensity, duration and the individual’s bio-mechanical and cardiorespiratory characteristics.9,10 This computation is performed by an algorithm belonging to the manufacturer and not known to the user. 8 In stroke survivors, recent studies have shown that accelerometers have low validity during activities of daily living, such as walking.11,12 Indeed, Compagnat et al. and Mandigout et al. reported that accelerometers underestimate between 30% and 120% the TEE during activities of daily living. Moreover, they show a very low level of correlation with the TEE values measured by indirect calorimetry (r < .5).11,12 Stroke individuals present a pathologic gait with a decrease in step length and cadence 13 and an increase in oxygen cost (Cw). 14 As of today, no accelerometer has adapted its TEE calculation to the movement characteristics of subjects with stroke sequelae, which can vary greatly from one subject to another. 15 We have recently shown that using Cw in the accelerometer computation significantly increases the accuracy of the estimation of the TEE. 16 This calculation method estimates the TEE from the product of Cw by the walked distance. This is similar to the method developed by Ainsworth in healthy individuals, 17 except for the use of units of distance instead of time. The distance covered by stroke individuals can be accurately estimated by ActigraphGT3x. Indeed, in a recent study, Compagnat et al. 18 showed that an ActigraphGT3x worn on the ankle was an accurate device and placement for estimating the distance walked by stroke individuals in comparison to the distance reported by the examiner (percentage mean difference = 10.70%, P = .31).
The second requirement to use this new calculation method of TEE is the knowledge of Cw for each post-stroke individual. Cw is usually measured using a respiratory gas exchange analyzer at a stable metabolic state during the activity, 14 which is not performed in clinical practice. However, several prediction equations in the literature can be used to estimate the oxygen cost of walking for stroke patients. Their construction methods are similar. They are derived from the relationship between the self-selected walking speed (Sfree) and the Cw.15,19-21 Thus, Cw could be calculated from Sfree which is easily measurable in clinical practice as example from a 10 m test. However, a recent systematic review reported that these equations differ significantly in terms of methodological aspects: patients sample size and characteristics, trend curves used (polynomial, power and logarithmic...) and criterion method for the equation construction. 22 Moreover, their validation levels are uneven, with most of them lacking validation on a control population. 22 Given the heterogeneity of these equations, it seems relevant to assess the level of validity of each equation on a concrete application.
To this aim, we evaluated the validity of the TEE estimates calculated using the product of the distance estimated by an accelerometer (Actigraph GT3x worn at the unaffected ankle) and the Cw estimated using the different equations predicting the oxygen cost of walking in stroke individuals.
Materials and Methods
Participants’ Selection
Individuals with post-stroke sequelae were recruited from patients hospitalized or followed in consultation in a Physical Medicine and Rehabilitation Department. Recruitment was performed by the department’s doctors according to the following inclusion/exclusion criteria. The inclusion criteria were an individual with single stroke not being located in the cerebellum due to the potential impact on estimating Cw using the prediction equation as reported by Compagnat et al., 2020. 23 The stroke had to be confirmed by brain imaging. The participant had to be able to walk continuously for 6 minutes without human assistance (modified Functional Ambulation Classification ≥4). The exclusion criteria were any locomotor, cardiac, neurological or cognitive disorders preventing the subject from performing a 6-minute walk test (6MWT) and/or from participating. All subjects with acute cardiac or respiratory pathologies or decompensated chronic pathologies were also excluded. Exclusion for cognitive reasons was judged by the examiner, a specialist doctor in Physical Medicine and Rehabilitation.
This work is based on data collected during the routine management of post-stroke patients, in particular during gait analysis sessions carried out in the movement analysis laboratory of the Physical Medicine and Rehabilitation department of the Limoges University Hospital. The patients were informed of the use of their data recorded during the walk as well as their right to object to the use of their data in accordance with the regulations of the University Hospital of Limoges. The research protocol was accepted by the Institutional Ethic Committee (Notice number: 480-2021-136).
Participants’ Evaluation
Motor function was assessed by the Demeurisse motricity index. 24 This test quickly assesses a patient’s motor function at 3 different points per deficient limb and is validated in stroke patients. A score is calculated from 5 levels of voluntary motor control from a scale of 0 to 100, in which a score of 100 is considered healthy.24,25 Spasticity was assessed by the modified Ashworth scale (MAS). 26 The walking autonomy was assessed by the Functional Ambulation Classification modified 27 and the autonomy for activities of daily living was assessed by the Barthel index. 28
A health professional informed the participants of the details of the protocol before registering their consent.
Total Energy Expenditure Measurement
The TEE was measured by Metamax3B breathing gas exchange portable analyzer (Cortex Medical, Leipzig, Germany). The Metamax3B is a portable metabolic system composed of a measurement module and a battery module. The O2 and CO2 concentrations are measured using an electrochemical cell and an infrared analyzer. The O2 consumption (O2) and CO2 flow (
We have chosen to use TEE rather than the net energy expenditure because the selected sensor give an estimate of TEE. The measurement period was preceded by a rest period sitting in a chair lasting several minutes to ensure a metabolic state of rest before the start of the protocol. We measured oxygen consumption during the 6 minutes of walking at a comfortable pace. We did not choose to warm up because it was a comfortable walking activity that should correspond to the ‘daily’ walk and not a maximum imposed speed walk as for a 6-minute walk test. We have indeed tried to control the impact of food thermogenesis as much as possible. Thus, the evaluations took place well after meals (ideally at least 1 hour) and participants were also not allowed to drink caffeinated drinks before testing. We chose this delay of 1 hour post-meal to have a good clinical feasibility (not to restrict our patient population) and because looking at the studies on the kinetics of food thermogenesis, after the 1h post-meal, the value of EE proper to thermogenesis is lower than .11 kcal.min−1 30 what we consider as negligible for our study. The value of energy expenditure measured by the Metamax3B was our reference value and was calculated from the instantaneous oxygen consumption and respiratory exchange ratio, as recommended by McArdle et al. 3 This technique was used in several field studies.11,12,30
Total Energy Expenditure Estimations
TEE values were estimated from the prediction equations using the following formula:
d × Cw = TEE
d = distance reported by ActigraphGT3x (m)
Cw = energy cost of walking estimated from the different prediction equations (kcal.m−1)
TEE = total energy expenditure (kcal)
Oxygen Cost of Walking Estimations
Cw was calculated from different Cw prediction equations that were published. This research is the subject of a published literature review. 22 It highlighted 4 different equations:
Description of the studies from which the equations for predicting the cost of oxygen when walking are derived.
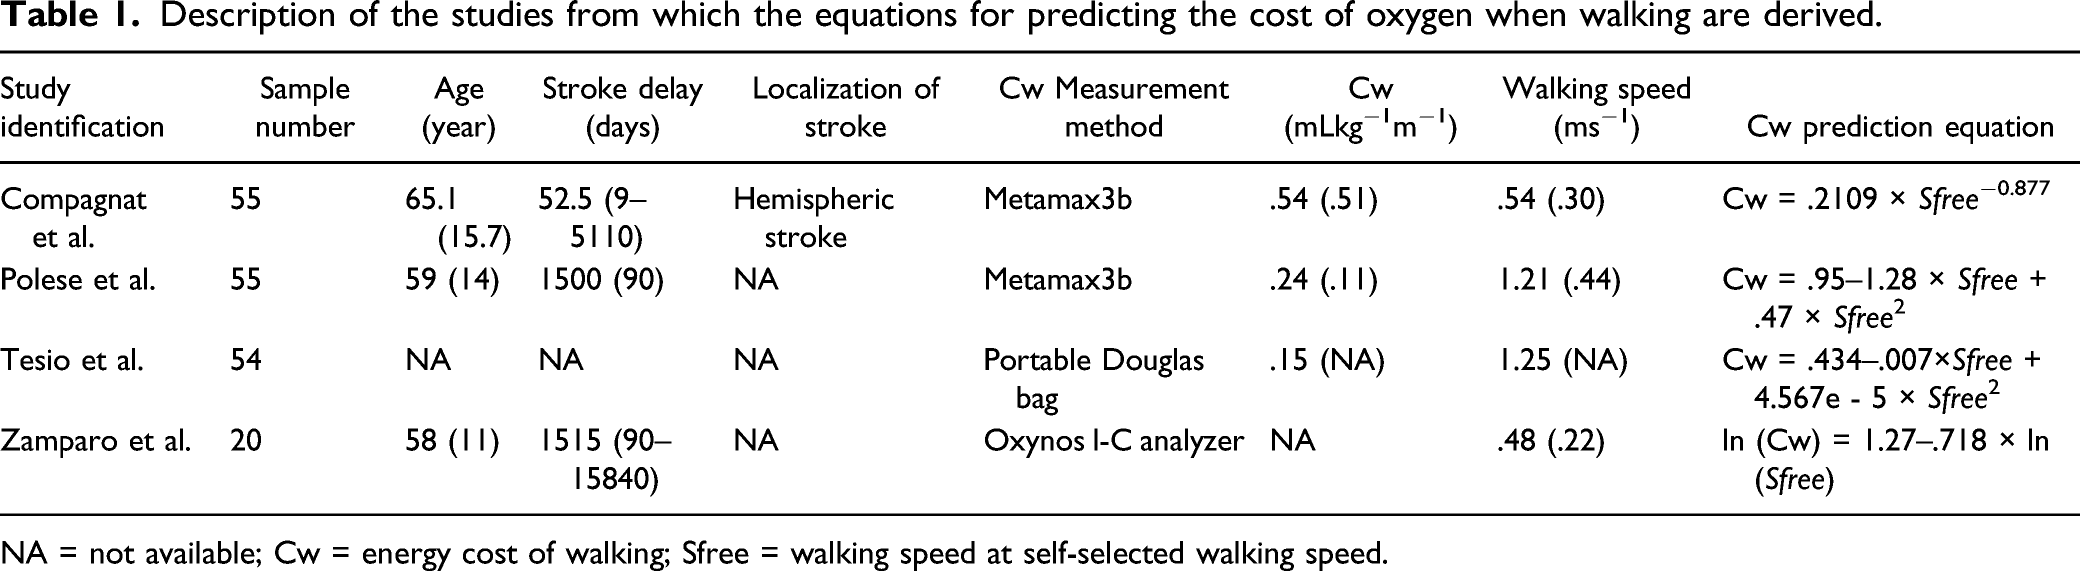
NA = not available; Cw = energy cost of walking; Sfree = walking speed at self-selected walking speed.
All these equations calculated the Cw from the Sfree. We then integrated this walking speed into the prediction equations to calculate the Cw. Classically, the prediction equations estimated a Cw expressed in mL.kg−1.m−1. To obtain a value in kcal.m−1, we multiplied the Cw in mL.kg−1. m−1 by the patients’ weight and the caloric value of oxygen according to the RER. 3
Distance Walked Estimations
The walked distance was estimated with the devices. For this, we used the method described by Compagnat et al. 18 We first measured the average step length of each participant by asking them to walk 20 steps on flat terrain at a spontaneously comfortable speed before measuring the distance they walked. This measurement was performed 3 times in total to avoid bias. For each trial, the step length was calculated by dividing the distance they walked by the number of steps. The average step length was the mean of the three trials. During the tests, the walked distance was calculated by multiplying the number of steps reported by the devices with the average step length.
Wearable Activity Tracker
The ActigraphGT3x (Actigraph LLC, Pensacola, FL, USA) is the most widely used accelerometer for physical activity evaluations in clinical research. 32 The ActigraphGT3x is a small (4.6 cm × 3.3 cm × 1.5 cm) and lightweight (42.5 g) tri-axial accelerometer designed to measure accelerations in the range of .05–2 g with a band-limited frequency of .25–2.50 Hz. This corresponds to the range in which most human activities are performed. 33 We chose a standard configuration with a standard sampling frequency of 30 Hz and no specific filtering. The device was initialized using 1-s epochs. The ActigraphGT3x data can be downloaded to a personal computer via a reader interface unit. In our work, we used the step count estimate provided by the ActigraphGT3x. It can be worn on the wrist, hip or ankle attached by an elastic band. 34 We chose to place the devices on the ankle on the unaffected side because this placement showed the best accuracy for estimating the walking distance in stroke patients. 18
The Test Protocol Was as Follows
1. Measuring the average step length over 3 trials of 20 steps. 2. Equipping the participant with ActigraphGT3x placed on the unaffected ankle and Metamax3B. 3. Six minutes of walking with the participant’s usual walking mode (with or without assistive device) at self-selected walking speed. 4. Downloading all data from devices. 5. Calculating the TEE from the distance estimated by ActigraphGT3x (number of steps x average step length) and the Cw estimated by the different prediction equations.
Statistical Analysis
We evaluated the validity of TEE values of the methods tested with analysis of agreement and accuracy parameters. Agreement parameters were limits of agreement (LoA) of Bland–Altman analysis. Accuracy parameters were the mean bias of Bland–Altman analysis. We also calculated the significance of the differences between Metamax3B values and the prediction equations values with the following statistical tests: if the variables to be compared followed a normal distribution, the statistical test used was the t-test (Student’s t-test or Welch’s t-test according to equality of the variance). If the variables did not follow the normal distribution, we used the Mann–Whitney Test.
We calculated the sample size based on previously reported TEE values estimated by ActigraphGT3x during daily life activity in stroke populations. 12 The aforementioned study had reported a mean difference of 1.5 ± 1.5kcalmin−1 between the TEE obtained from ActigraphGT3x and from Metamax3B. From the prediction of an average difference of 1.5 kcalmin−1, a SD of 1.5 kcalmin−1, a test power of 80% and alpha-risk of .05, we calculated a required sample size of 20 subjects. We have integrated a risk of data loss related to possible malfunctioning devices. We estimated this risk at about 10%–15% by type of device, which implies a number of participants of 24–26 individuals. The threshold of statistical significance was .05. All calculations were performed using SPSS Statistics® version 23, 2015.
Results
Characteristics of the population.
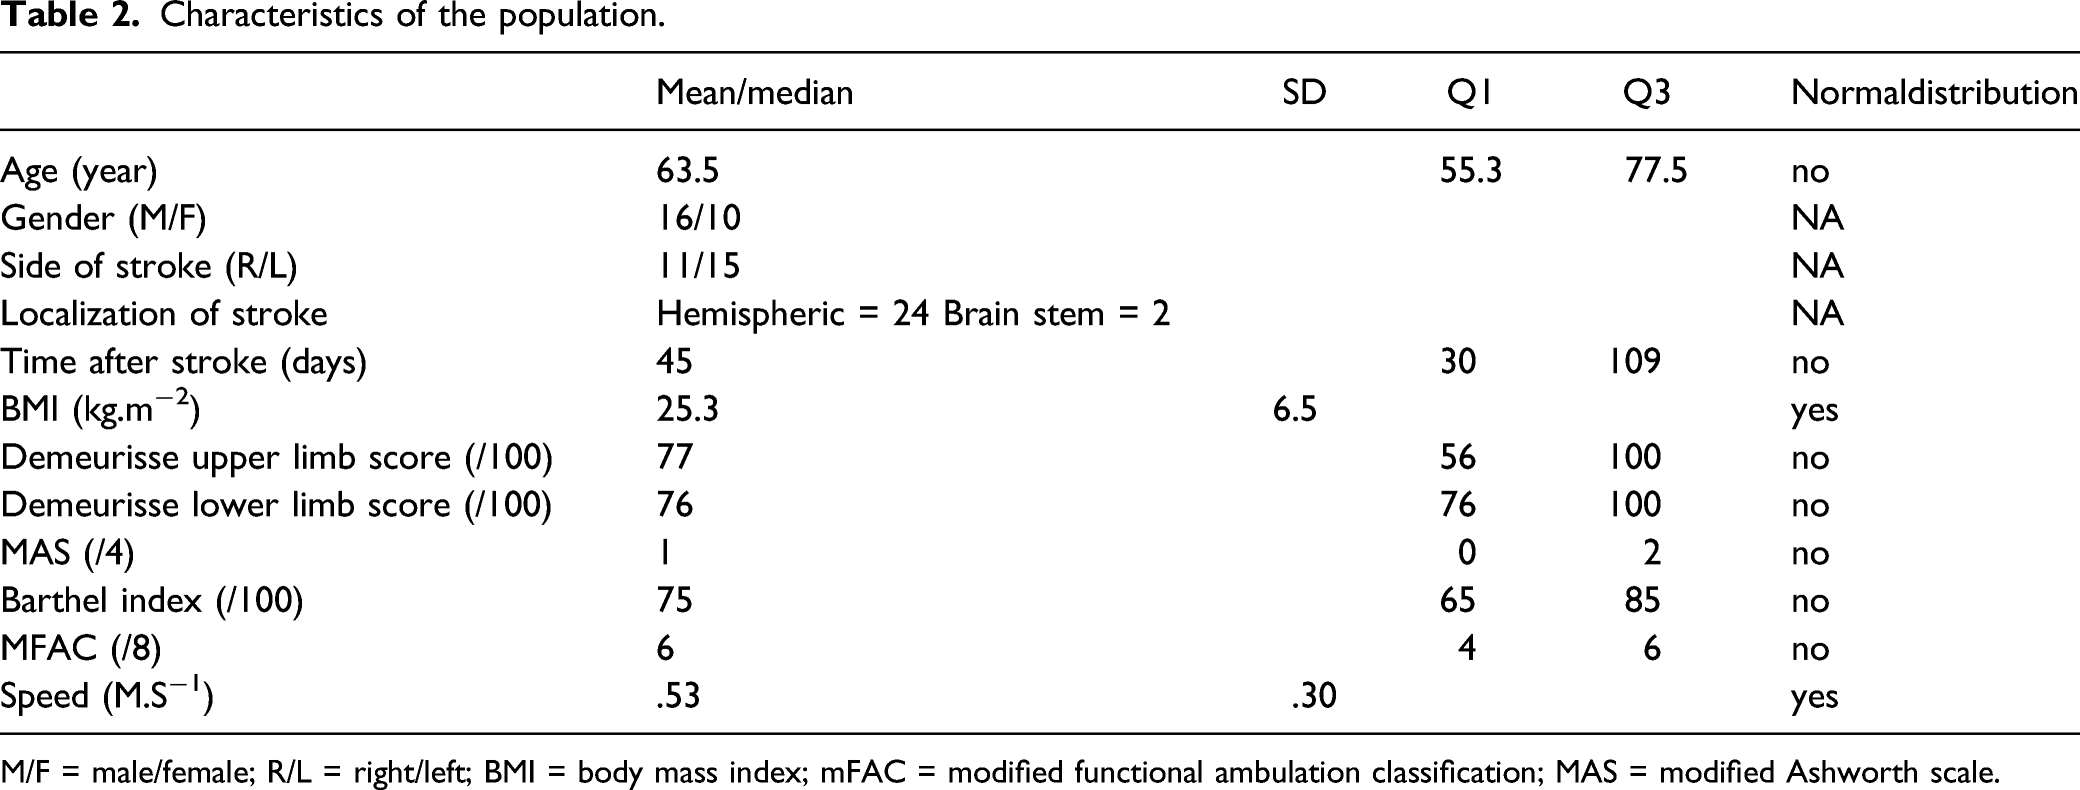
M/F = male/female; R/L = right/left; BMI = body mass index; mFAC = modified functional ambulation classification; MAS = modified Ashworth scale.
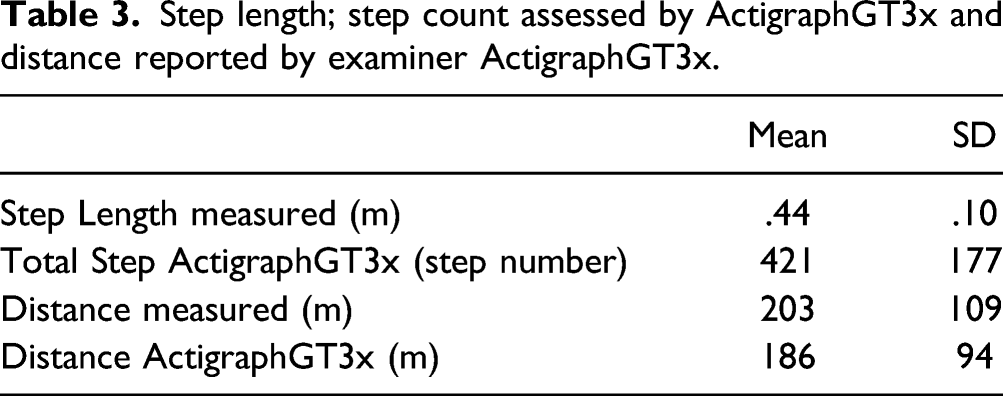
Step length; step count assessed by ActigraphGT3x and distance reported by examiner ActigraphGT3x.
The average TEE value measured by Metamax3B was 26.2 ± 5.9 kcal. The validity parameters with Metamax3B values varied depending on the prediction equations.
The Compagnat et al. and Polese et al. equations had better validity parameters with the Metamax3B values, respectively, MBCompagnat = 1.2 kcal, 95% LoACompagnat = [−12.0; 14.3] and MBPolese = 3.5 kcal, 95% LoAPolese = [−9.2; 16.1] (see Figure 1; Table 4). Bland–Altman plots reporting Bland–Altman’s analysis between the total energy expenditure values measured by the Metamax3B and those estimated by the different prediction equations validity parameters of total energy expenditure values calculated from the product of the distance reported by ActigraphGT3x and oxygen cost of walking estimates from the different prediction equations. Normal distribution: results of Shapiro–Wilk test; Metamax3B: total energy expenditure measured by Metamax3B; P-value t-test: P value of the t-test performed between Metamax3B values and the different calculation methods; B-A MB: mean bias of Bland–Altman analysis; B-A LoA low and up: limits of agreement of Bland–Altman analysis.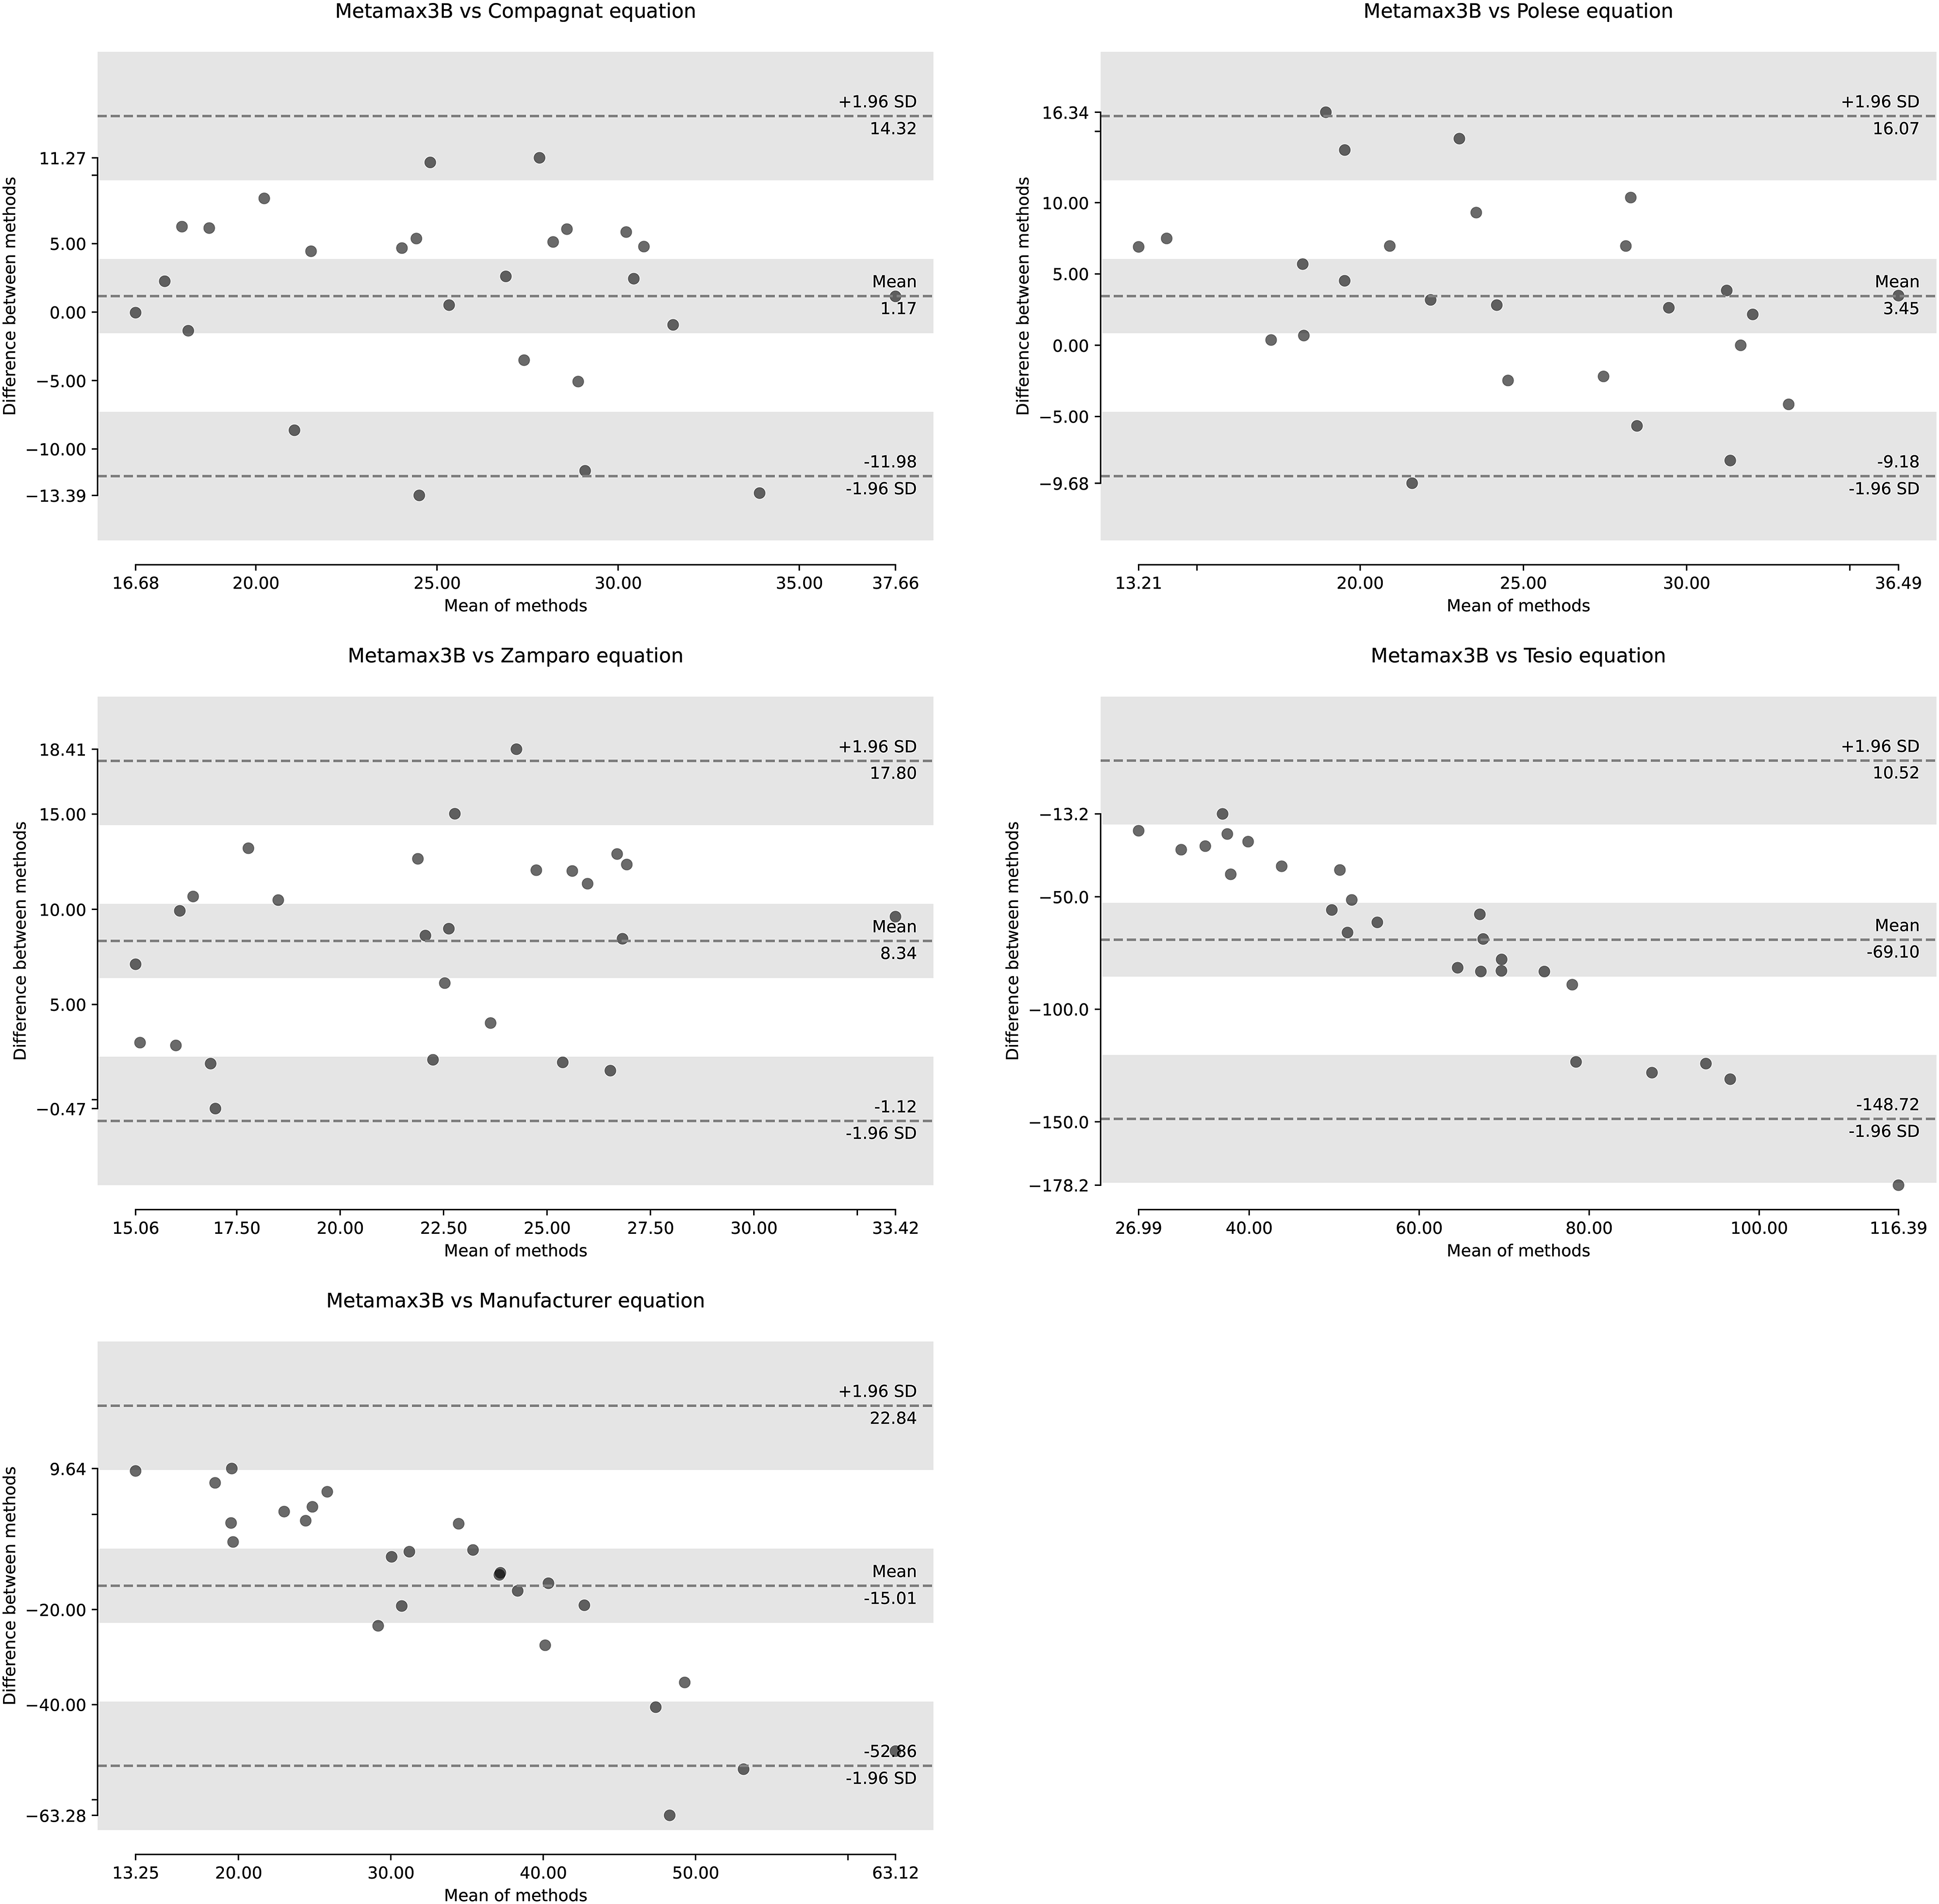
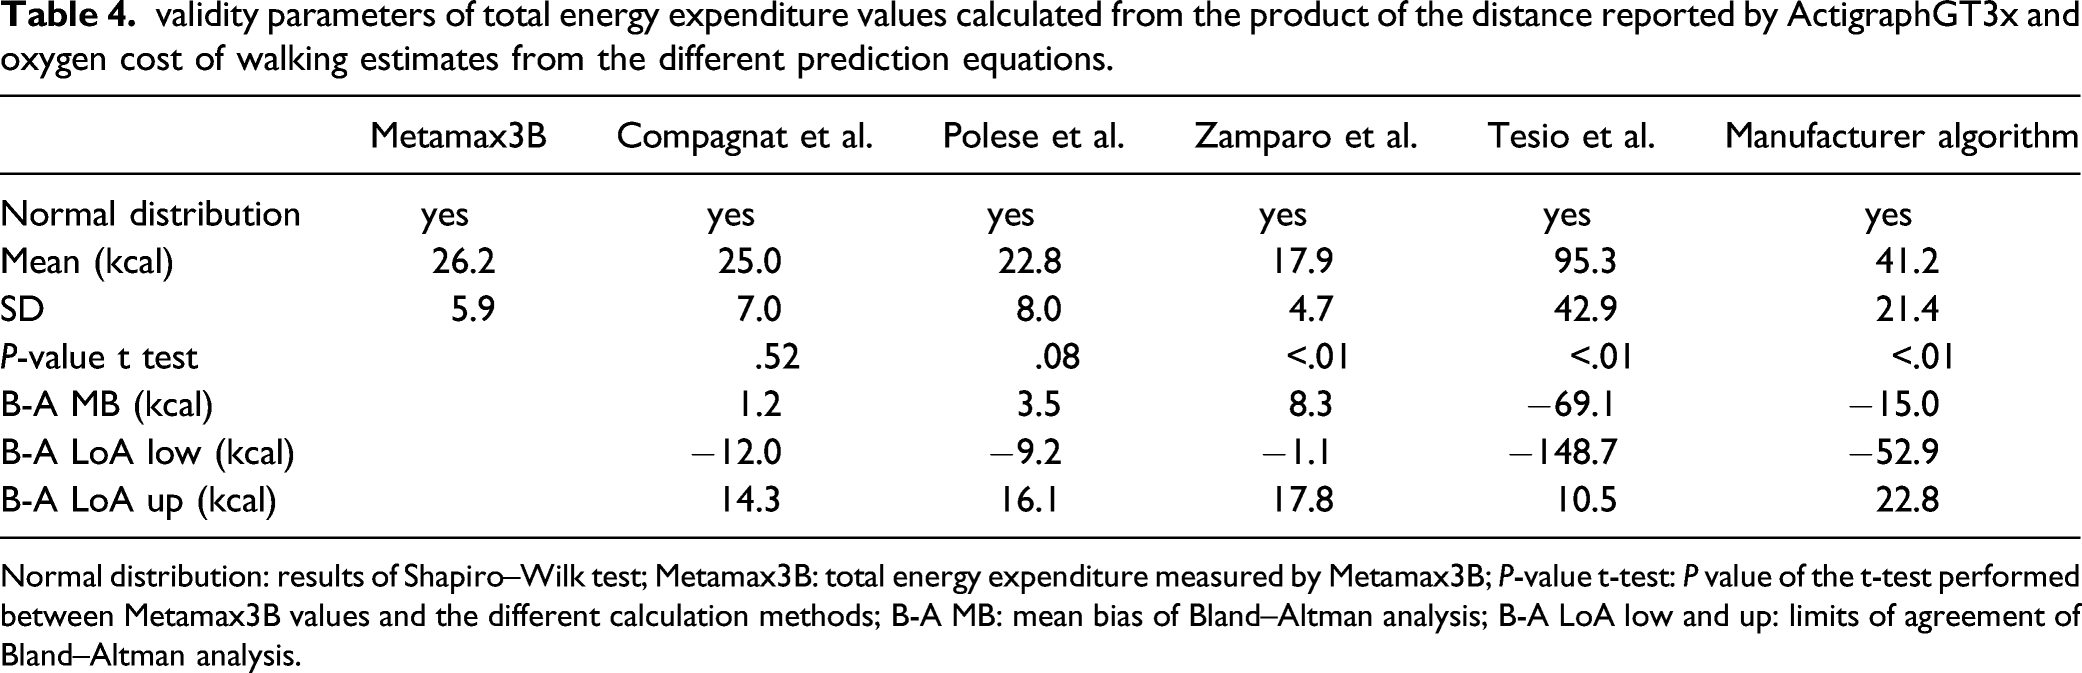
The equations of Compagnat et al. and Polese et al. were the only ones to report no significant difference with Metamax3B values (meanCompagnat = 25.0 ± 7.0 kcal, p-valueCompagnat = .52; meanPolese = 22.8 ± 8.0 kcal, p-valuePolese = .08).
The Zamparo et al. and Tesio et al. equations had low validity parameters and reported a significant difference with Metamax3B values (see Figure 1; Table 4).
Discussion
In this work, we showed that the prediction equation of Compagnat et al. and Polese et al. were the most consistent with the TEE values obtained using Metamax3B. Concerning the TEE values delivered by the manufacturers’ algorithm and other prediction equations, they were significantly different from those of the Metamax3B with low levels of agreement and accuracy.
The differences in TEE estimates can be explained by the method for developing the oxygen cost prediction equations. In the selected equations, the Compagnat et al. equation was the one with the highest level of validation. Indeed, this prediction equation comes from a population of 26 post-stroke hemiparetic individuals. In addition, this equation was controlled on a second population of 29 individuals. 15 The number of subjects tested is therefore 55, and it is the only study that reports a control of the equation on a second population. In the Polese et al. study, the authors constructed their prediction equation on a population of 55 individuals, which may contribute to the fact that it also performs very well for TEE estimation. However, the Polese et al. participants had an average Sfree equivalent to that of healthy subjects (1.2 ms−1), that is, 2 times that of our population. It is possible that the lower performance of this equation is due to the fact that the Polese et al. population is very different from the one included in our study. We believe that the criterion population are fundamental when developing this type of equation because it is constructed from a mathematical regression that produces a trend curve between the walking speed and the Cw. 21 If this validation population is not close to the target population, this may lead to a risk of estimation error because the regression equation will not fit the target population. A recent study reinforces this idea by reporting that the Cw/Sfree relationship is different in an individual with spastic hemiparesis and in an individual with post-stroke cerebellar ataxia. 23 In this work, for an equivalent walking speed, individuals with cerebellar ataxia following a stroke had a Cw 30% higher than hemiparetic individuals. Thus, if we apply the equation of hemiparetic individuals to ataxic individuals, they are exposed to an underestimation of about 30% per metre travelled. It therefore seems necessary to know the clinical characteristics of the individuals in the population from which the equation is derived to be sure it corresponds to the population from which we will evaluate this new calculation method. In the work of Compagnat et al., the authors chose to include only individuals with hemispheric stroke. This choice was made to homogenize the walking characteristics of individuals. For the other studies, the authors do not clearly specify the stroke locations. 15
Another explanation for the variations found between the different equations may lie in the type of equation. Indeed, the prediction equations found in the literature are of 2 types: power15,20 and polynomial.19,21 Unfortunately, this choice is not described in the studies. The choice of polynomial type found in the studies of Polese et al. and Tesio et al. can be discussed because it is known that human walking has a U-shaped relationship between walking speed and Cw. Thus, the more the Sfree is low, the higher the Cw will be, which produces a form of asymptote for the lowest Sfree values. In this context, we think that the polynomial equations do not consider this phenomenon and do not seem suitable for patients with very low walking speeds (additional Figure 1).
Practical Implications
This work has strong clinical implications. Indeed, a recent study by Compagnat et al. 16 showed that the integration of Cw significantly improved TEE estimates during walking in stroke patients. However, the strong limitation of this work was that the authors had only used a Cw value measured using Metamax3B. Our work reported the validity parameters of the different Cw prediction equations when used on physical activity monitors. It confirmed that the integration of Cw is highly beneficial for calculating TEE using an accelerometer even if the Cw was estimated by a prediction equation. It thus provides an easy way to calibrate the TEE calculation algorithm for an accelerometer for stroke patients with the confidence that the chosen accelerometer is reliable for measuring walking distance in individuals with stroke sequelae. This method seems easily achievable in practice or clinical research. In addition, it can be expected that this result would help in designing an accelerometer for stroke patients, integrating Cw and step length in the device software.
Limitations
This work had several limitations. First is the generalization of the results. It seemed difficult to propose a prediction equation for all stroke individuals because the sample size of each study was low. It is probably the main cause of the observed differences between the equations. Thus, the choice of the prediction equation is decisive. This implies knowing the population studied well before choosing the equation to ensure the reference population of the equation is as close as possible to the destination population. Although our population is relatively specific (Demeurisse lower limb score = 76, IQR (76–100); Barthel index = 75, IQR (65–85); Sfree = .53 ± .30 m.s−1), it seems representative of stroke individuals for whom it is legitimate to propose monitoring of the EE during walking. In addition, for these individuals, it would be very relevant to better define the recommendations for walking activities and to provide them with feedback on their participation in walking activities, especially at home. Another limitation to the generalization of our results concerns the sensor choice. We chose the ActigraphGT3x because it is the most widely used tri-axial accelerometer in clinical research and has shown a very good level of accuracy in estimating the walking distance of individuals with stroke. 18 It is possible that another accelerometer would present different results with the prediction equations of Compagnat and Polese. It seems essential to know the accelerometer’s level of validity for estimating walking distance in stroke individuals before using this new method of calculating TEE. Finally, the walking activity of our study was indoors, which can restrict generalization of results. Indeed, the final goal of these sensors is to measure walking activity regardless of the stroke patient’s environment. 2 However, we know that walking outdoors can vary the spatio-temporal parameters of walking which can increase error in estimating the TEE using this method. 12 Further work will therefore be required to evaluate these methods in an ecological situation.
Conclusion
This work showed that using a Cw prediction method coupled with a walking distance estimated using the ActigraphGT3x worn on the ankle provided a valid TEE estimate. The level of validity varied according to the Cw prediction equation. The equations of Compagnat et al. and Polese et al. were the most consistent with the TEE values provided by Metamax3B. Integrating this calculation method seems to be a promising way to accurately and objectively quantify the walking activity of stroke individuals.
Footnotes
Acknowledgements
We thank all our patients and the University Hospital Center of Limoges for supporting our research.
Declaration of conflicting interests
The author(s) declared no potential conflicts of interest with respect to the research, authorship, and/or publication of this article.
Funding
This work was supported by the region of Nouvelle-Aquitaine and the HAVAE (Handicap, Aging, Autonomy and Environment) laboratory of clinical research.