
Abstract
Background:
It is important to predict poststroke cognitive outcome to guide individualized treatment and prevention strategy. We aimed to evaluate the predictive value of the combination of a serum biomarker for axonal damage (neurofilament light chain [NfL]) and neuroimaging markers (volume of infarction and white matter hyperintensities [WMH]) for neuronal abnormality in poststroke cognitive outcome.
Methods:
A total of 1028 patients were screened; among them, 144 patients with acute ischemic stroke (stroke group) and 30 patients without stroke (control group) were enrolled. Serum NfL levels of samples obtained from both groups were measured through single molecule array assay. Neuroimaging markers of neuroaxonal injury, including infarct volume and WMH in the stroke group were quantified on magnetic resonance images using an in-house MATLAB code (MATLAB 2017; MathWorks). The primary outcome was the functional independence measure (FIM) cognitive subscores on discharge. We assessed the association of serum NfL levels and neuroimaging markers with cognitive outcome. The prognosis value of the combination of serum NfL levels and imaging markers for predicting FIM cognitive subscores on discharge was calculated using the area under curve (AUC) of the receiver operating characteristic.
Results:
Serum NfL levels of the stroke group were 9-fold higher than those of the control group (1449.7 vs 157.2 pg/mL, n = 144/30, P < .001). There was a correlation of serum NfL levels with infarct volume (r = 0.530, P < .001) and functional outcome, including FIM cognitive subscores (r = −0.387, P < .001) and FIM motor subscores on admission (r = −0.306, P < .001), but not with WMH volume after adjusting for infarct volume (r = −0.196, P = .245). Serum NfL levels on admission independently predicted poststroke FIM cognitive subscores on discharge (AUC = 0.672, P < .001). The predictive value for poststroke cognitive outcome was improved by combining serum NfL levels with infarct and WMH volume (AUC = 0.760, P < .001).
Conclusion:
The combination of serum NfL levels with volume of infarct and WMH shows an improved predictive value for cognitive function during acute rehabilitation phase after stroke, providing a promising panel of biomarkers for prognosis and guidance of treatment.
Keywords
Introduction
Poststroke cognitive impairment (PSCI) is the most common complication of ischemic stroke. 1 About 75% of stroke survivors have cognitive impairment in the first poststroke week. 1 To determine the effective biomarkers that sought to improve the prognosis of PSCI is imperative for guiding the customized treatment plan. 2 However, determining the prognostic biomarkers of PSCI is challenging due to the numerous factors affecting cognitive outcome. 2 Therefore, research on operative biomarkers for cognitive outcome poststroke is of great significance. 3
Several magnetic resonance imaging (MRI) markers have been investigated, including infarct volume, 4 lacunes, 5 white matter hyperintensities (WMH), 6 and microbleeds, 7 to predict the PSCI outcome. Among them, the correlation of infarct volume with poststroke cognitive outcome remains controversial. 8 Recently, the role of WMH in poststroke cognitive decline, specifically, in the attention, executive function, and process speed domains, has become increasingly clear. 7 WMH volume is used to modulate the relationship between infarct volume and cognitive outcome. 8 However, volume measures on structural MRI only have weak predictive value on PSCI outcome in clinical practice.7,8 Alternative biomarkers that complement volume measures could help clinicians predict and assess poststroke treatment response.
Easily obtainable serum biomarkers are supplemental to MRI markers. Neurofilament light chain (NfL) is a promising serum biomarker that is exclusively expressed in neurons.9-11 After nerve axon damage, the NfL protein is released into the cerebrospinal fluid and peripheral blood. Serum NfL levels have predictive value in neurologic outcome of neurodegenerative diseases, including Alzheimer disease and frontotemporal dementia.10,12,13 Interestingly, several studies have reported a moderate predictive value of serum NfL levels for neurological impairment after ischemic stroke.14,15 Therefore, serum NfL levels are likely to serve as a biological biomarker to predict poststroke cognitive function, which can be expected to provide more robust prediction by the combination with imaging predictors.
Herein, in consideration that serum NfL levels could predict poststroke cognitive outcome and the combination of serum NfL levels with MRI markers could improve the predictive value, we propose a biomarker panel including a biological biomarker (serum NfL levels) for axonal damage and neuroimaging markers (volume of infarct and WMH) for neuronal abnormality in poststroke cognitive outcome. We aimed to focus on (1) the association between serum NfL levels and poststroke cognitive function during acute rehabilitation phase and (2) the predicted value of the biomarker panel of a combination of MRI markers (volume of infarct and WMH) with serum NfL levels.
Methods
Study Population
This study was approved by the institutional review board. A total of 1028 patients with ischemic stroke admitted to Spaulding Rehabilitation Hospital (SRH) for inpatient rehabilitation between March 2015 and September 2019 were screened. The inclusion criteria were as follows: (1) age >18 years old; (2) first time clinically significant ischemic stroke; (3) brain MRI scan performed in Massachusetts General Hospital (MGH) or Brigham Women’s Hospital (BWH) within 1 poststroke month; (4) no previous history of neuropsychiatric diseases, including epilepsy, cerebral vascular abnormalities (arteriovenous malformations or aneurysm), or brain trauma; (5) serum sample collected and stored on admission; and (6) length of staying for inpatient rehabilitation >7 days. Based on these inclusion criteria, 144 participants were enrolled and included in the stroke group. Besides, 30 age-matched stroke-free patients admitted to SRH without neurologic diseases were included as controls. Figure 1 shows the flow chat of the study.
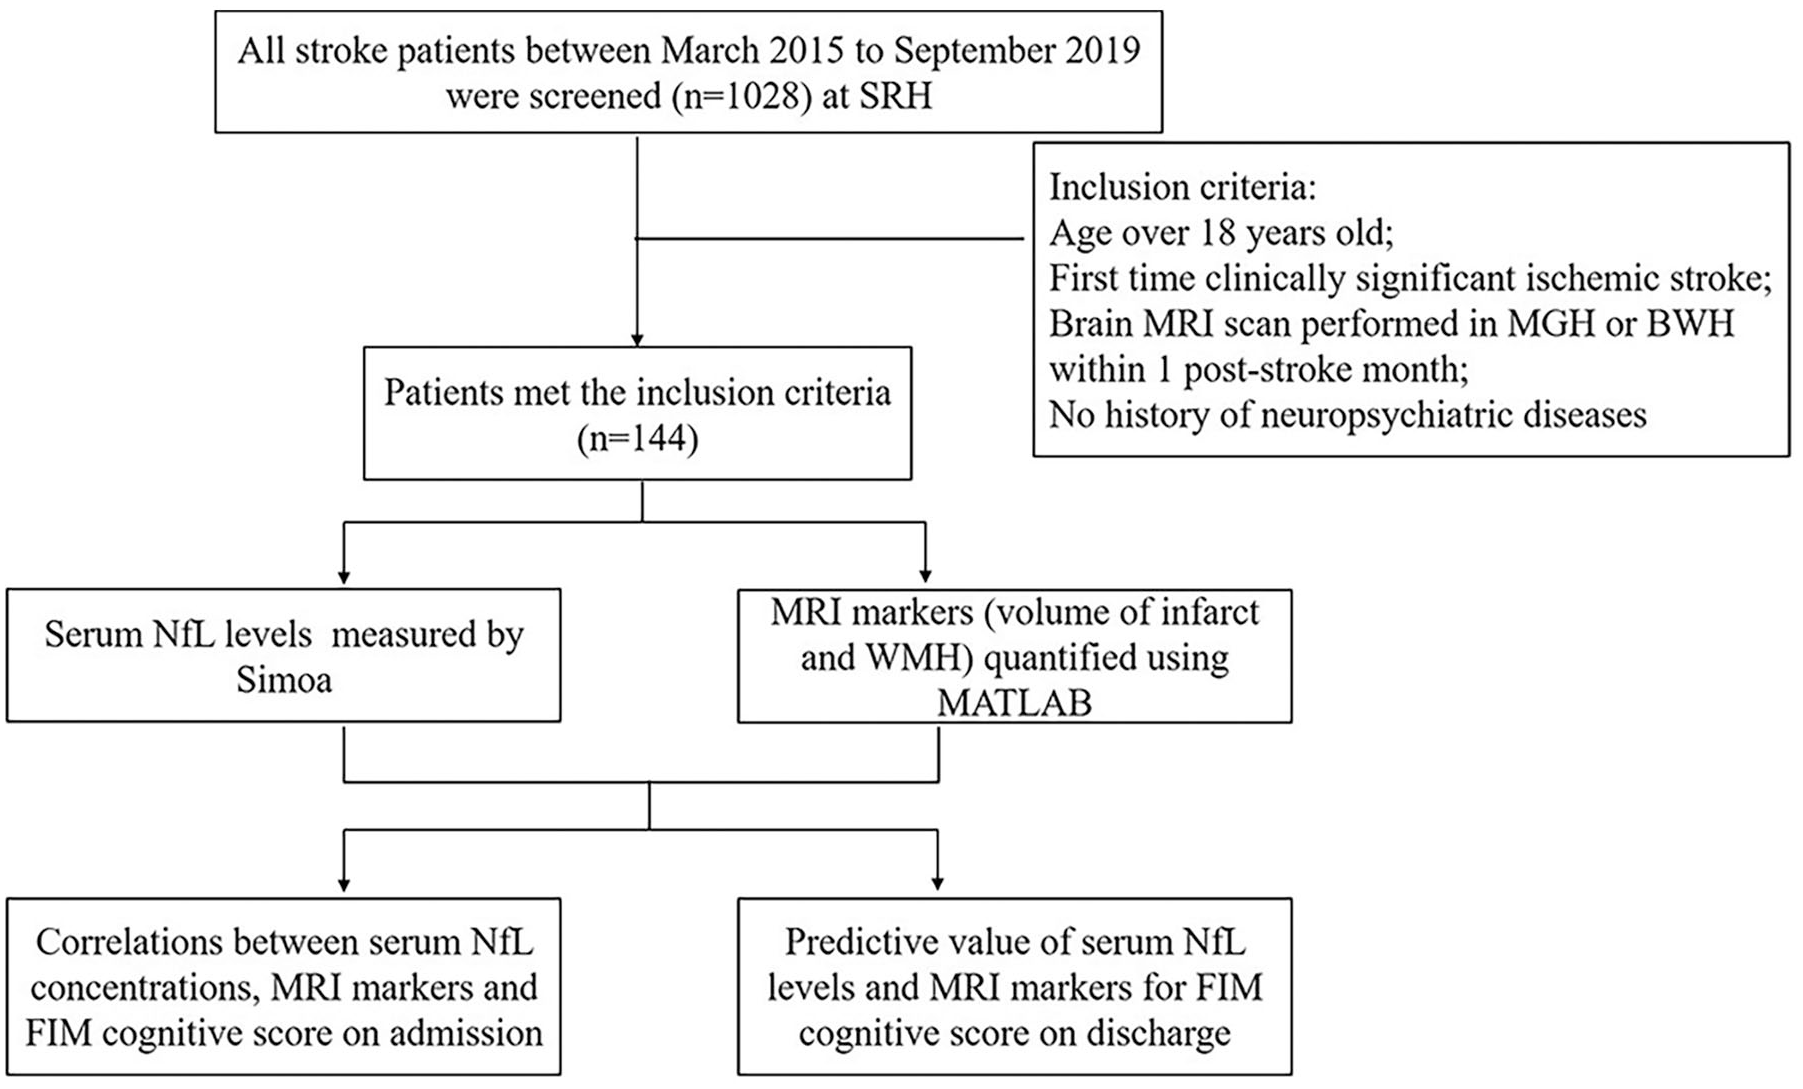
Flowchart illustrating the process for the study. Abbreviations: SRH, Spaulding Rehabilitation Hospital; MGH, Massachusetts General Hospital; BWH, Brigham Women’s Hospital; MRI, magnetic resonance imaging; NfL, neurofilament light chain; FIM, Functional Independence Measure.
Clinical Outcome Variables
The FIM cognitive subscores on discharge were used as the primary endpoint for functional outcome as previously described.16,17 The participants in the stroke group were stratified into 2 groups based on low or high median FIM cognitive subscores on admission. The secondary outcomes included the FIM total scores on discharge, FIM cognitive subscores on admission, length of hospital stay, and discharge destination. The FIM scale includes 13 motor and 5 cognitive items, respectively. Each item is scored on a 7-point ordinal scale. Score 1 represents the most serious level with complete dependence on others to finish tasks, while score 7 represents full independence. The cognitive, motor, and total FIM scores range from 5 to 35, 13 to 91, and 18 to 126, respectively, and were assessed by a trained therapist, as well as the nurse on admission and discharge, as part of the standard inpatient rehabilitative treatment in SRH. The standard stroke rehabilitative program involves 3 hours of daily physical therapy, occupational therapy, and speech therapy.
Demographic characteristics, including age, gender, marital status, body mass index, the receipt of intravenous tissue plasminogen activator (tPA), length of hospital stay, and discharge destination, were extracted from electronic medical records system. Moreover, stroke features, including stroke risk factors, stroke site, stroke side and initial (on presentation to emergency room) National Institutes of Health Stroke Scale (NIHSS) score were collected from medical records. The estimation of modified Rankin Scale (mRS) score was translated by FIM motor subscore and the optimal set of cutoffs was as follows: 13 ≤ MRS5 < 26, 26 ≤ MRS4 < 62, and 62 ≤ MRS (0, 1, 2, 3) ≤ 91 according to reference. 18
Serum NfL Levels Measurement
Serum NfL levels of all patients in the stroke group and control group were measured within 1 week after admission using a single-molecule array assay (Simoa) NfL kit (Catalog # 103400, Lot # 502045) on the Quanterix SR-X instrument under the manufacturer’s instructions. In addition, 55 patients in the stroke group had second serum NfL levels measured within 3 weeks after admission. Serum samples were centrifuged at 10 000 g for 5 minutes and diluted 1:4 in sample buffer. Sample levels exceeding the assay detection limit were re-assayed at a 1:8 dilution. Plate data were normalized using 4 plate-to-plate controls (2 recombinant protein controls included in the kit and 2 endogenous serum controls). Data on each plate were adjusted according to the ratio of the mean control values of each plate and those across all plates. Samples showing intraassay coefficients of variations >20% were remeasured.
MRI Data Preprocessing
All MRI data were downloaded on mi2b2 Workbench (a software for Research Patient Data Registry in Partners HealthCare) as previously described.16,19 MRI scans were obtained on 3T Siemens Magnetom Tim Trio scanner with a 12-channel head coil. The fluid-attenuated inversion recovery (FLAIR) sequence was used to calculate the infarct and WMH volume.20,21 The MRI acquisition parameters for FLAIR were as follows: repetition time = 5000 ms, echo time = 96 ms, inversion time = 2200 ms, flip angle = 90°, field of view = 220, matrix dimension size = 160 × 256, and slice thickness = 5 or 4 mm. Among all 144 stroke patients included, 133 patients underwent FLAIR with a slice thickness of 5 mm and 11 patients underwent FLAIR with a slice thickness of 4 mm.
Infarct and WMH Volume Calculation
Regions-of-interest (ROIs), including infarcts and WMH, were semi-automated segmented on baseline FLAIR images of each patient using open source software 3D-Slicer (Version 4.10.1, https://www.slicer.org/), and then validated slice-by-slice by a physician (the first author Yuan Peng in the study) blinded to patients’ information. 22 Volume of interest (VOI) were generated by combining all ROIs, and the volume of each VOI was calculated, using an in-house MATLAB code (MATLAB 2017a MathWorks).
Statistical Analysis
Statistical analyses were performed using SPSS 24.0 (International Business Machines Corp) and all graphs were made using GraphPad Prism version 7.0.
First, Kolmogorov-Smirnov tests were used to analyze the distribution type of the continuous variables. Skewed distributed variables including serum NfL levels, infarct volume, and WMH volume were log-transformed to achieve normal distribution. To compare the clinical variables between the low and high FIM cognitive scores on admission, we used Student’s t test on continuous data and χ2 test for categorical data, respectively. Student’s t test was used for between-groups comparisons of log-transformed serum NfL levels (hereafter referred to as log(NfL)). Paired t tests were used to compare the log(NfL) between 2 different time points (week 1 and week 3).
Subsequently, Spearman’s correlation was used to study the relationship of FIM cognitive scores on discharge with translated mRS score, log(NfL) on admission, log-transformed infarct volume, and log-transformed WMH volume, respectively. Partial correlation was used to determine the relationship between serum NfL levels on admission and infarct volume with adjustment for age, as well as between serum NfL levels on admission and WMH volume with adjustment for age and infarct volume. Furthermore, we assessed the Spearman’s correlation between MRI markers (volume of infarct and WMH) and FIM cognitive scores on discharge.
Finally, we applied multivariable linear regression analysis to identify the factors affecting the cognitive outcome after the acute rehabilitation course. Furthermore, we calculated the sensitivity and specificity of log(NfL) on admission combined with MRI markers (volume of infarct and WMH) to predict cognitive outcome on discharge using receiver operating characteristic (ROC) analysis.
Results
Study Population Demographics
The baseline characteristics of both the low and high FIM cognitive groups in stroke group are presented in Table 1. The discharge destination has significant difference between them (P < .05), namely, 45.8% of patients in the low FIM cognitive group were discharged to a skilled nursing facility while 73.6% of patients in the high FIM cognitive group were discharged to home. The available baseline NIHSS score, translated mRS score, serum NfL levels, and infarct volume were also significantly different between both groups (P ≤ .001). There were no significant differences in other terms of other demographic characteristics between the 2 groups, such as the receipt of intravenous tPA, risk factors, stroke site, and stroke side. The baseline characteristics of the control group including age, gender, and body mass index have no significant differences with those of the stroke group (Supplemental Table 1).
Characteristics of the Patients in the Study Groups a .
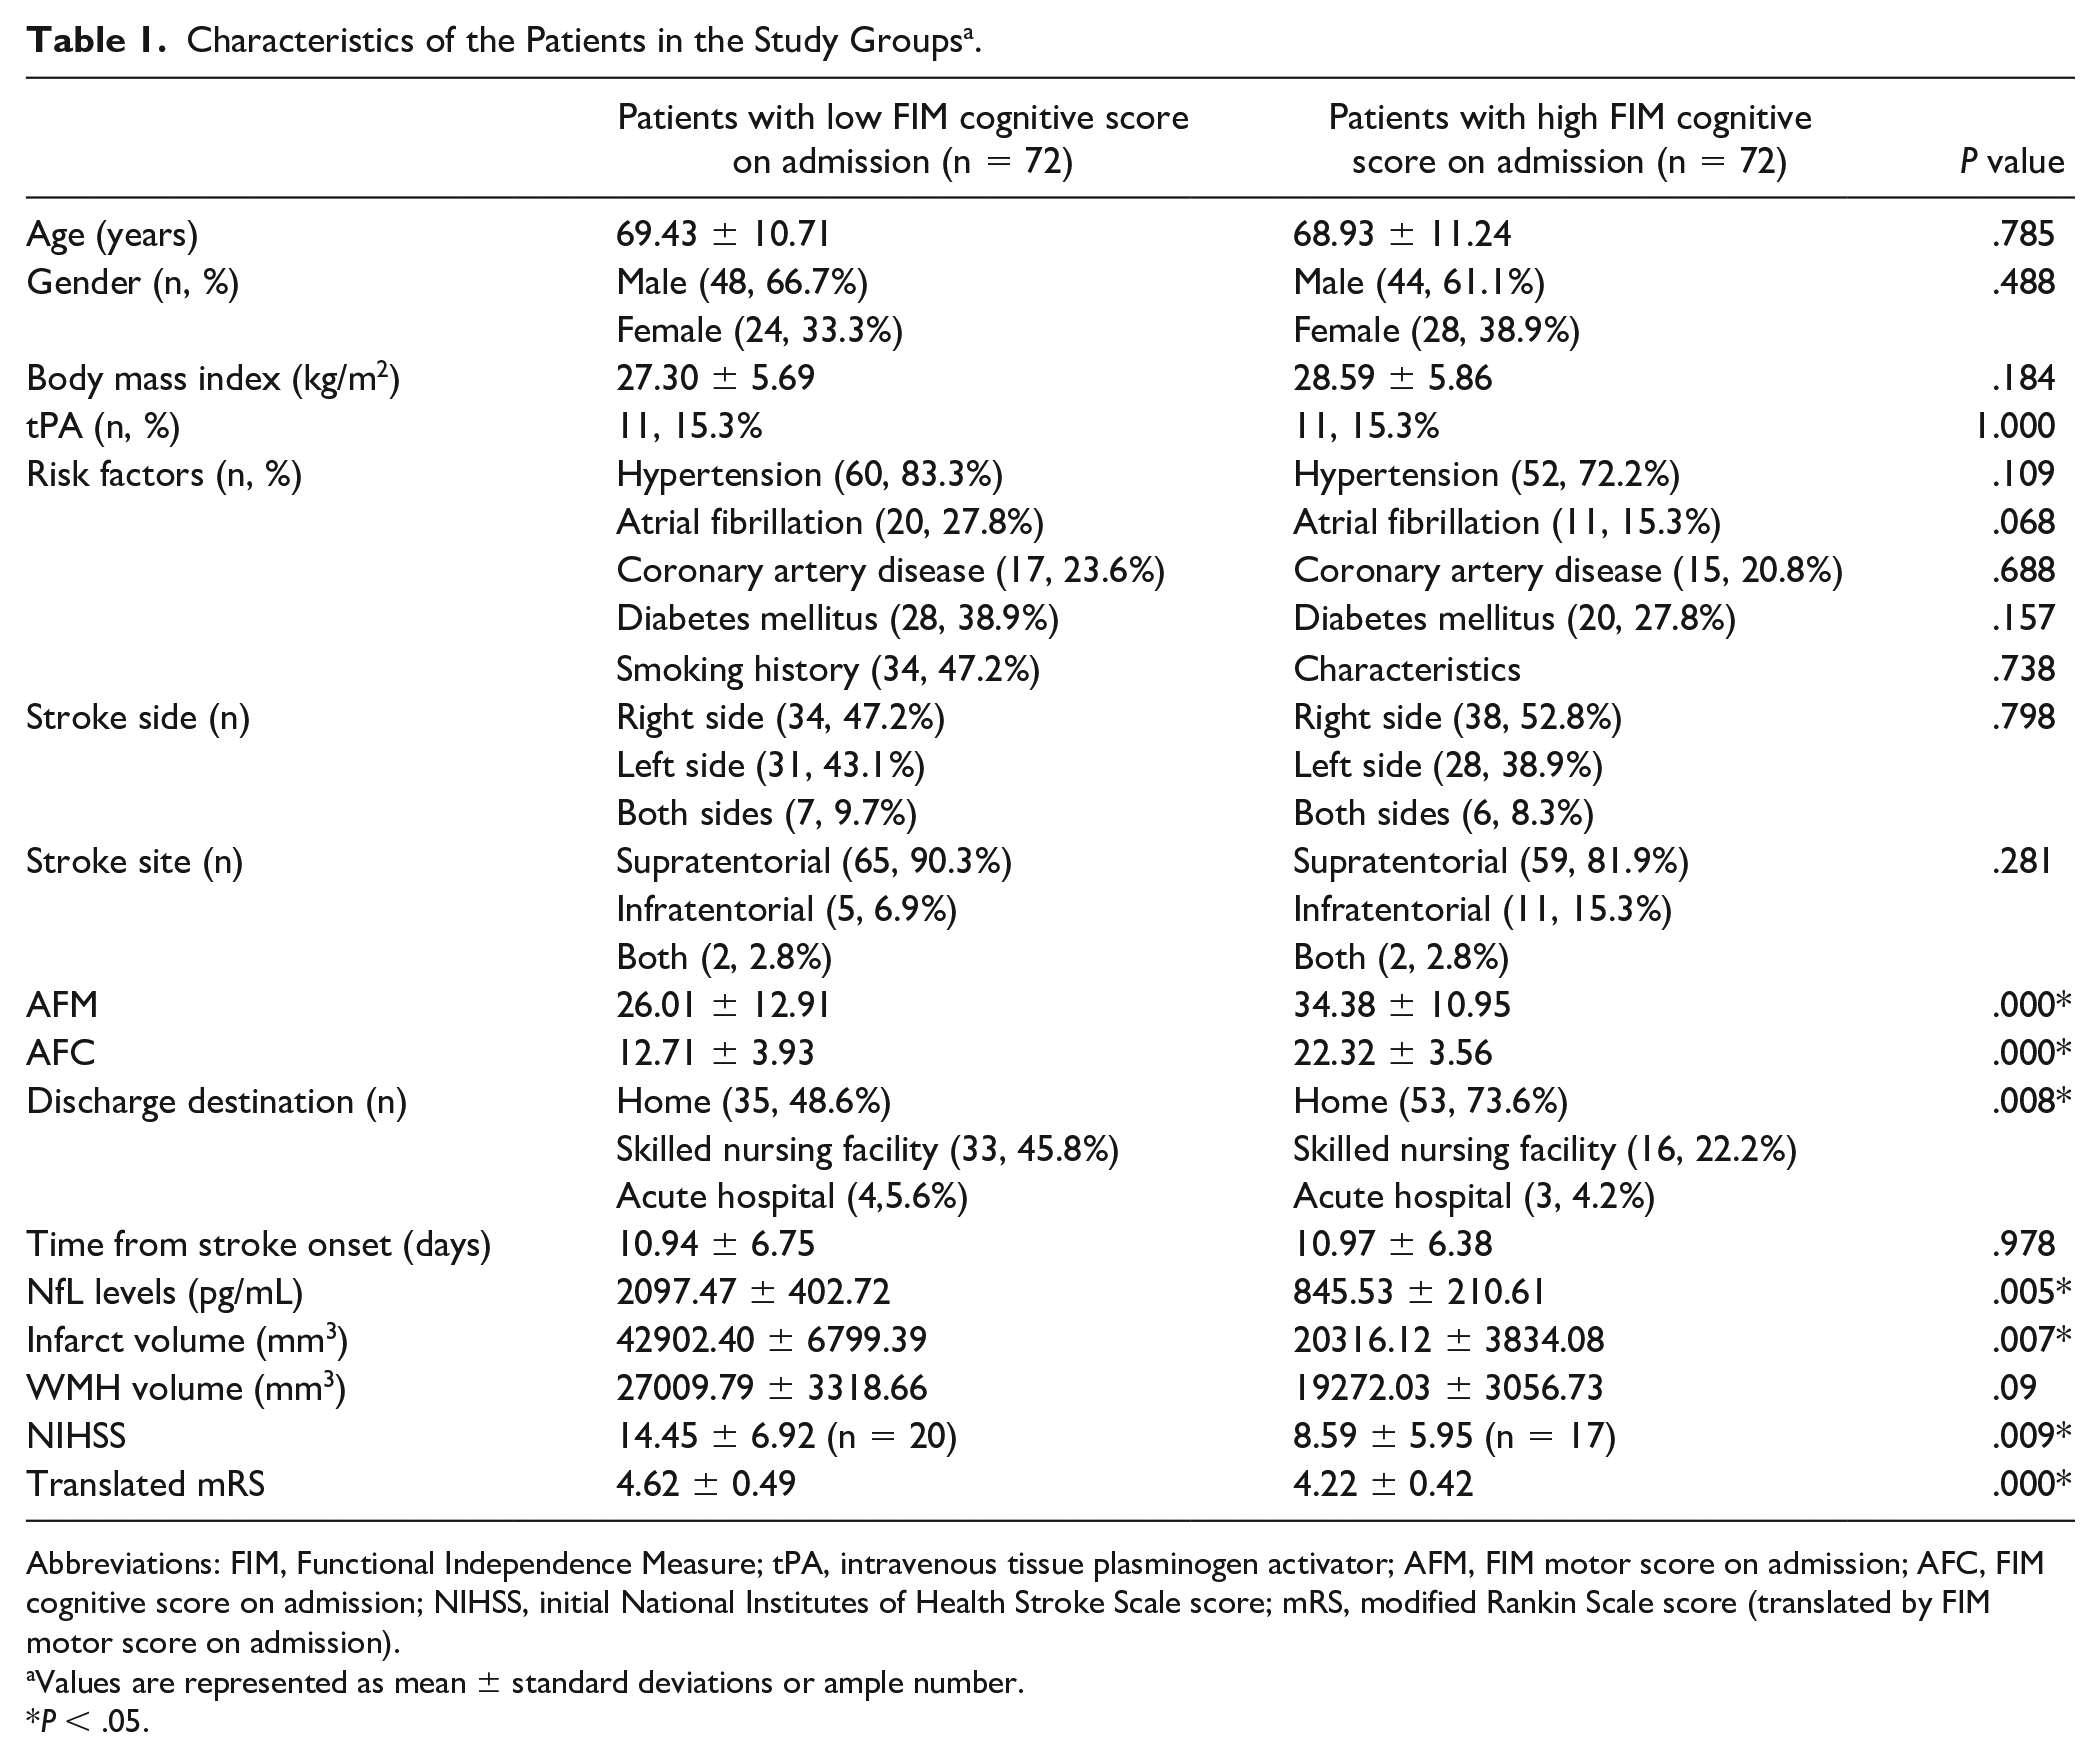
Abbreviations: FIM, Functional Independence Measure; tPA, intravenous tissue plasminogen activator; AFM, FIM motor score on admission; AFC, FIM cognitive score on admission; NIHSS, initial National Institutes of Health Stroke Scale score; mRS, modified Rankin Scale score (translated by FIM motor score on admission).
Values are represented as mean ± standard deviations or ample number.
P < .05.
Stability of Serum NfL Levels During the Subacute Stroke Phase
The average time interval between serum collection and stroke onset was 11.0 ± 6.6 days. The serum NfL levels in the stroke group were 9-fold higher than those in the control group (1449.7 pg/mL vs 157.2 pg/mL, P < .001; Figure 2A). However, there was no significant difference between the serum NfL levels measured on week 1 and week 3 (1797.8 pg/mL vs 1202.4 pg/mL, n = 55, P = .278; Figure 2B).
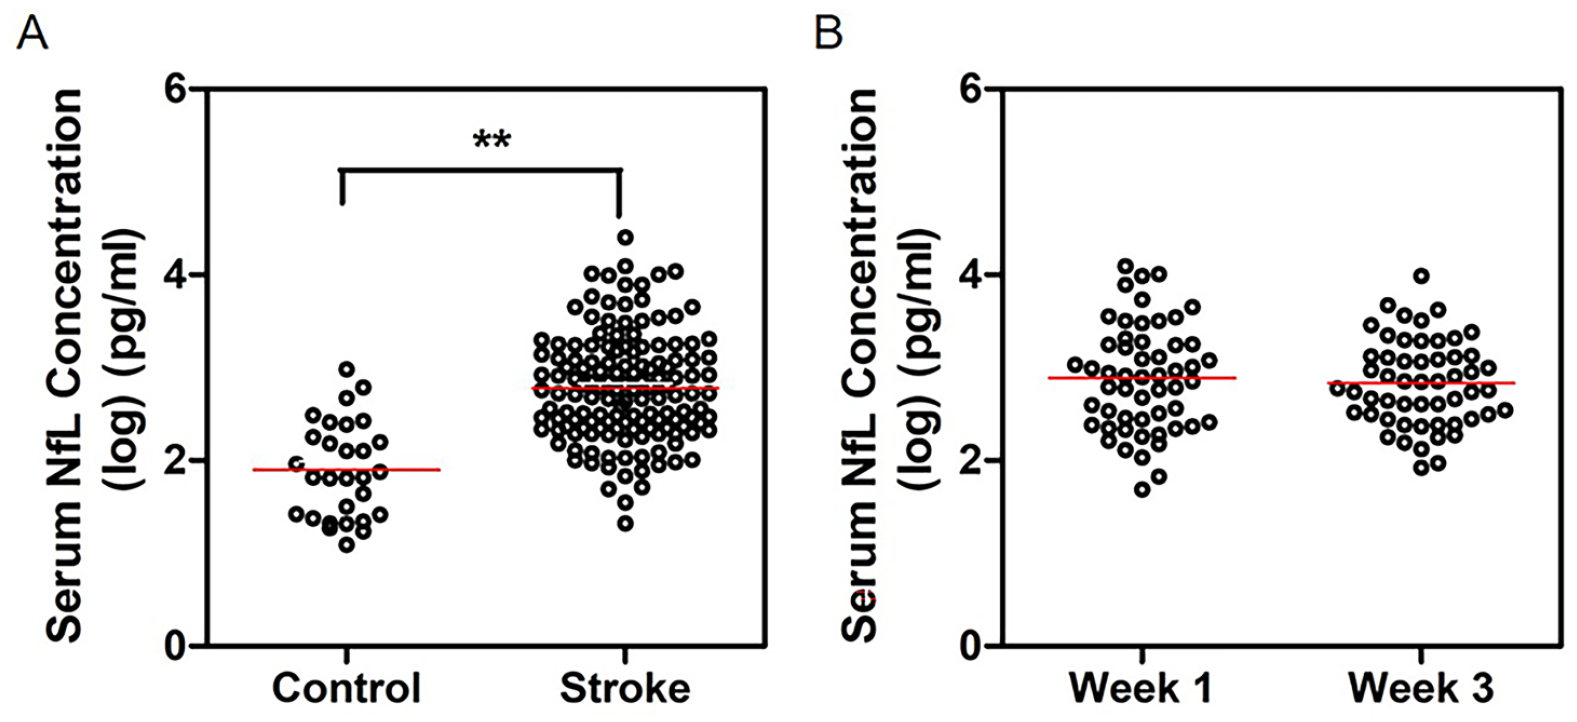
Comparison of serum NfL (neurofilament light chain) levels (A) in stroke patients with controls and (B) on different time points (week 1 and week 3) of stroke patients. The serum NFL levels in ischemic stroke group was statistically higher than that in the control group (**P < .001).
Serum NfL Levels Are Associated With Infarct Volume and Cognitive Function
Since there was no significant difference in the serum NfL levels measured at the 2 time points, we used log(NfL) at week 1 as the standard serum NfL levels for the subsequent analyses. We investigated the correlation of serum NfL levels with MRI markers (volume of infarct and WMH). There was a moderate correlation of serum NfL levels with infarct volume (r = 0.460, P < .001; Figure 3A) but not with WMH volume (r = −0.196, P = .245).
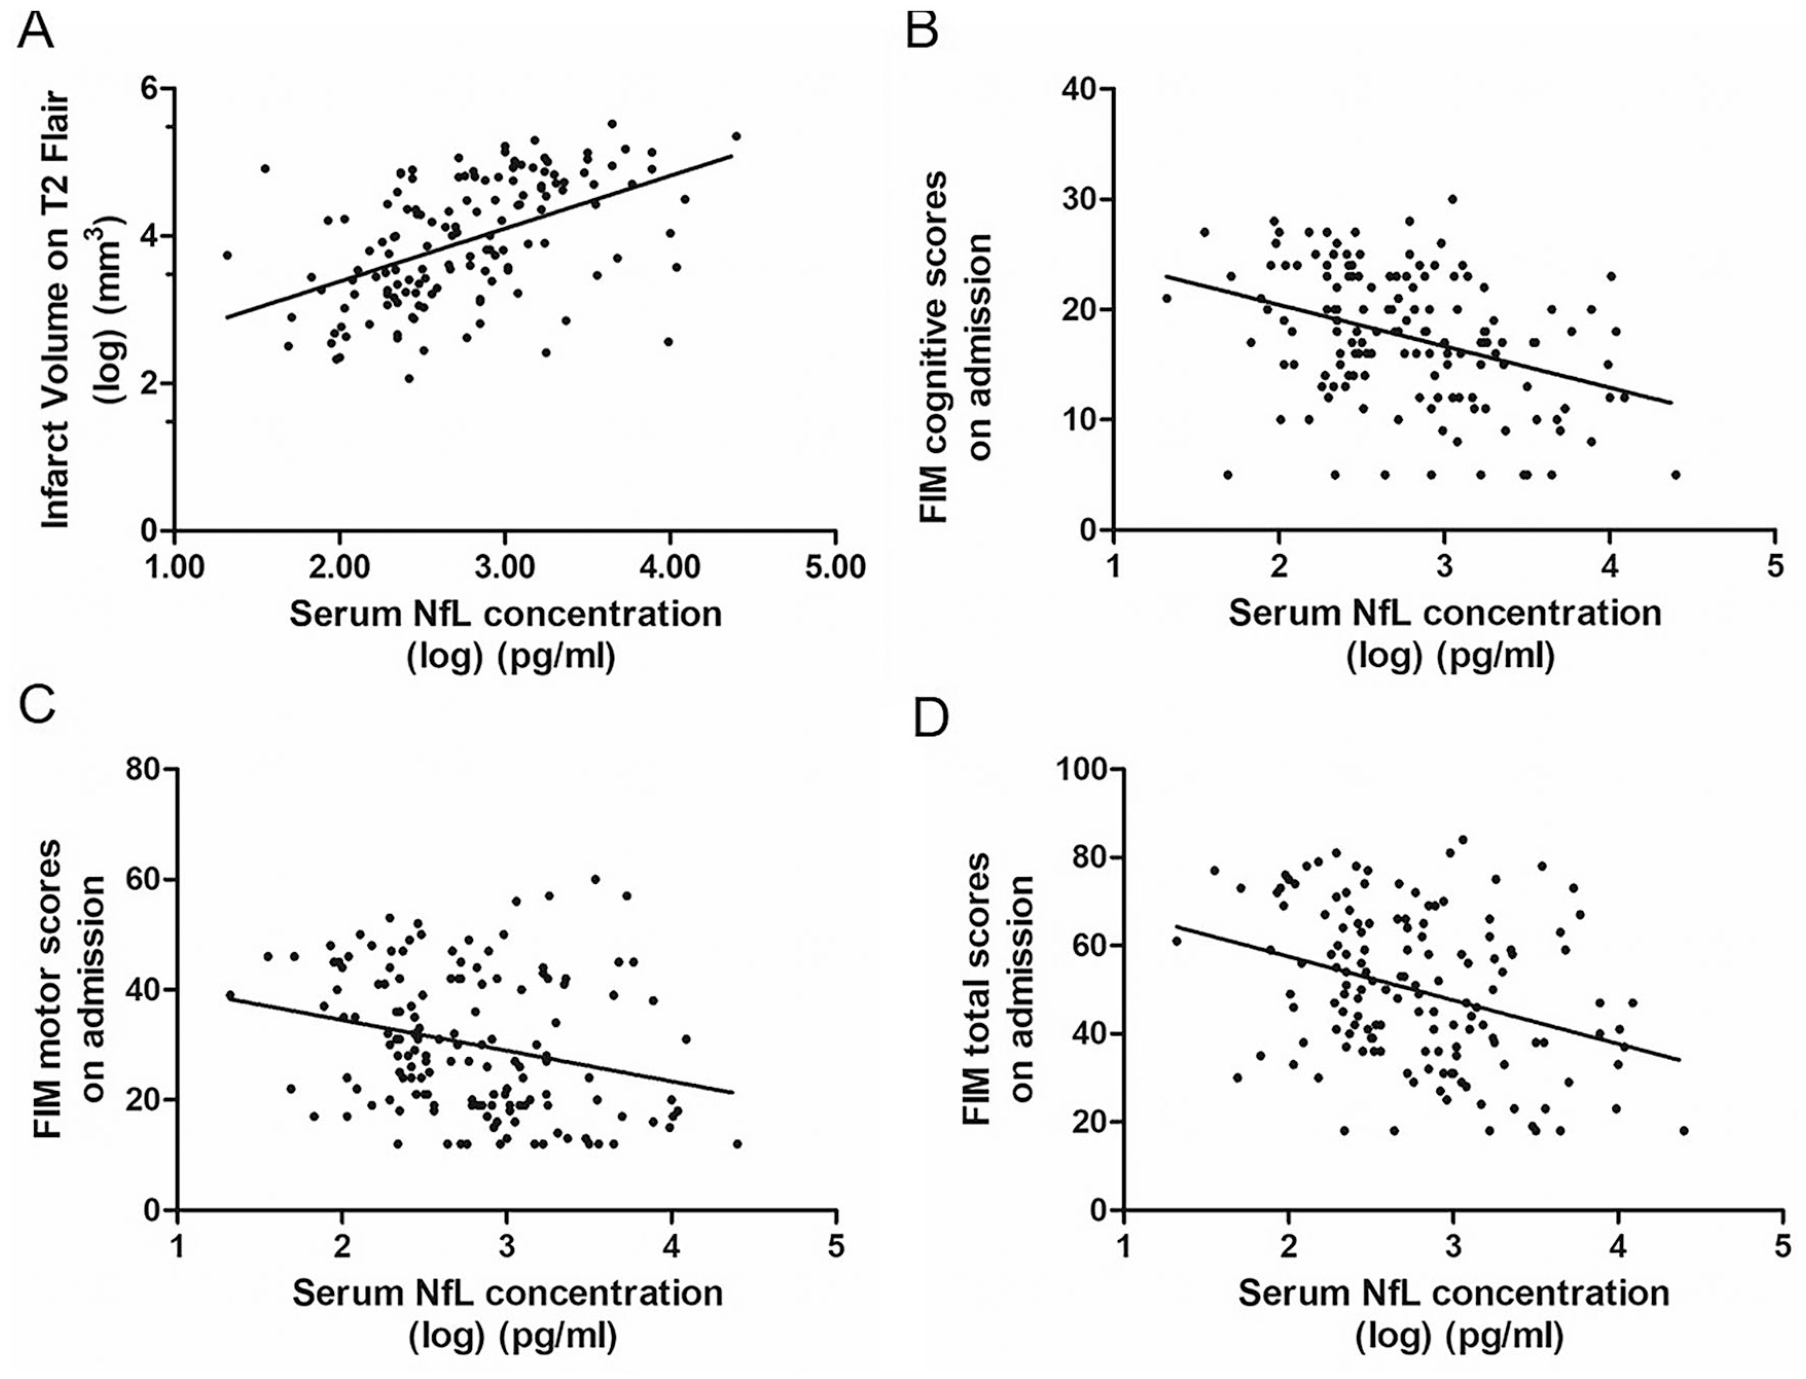
Correlation of serum NfL (neurofilament light chain) levels with infarct volume and stroke severity. (A) The correlation of serum NfL levels and infarct volume (r = 0.460, P < .001). (B) The correlation of serum NfL levels and FIM cognitive subscores on admission (r = −0.387, P < .001). (C) The correlation of serum NfL levels and FIM (Functional Independence Measure) motor subscores (r = −0.306, P < .001). (D) The correlation of serum NfL levels and FIM total scores on admission (r = −0.343, P < .001).
Furthermore, there was a moderate correlation of high serum NfL levels with poor poststroke cognitive function (FIM cognitive subscores on admission; r = −0.387, P < .001; Figure 3B). Moreover, there were negative correlations of serum NfL levels with FIM motor subscores (r = −0.306, P < .001) and FIM total scores on admission (r = −0.343, P < .001; Figure 3C and D).
MRI Markers (Volume of Infarct and WMH) Are Associated With Cognitive Function
There was a weak negative correlation of infarct volume with poststroke cognitive function (FIM cognitive subscores on admission; r = −0.225, P < .05; Figure 4A). WMH volume was also negatively associated with FIM cognitive subscores on admission (r = −0.183, P < .05; Figure 4B).
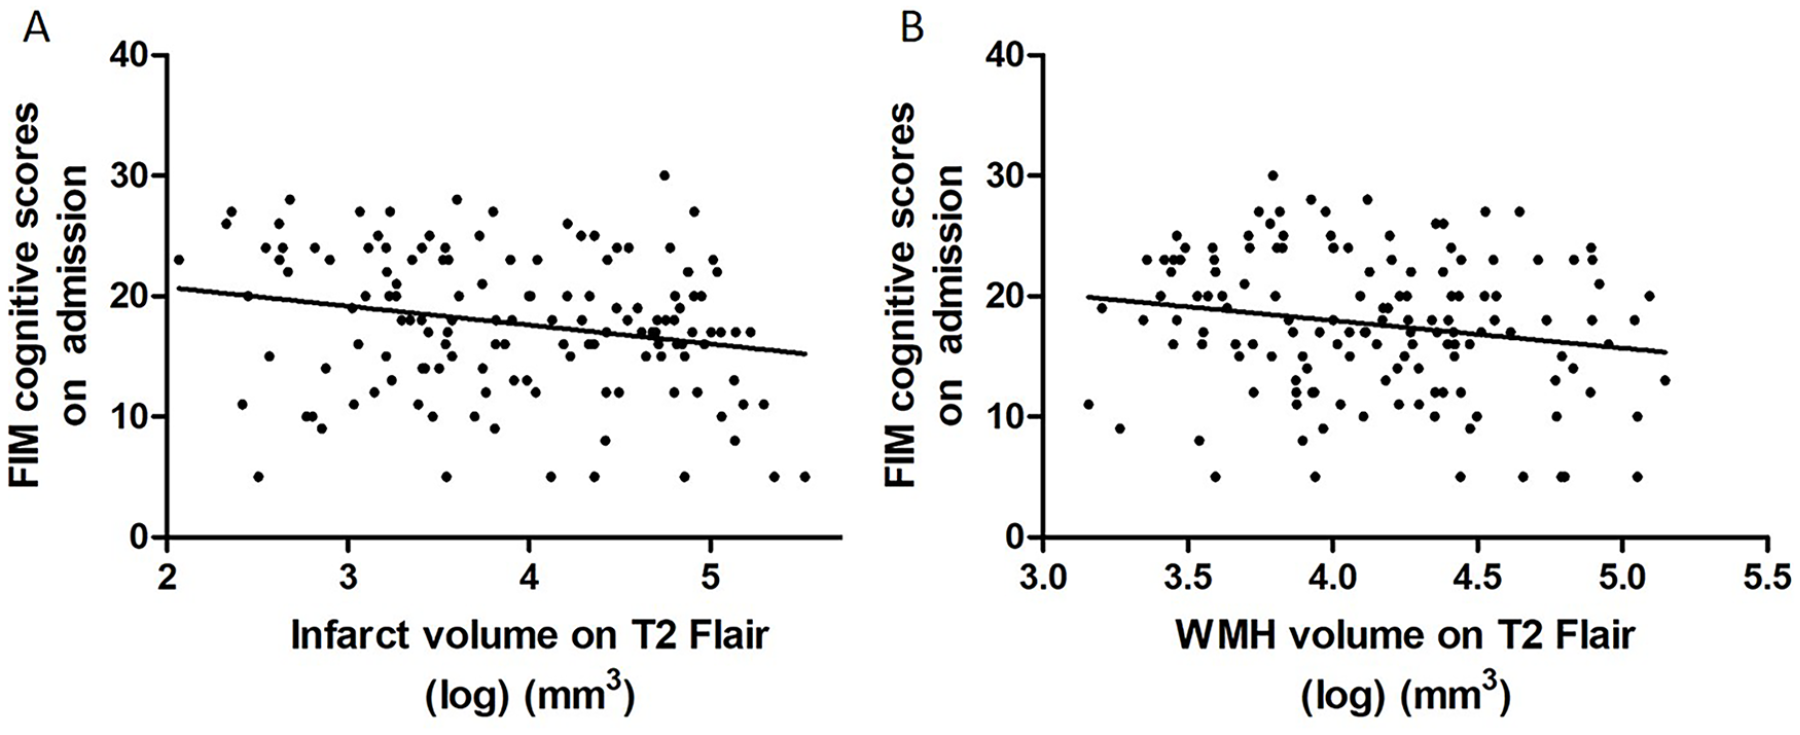
Correlation of MRI markers (infarct volumes and WMH volumes) with infarct volume and stroke severity. (A) The correlation of infarct volumes and FIM cognitive subscores on admission (r = 0.460, P < .001). (B) The correlation of WMH volume and FIM cognitive subscores on admission (r = −0.387, P < .001). Abbreviations: MRI, magnetic resonance imaging; WMH, white matter hyperintensities; FIM, Functional Independence Measure.
Combination of Serum NfL Levels With MRI Markers to Predict Cognitive Outcome
To identify the factors affecting the cognitive outcome after an acute rehabilitation course, we applied stepwise linear regression analysis of FIM cognitive subscores on discharge with log(NfL), translated mRS, infarct volume, and WMH volume. In multivariable analyses, log(NfL) (β = −0.321, P < .001) had the highest significance followed by WMH volume (β = −0.282, P < .001) and infarct volume (β = −0.216, P < .001) at baseline (Supplemental Table 2). Figure 5A shows the ROC curve of log(NfL) for predicting cognitive outcome on discharge, which had an AUC was 0.672 (standard error = 0.045, 95% confidence interval [CI] = 0.584 to 0.760, P < .001). Based on this curve, the best cutoff point was 820.0 pg/mL with a sensitivity and specificity of 54.8% and 77.5%, respectively. In contrast, the translated mRS did not persist as an independent predictor of FIM cognitive score in the multivariable analyses (P = .065).
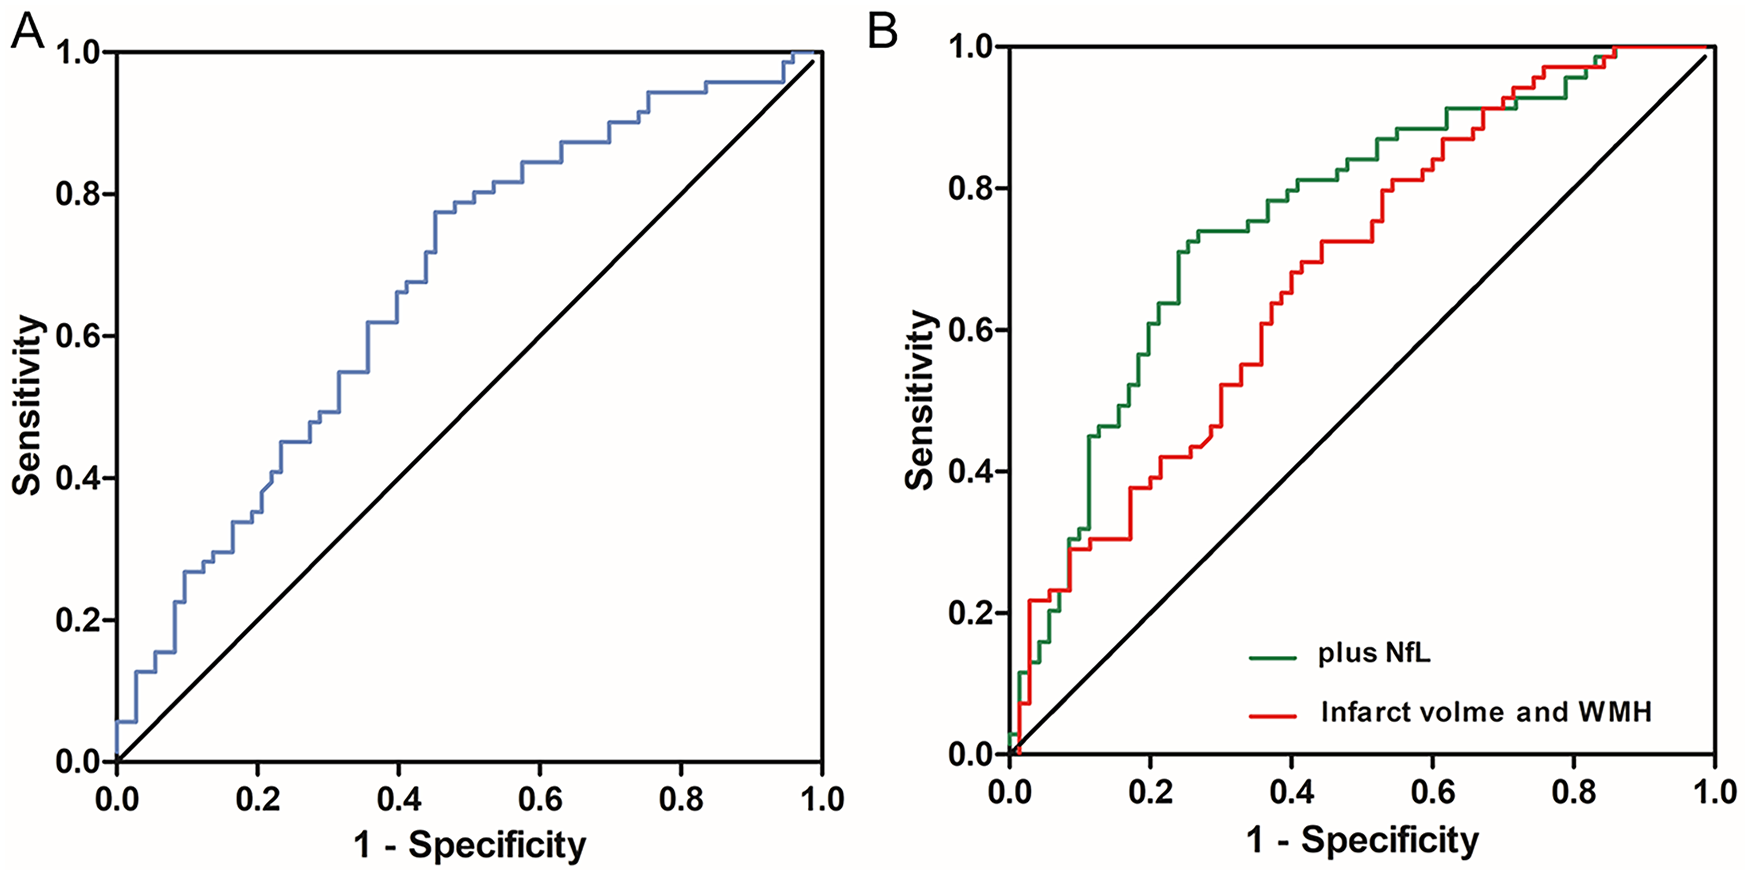
Receiver operating characteristic (ROC) analysis of (A) serum NfL (neurofilament light chain) levels as a predictor for FIM (Functional Independence Measure) cognitive subscores on discharge. Area under the curve (AUC) is 0.672 (P = .000). (B) MRI (magnetic resonance imaging) markers (volume of infarct and WMH) as a predictor for FIM cognitive subscores on discharge (red line). AUC is 0.683 (P = .000). MRI markers combined with serum NfL levels as a predictor for FIM cognitive subscores on discharge (green line). AUC is 0.760 (P = .000).
The AUC of infarcted volume, WMH volume, and MRI markers (volume of infarction and WMH) were 0.622 (standard error = 0.033, 95% CI = 0.557 to 0.687, P < .001), 0.596 (standard error = 0.034, 95% CI = 0.529 to 0.662, P < .001), and 0.683 (standard error = 0.045, 95% CI = 0.595 to 0.771, P < .001), respectively (Figure 5B and Supplemental Figure 1). The combination log(NfL) and MRI markers (volume of infarct and WMH) increased the AUC (AUC = 0.760, standard error = 0.041, 95% CI = 0.680 to 0.840, P < .001; Figure 5B).
Discussion
Our findings indicate that a biomarker panel of serum NfL levels combined with MRI markers (volume of infarction and WMH) had a promising predictive value for cognitive outcome during postacute rehabilitation. The major findings of this study are as follows: (1) serum NfL levels are markedly elevated and seem stable during the acute rehabilitation; (2) serum NfL levels are associated with infarct volume and stroke severity, including FIM cognitive subscores and FIM motor subscores; and (3) a biomarker panel combined serum NfL with MRI markers enhances the predictive value for poststroke cognitive outcome.
The stroke group had higher serum NfL levels than the stroke-free group, which is consistent with previous findings.14,23 Since NfL is a major component of axonal proteins, neuronal damage and death caused by acute ischemic stroke induces its release into the cerebrospinal fluid (CSF) and entry into the bloodstream through the blood-brain barrier. 7 Serum NfL levels are lower than CSF NfL levels24,25 though strongly correlated. Therefore, serum NfL levels could be a potential marker of neuronal and axonal damage. 26 The Simoa technology employed in our study for quantifying serum NfL levels improved the analytical sensitivity, which is as high as 126-fold and 25-fold more than that of ELISA and ECL assays.27,28 Additionally, our findings are consistent with previous reports that NfL is stable within 3 poststroke months. 23
As expected, we observed a correlation between serum NfL levels and stroke severity as measured by the FIM score. This is consistent with previous studies that employed the NIHSS or mRS to assess stroke severity.15,29 Notably, we observed an association of serum NfL levels with FIM cognitive subscores, which has not been previously reported. PSCI is a complex pathophysiological process with an outcome that is difficult to predict. FIM is a scale used to assess the motor and cognitive function in hospitalized rehabilitation patients internationally. The Montreal Cognitive Assessment (MoCA) is a sensitive cognitive assessing tool used worldwide. Zakharova-Luneva et al found that a correlation between the FIM cognitive subscore and MoCA in rehabilitation inpatients further support the validity of FIMCog as a major endpoint for PSCI. 30 Early diagnosis or prediction of cognitive decline could contribute to prevention and treatment strategies. Our findings highlight the potential application of serum NfL levels in the prognosis of PSCI.
Using a biomarker panel could improve the prognostic sensitivity and specificity by incorporating multiple markers that reflect different pathophysiological post-stroke processes. 31 MRI is a sensitive technique for visualizing neuroaxonal loss that has been used to assess the correlation between structural damage and PSCI. Previous studies indicate that the MRI markers investigated in this study are correlated with clinical outcome.32,33 We observed a correlation of infarct and WMH volume with cognitive impairment (r = −0.225, P < .05, and r = −0.183, P < .05, respectively; Figure 4); however, these associations have been inconsistent and weak. Remarkably, the combination of serum NfL levels with MRI markers improved the predictive capability, which was similar to the conclusion in the study on cerebral small vessel disease by Duering et al. 29 Our findings that the biomarker panel combined serum NfL levels with volume measures could potentially help us understand its pathogenesis in some extent. Furthermore, the reliable biomarker panel explored in this study would give early guidance for personalized treatment and prevention for PSCI.
This study has several methodological strengthens. First, we measured serum NfL levels in the pg/mL range using Simoa technology, which are significantly more sensitive and accurate than the conventional ELISA and chemiluminescence-based methods. Second, all the MRI images used in this study were obtained from 2 hospitals but have similar acquisition parameters (as described in the Methods section). Finally, quantitative image analysis using MATLAB allowed more accurate calculation of the WMH volume on MRI than visual assessment such as Fazekas rating scale. However, this study has several limitations. First, this study was limited by its retrospective nature and small sample size, which inevitably caused bias. Another limitation is that we adopted FLAIR imaging for infarct and WMH volume calculation considering that patients included in the study had MRI scanned within 1 month from stroke onset, and most of them (87.5%) were scanned within just 7 days. A combination of T1w and T2w/FLAIR imaging is superior to solely FLAIR imaging for a more accurate estimation of the infarct volume. In addition, the total brain volume of patients was not collected to normalize the infarct-volumes/WMH volumes in this study. The normalization of infarct volume and WMH volume to control the effect of total brain volume differences between individuals would improve the predictive accuracy. Furthermore, we did not measure the predictive value of serum NfL levels for long-term cognitive outcome. Further randomized controlled clinical researches should focus on its 90-day and long-term prognostic value in cognitive function poststroke.
Conclusions
Taken together, our findings indicate that serum NfL levels measured within one poststroke month could serve as a moderate predictive marker of cognitive outcome on discharge after acute stroke rehabilitation. A biomarker panel by combining serum NfL levels with MRI markers (volume of infarct and WMH) could improve the predictive value and facilitate precise ischemic stroke treatment.
Supplemental Material
sj-docx-1-nnr-10.1177_1545968321989354 – Supplemental material for Combination of Serum Neurofilament Light Chain Levels and MRI Markers to Predict Cognitive Function in Ischemic Stroke
Supplemental material, sj-docx-1-nnr-10.1177_1545968321989354 for Combination of Serum Neurofilament Light Chain Levels and MRI Markers to Predict Cognitive Function in Ischemic Stroke by Yuan Peng, Qianfeng Li, Lei Qin, Yating He, Xun Luo, Yue Lan, Xin Chen, Xin Wang and Qing Mei Wang in Neurorehabilitation and Neural Repair
Footnotes
Declaration of Conflicting Interests
The author(s) declared no potential conflicts of interest with respect to the research, authorship, and/or publication of this article.
Funding
The author(s) disclosed receipt of the following financial support for the research, authorship, and/or publication of this article: Qianfeng Li did a 1-year visiting research scholarship at Stroke Biological Recovery Laboratory, Spaulding Rehabilitation Hospital, and was funded by the Shenzhen “Sanming project” (SZSM201610039).
References
Supplementary Material
Please find the following supplemental material available below.
For Open Access articles published under a Creative Commons License, all supplemental material carries the same license as the article it is associated with.
For non-Open Access articles published, all supplemental material carries a non-exclusive license, and permission requests for re-use of supplemental material or any part of supplemental material shall be sent directly to the copyright owner as specified in the copyright notice associated with the article.