
Abstract
Background and Purpose. Stroke-induced focal brain lesions often exert remote effects via residual neural network activity. Electroencephalographic (EEG) techniques can assess neural network modifications after brain damage. Recently, EEG phase synchrony analyses have shown associations between the level of large-scale phase synchrony of brain activity and clinical symptoms; however, few reports have assessed such associations in stroke patients. Objective. The aim of this study was to investigate the clinical relevance of hemispheric phase synchrony in stroke patients by calculating its correlation with clinical status. Methods. This cross-sectional study included 19 patients with post-acute ischemic stroke admitted for inpatient rehabilitation. Interhemispheric phase synchrony indices (IH-PSIs) were computed in 2 frequency bands (alpha [α], and beta [β]), and associations between indices and scores of the Functional Independence Measure (FIM), the National Institutes of Health Stroke Scale (NIHSS), and the Fugl−Meyer Motor Assessment (FMA) were analyzed. For further assessments of IH-PSIs, ipsilesional intrahemispheric PSIs (IntraH-PSIs) as well as IH- and IntraH-phase lag indices (PLIs) were also evaluated. Results. IH-PSIs correlated significantly with FIM scores and NIHSS scores. In contrast, IH-PSIs did not correlate with FMA scores. IntraH-PSIs correlate with FIM scores after removal of the outlier. The results of analysis with PLIs were consistent with IH-PSIs. Conclusions. The PSIs correlated with performance on the activities of daily living scale but not with scores on a pure motor impairment scale. These results suggest that large-scale phase synchrony represented by IH-PSIs provides a novel surrogate marker for clinical status after stroke.
Keywords
Introduction
Because brain functions depend on the integration of various neural networks, a focal lesion can alter remote network functions in stroke patients.1,2 Recent reports have demonstrated the usefulness of synchronous brain activity for assessing neural network and its association with various clinical statuses. 3 Resting-state functional magnetic resonance imaging (fMRI) in conjunction with functional connectivity (FC) analysis has been utilized to assess stroke patients. 4 Electroencephalography (EEG) and magnetoencephalography (MEG) are also used to measure brain activity.3,5,6 In particular, scalp EEG is frequently used because of its noninvasiveness, superior temporal resolution, low cost, and convenience in a clinical setting. 7
The phase synchrony index (PSI), which represents synchronous brain activity,8 -12 has recently emerged as a new parameter for neural network analysis. Previous studies have found clinically relevant PSIs in patients with pathological conditions such as mania 13 and pediatric coma. 14 However, few studies have assessed the utility of the PSI for evaluating stroke patients. Wu et al reported an association between interhemispheric phase synchronization and scores on the National Institutes of Health Stroke Scale (NIHSS) 15 in acute stroke. 16 Although the NIHSS is an important clinical scale, other clinical scales are needed to evaluate the degree of recovery following an acute stroke. 17 Activities of daily living (ADL) scales are commonly used in post-acute stroke rehabilitation to assess patients’ recovery. Wang et al 18 reported an association between changes in FC by fMRI, and Barthel Index (BI) scores. However, no previous studies have investigated an association between synchronous brain activity, as assessed by EEG, and the Functional Independence Measure (FIM). 19 In contrast to the BI, the FIM evaluates motor and cognitive functions, including self-care, transfers, excretion management, mobility, communication, and social cognition. Thus, investigations using the FIM may provide further insights into the functional recovery after stroke.
In the present study, we evaluated large-scale PSIs in stroke patients using the interhemispheric PSIs (IH-PSIs), which is obtained by averaging all possible PSIs across hemispheres.10,16 We calculated IH-PSIs in the alpha (α) and beta (β) bands, as both of these frequency bands have been highlighted in previous analyses.20,21 We tested for associations between IH-PSIs and scores on the FIM, as well as 2 other commonly used scales, the NIHSS and the Fugl-Meyer Motor Assessment (FMA). 22 The former was chosen as a measure of general neurological impairment and the latter as a measure of pure motor impairment of the limbs.
We hypothesized that IH-PSIs, which reflect synchronous interhemispheric activity in all possible networks rather than within a specific network, would correlate with scores on the FIM, which assesses various aspects of ADL rather than a specific motor function. 19 To prove this hypothesis, several analyses were carried out. First, correlations between IH-PSIs and clinical scales were evaluated and then, ipsilesional intrahemispheric PSIs (IntraH-PSIs) were also assessed. Second, phase lag indices (PLIs) were introduced to evaluate the effects of volume conduction. Finally, lesion volumes were evaluated as possible confounding covariates.
Methods
Subjects
Patients were recruited for this cross-sectional study, from October 3, 2012, to March 28, 2013, from a group of inpatients admitted to the Kaifukuki rehabilitation ward 23 at Morinomiya Hospital following acute stroke. The inclusion criteria were as follows: (1) age ≥18 years and (2) supratentorial ischemic stroke with onset >2 weeks prior to enrollment. The exclusion criteria were as follows: (1) dependence prior to current stroke, as indicated by a modified Rankin scale score of ≥3; (2) severe medical complications that limited ADL; and (3) a medical history of psychiatric disorders or epilepsy. Of 118 inpatients, 19 ischemic stroke subjects (mean age ± standard deviation [SD] = 67.5 ± 10.1 years; 5 females; 1 left-handed subject) were enrolled in the study. Computed tomography (CT) or magnetic resonance imaging (MRI) head scans were performed to locate stroke lesions. The experimental protocol was approved by the Institutional Ethics Committee/Institutional Review Board of Morinomiya Hospital (Approval No. 094) and RIKEN (Saitama, Japan; Approval No. Wako3 25−3 (6)). All subjects or their caretakers/surrogates were provided with the written experimental protocol, and all signed an informed consent form prior to study initiation.
Clinical Assessments
Neurological deficits were assessed using the NIHSS (possible score range: 0-42 points, with higher scores indicating more severe impairments). 15 Motor impairments of the upper and lower limbs were measured using the FMA (possible score range 0-100 points, with lower scores indicating more severe impairments). 22 ADL scores were determined using the FIM, which consists of motor and cognitive subscores. The motor FIM evaluates 13 physical activities (possible score range 13-91 points); the cognitive FIM evaluates 5 cognitive functions (possible score range 5-35 points; lower subscores indicate more severe impairments). 19 All clinical assessments were performed by trained investigators who were blinded to the subjects’ PSIs and PLIs.
EEG Recordings
EEG data were acquired with a NeuroFax EEG 1224 system (Nihon Kohden Co, Tokyo, Japan) with online band pass filtering between 0.53 and 120 Hz and a sampling rate of 500 Hz. Data were recorded from 19 Ag/AgCl electrodes placed according to the international 10-20 system. The ground electrode was placed at the center of the forehead. Each subject was asked to relax in a resting state while lying supine. For the PSI and the PLI measurements, approximately 5 minutes of measurement time was added to the routine clinical EEG. During that time, each subject was asked to alternately close and open his or her eyes for 30 seconds each, 10 times. EEG data collected in the eyes-closed condition (approximately 2.5 minutes in total) were used for analysis. The total EEG recording time was less than 35 minutes per subject.
Data Processing and Phase Synchrony Analysis
Scalp EEG voltages were first re-referenced to digitally averaged signals from the right and left earlobes. Offline bandpass filtering was then applied (0.3-50 Hz), and 1.5-second epochs were extracted with 50% temporal overlap. Epochs were rejected if the EEG voltage was >+150 µV or <−150 µV. The complex Morlet wavelet transform was applied to compute the instantaneous phase of the EEG signals. 12 In this process, nco was set to 8, indicating the number of cycles within a 6-sigma interval of the Gaussian window, with the central frequency ranging from 8 to 18 Hz in steps of 1 Hz.
The PSI was computed within each epoch for each possible electrode pair. The PSI was defined as
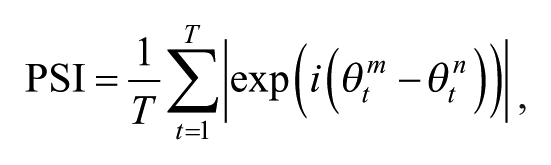
where i denotes the imaginary unit, θ t m and θ t n , respectively,represent the instantaneous phases of the mth and nth channels at the time point t. T is the number of time points (500 in this study).12,24 The PSI estimates phase synchrony between EEG signals from 2 electrodes by computing the temporal consistency of phase differences between the signals in a given time window. The PSI is free from effects of amplitude changes and robustly estimates phase synchrony. PSIs were estimated over 1-second time windows (500 samples), excluding the first and last 125 samples (corresponding to the first and last 0.25 seconds of each 1.5-second epoch). PSIs were averaged over all included EEG epochs to obtain a stable estimation of phase synchrony. In addition, PSIs were averaged over frequencies within the α (8-12 Hz) and β bands (13-18 Hz). PSI matrices in the α band of 2 subjects are shown in Figure 1.
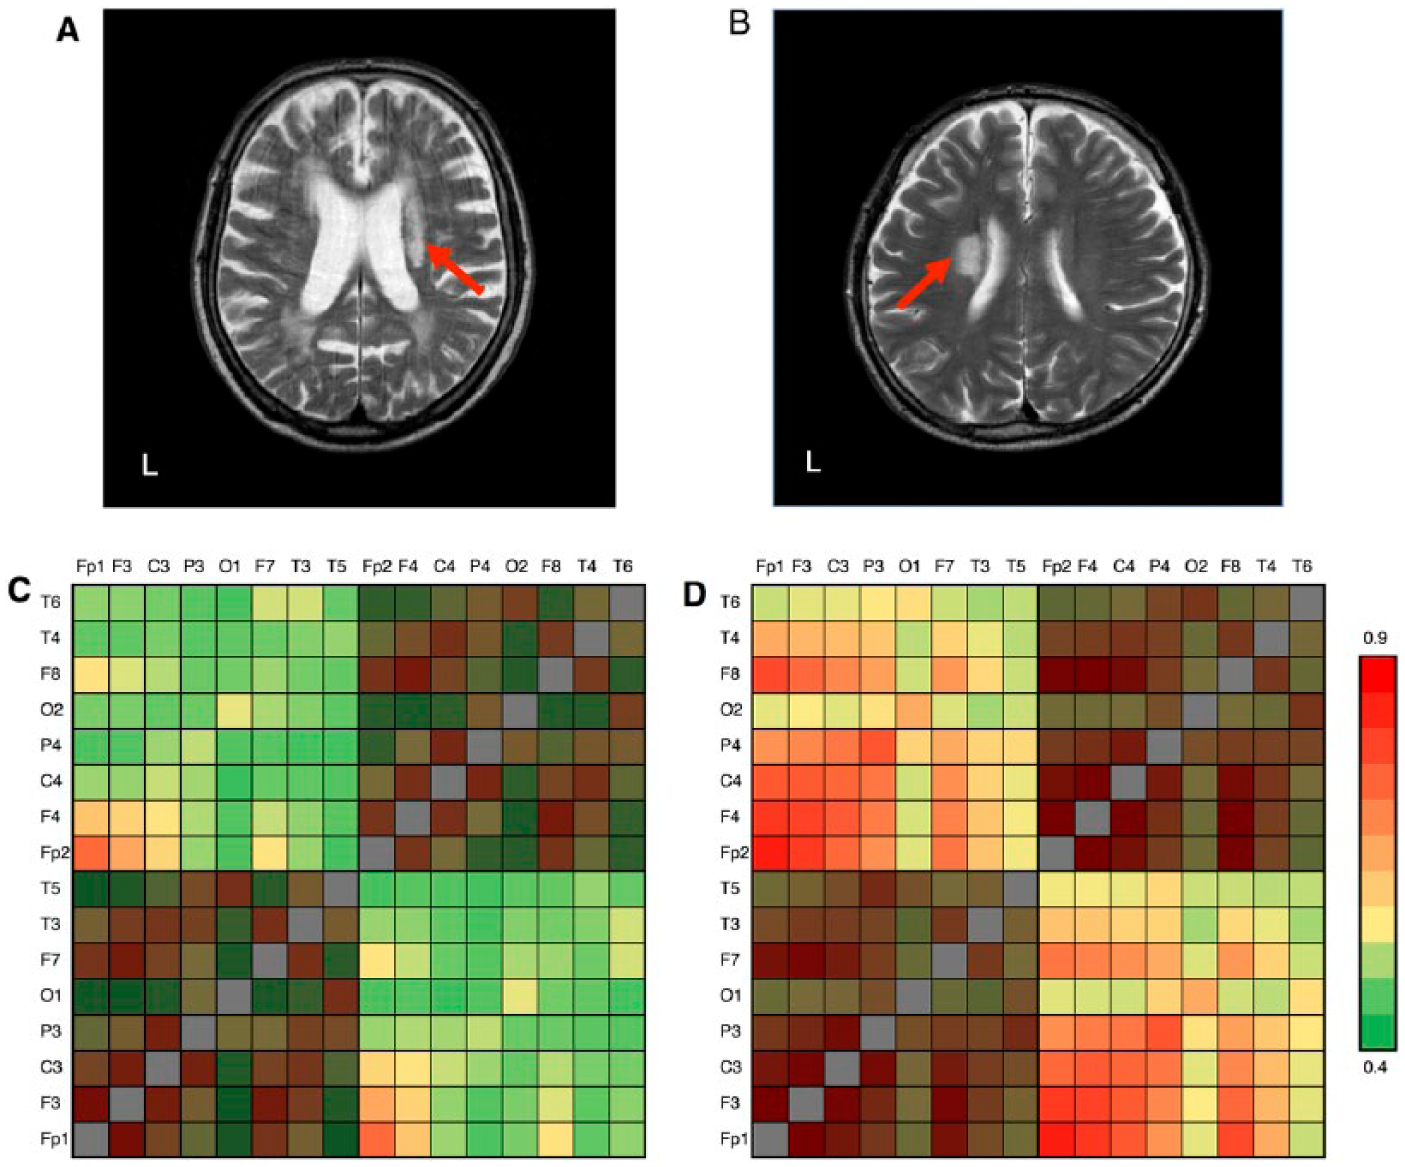
Magnetic resonance images (MRIs) and phase synchrony index (PSI) matrices of 2 study participants. T2-weighted head MRIs of 2 study subjects with subcortical ischemic lesions and Functional Independence Measure (FIM) total scores of 31 (A) and 119 (B) are shown. Red arrows indicate ischemic lesions. The PSI matrices in the α band of the same subjects are shown in (C) and (D), respectively. Red colors show high PSI, while green colors show low PSI. The average of the unshaded PSI matrix entries corresponds to the interhemispheric phase synchrony index (IH-PSI). As demonstrated by the unshaded regions in the figure, subjects with higher FIM scores exhibit higher IH-PSI.
The PLI 25 was defined as
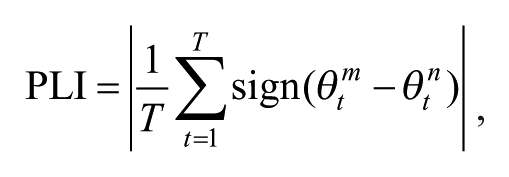
where θ t m and θ t n , respectively, represent the instantaneous phases of the mth and nth channels at the time point t. T is the number of time points (500 samples). Here, the sign indicates a signum function, which is defined as
The PLI also estimates phase synchrony between EEG signals from 2 signals by computing the asymmetry of phase differences between the signals in a given time window. The PLI is a conservative measure of phase synchrony, which is free from the volume conduction. Spurious synchrony caused by volume conduction will result in phase differences around 0 mod pi and will be discarded in the PLI.
IH-PSIs were calculated as the spatial average of local PSIs across all interhemispheric electrode pairs. For further assessments, other synchrony measures were also evaluated, as follows. First, IntraH-PSIs were examined in 18 subjects. One subject (ID: 18) was excluded from this additional analysis; as this subject had dual lesions in both hemispheres, it was impossible to calculate IntraH-PSIs. In other subjects, IntraH-PSIs of the ipsilesional hemisphere were calculated as the spatial average of the local PSIs across all intrahemispheric electrode pairs. Second, IH-PLIs and IntraH-PLIs were calculated in the same way as IH-PSIs and IntraH-PSIs. Finally, C3C4-PSIs that reflects local synchrony of sensorimotor areas were calculated in 19 subjects. All synchrony measures were computed using programs developed using MATLAB R2013b software (MathWorks Inc, Natick, MA, USA).
Lesion Analysis
Stroke lesions were manually drawn on the CT or MRI scans for each subject, and were spatially normalized to the MNI stereotaxic space with the Clinical Toolbox (http://www.nitrc.org/projects/clinicaltbx) in SPM8 (Wellcome Trust Centre for Neuroimaging, London). Then, stroke lesion volumes were calculated.
Statistical Analysis
Spearman’s correlation coefficient rho (ρ) was used to assess relationships between the IH-PSIs and scores on the FIM, NIHSS, and FMA. A Bonferroni correction was applied for testing multiple comparisons (4 clinical scales [motor FIM, cognitive FIM, NIHSS, and FMA] × 2 frequency bands [α and β] = 8).
As partially mentioned above, other synchrony measures (IntraH-PSIs, IH-PLIs, IntraH-PLIs, and C3C4-PSIs) were also evaluated by Spearman’s correlation coefficient. To simplify the comparison, each index was compared with one clinical scale. Correlation analyses of indices that reflect hemispheric synchrony (IntraH-PSIs, IH-PLIs, and IntraH-PLIs) were carried out with FIM total scores, and correlation analysis of index that reflects local synchrony (C3C4-PSIs) was carried out with FMA scores, respectively. These correlation analyses were carried out in the α and β bands, and Bonferroni correction was applied for the 2 frequencies (correction level = 2).
To evaluate lesion volumes, direct correlation analysis (lesion volumes and FIM total scores), and partial correlation analysis (FIM total scores, IH-PSIs, and lesion volumes as a control variable) were carried out. In addition, multivariate regression analysis with the forced entry method was used to assess the effects of lesion volumes as possible confounding covariates. FIM total scores, IH-PSIs, and lesion volumes were converted into rank values before analysis. FIM total scores were assigned as dependent variables, and IH-PSIs and lesion volumes were assigned as independent variables. All statistical analyses were performed using IBM SPSS software, version 22 (IBM Corp, Armonk, NY, USA).
Results
Patient Characteristics
Table 1 summarizes patient demographics and clinical characteristics. Thirteen subjects included in this study presented with right hemispheric lesions, 5 presented with left hemispheric lesions, 1 presented with lesions to both hemispheres, 10 presented with cortical lesions, 8 presented with subcortical lesions, and 1 presented with a combined lesion. The median intervals between stroke onset and clinical assessments (FMA, FIM, and NIHSS) were 37 days (range: 20-192 days), 35 days (range: 22-169 days), and 34 days (range: 15-227 days), respectively.
Patient Demographics and Clinical Characteristics (n = 19).
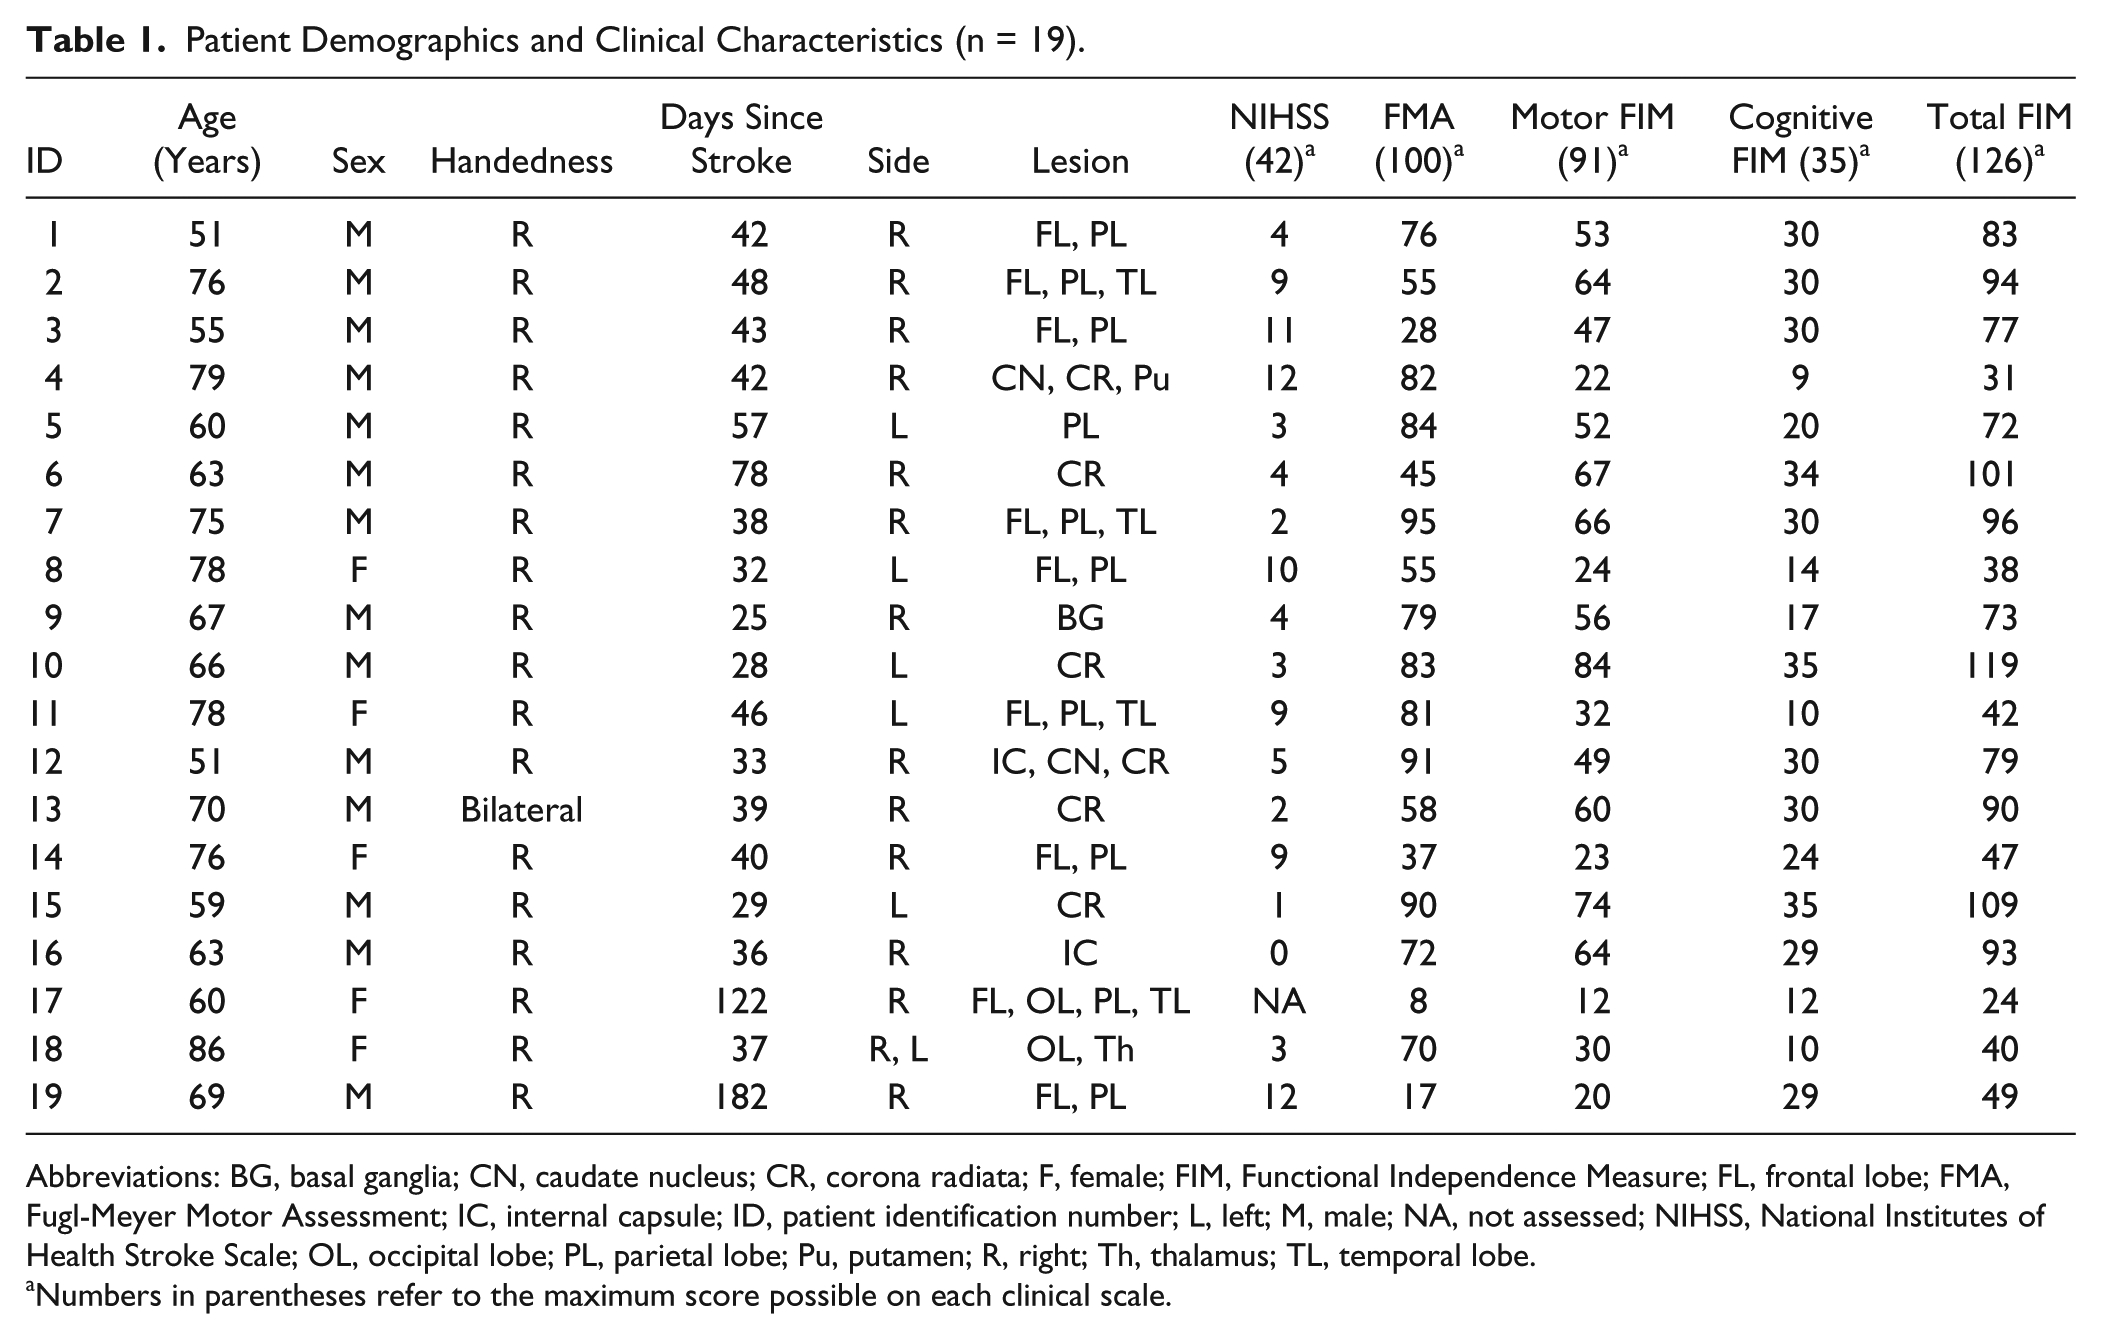
Abbreviations: BG, basal ganglia; CN, caudate nucleus; CR, corona radiata; F, female; FIM, Functional Independence Measure; FL, frontal lobe; FMA, Fugl-Meyer Motor Assessment; IC, internal capsule; ID, patient identification number; L, left; M, male; NA, not assessed; NIHSS, National Institutes of Health Stroke Scale; OL, occipital lobe; PL, parietal lobe; Pu, putamen; R, right; Th, thalamus; TL, temporal lobe.
Numbers in parentheses refer to the maximum score possible on each clinical scale.
Correlation of IH-PSIs With FIM scores
The motor, cognitive, and total FIM scores (mean ± SD) were 47.3 ± 21.0 (range: 12-84, normal score: 91), 24.1 ± 9.2 (range: 9-35, normal score: 35), and 71.4 ± 28.5 (range: 24-119, normal score: 126), respectively. IH-PSIs in both frequency bands were positively correlated with both FIM subscores (motor subscore, α band: ρ = 0.799, P = .00033; motor subscore, β band: ρ = 0.616, P = .04 [Figure 2]; cognitive subscore, α band: ρ = 0.678, P = .011; cognitive subscore, β band: ρ = 0.705, P = .006 [Figure 3]; total score, α band: ρ = 0.756, P = .0014; and total score, β band: ρ = 0.653, P = .02 [Figure 4]). All statistical results were Bonferroni-corrected for multiple comparisons.
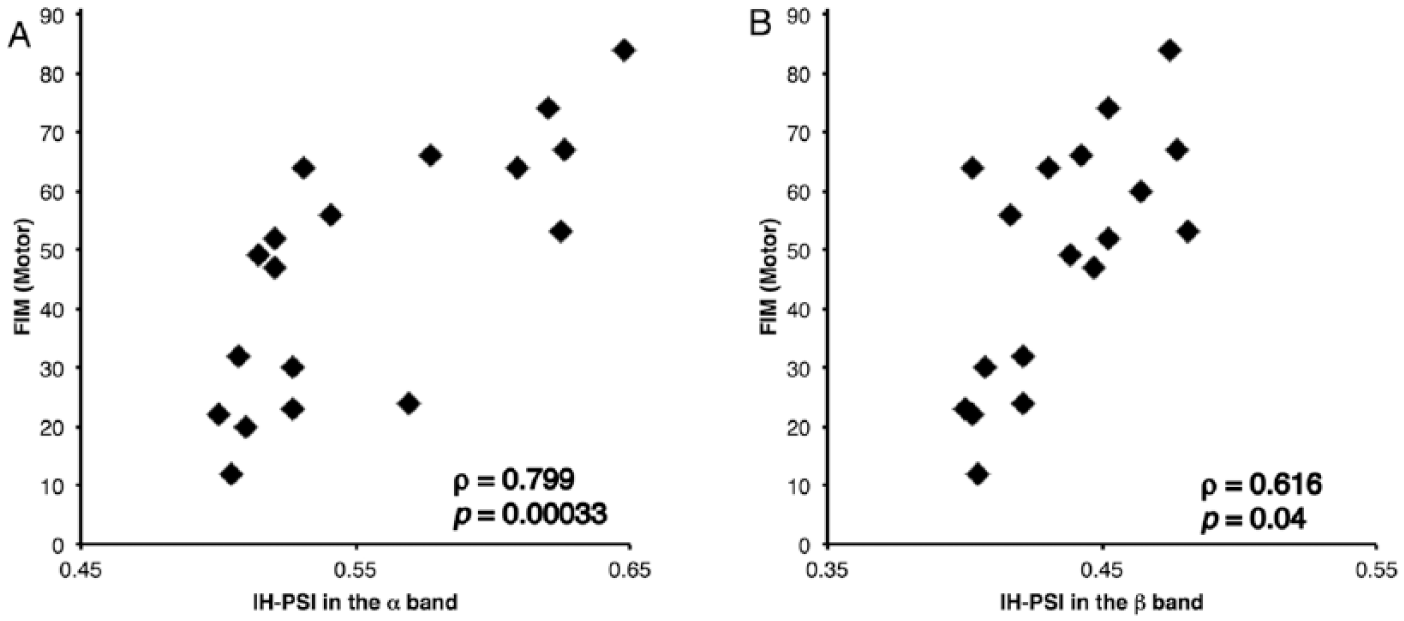
Scatterplots of scores on the Functional Independence Measure (FIM), motor subscale. Scores are plotted against the interhemispheric phase synchrony indices (IH-PSIs) calculated for the α and β bands (A and B, respectively). FIM motor scores (maximum score = 91) show significant positive correlations with IH-PSIs in the α band (ρ = 0.799, P = .00033) and in the β band (ρ = 0.616, P = .04).
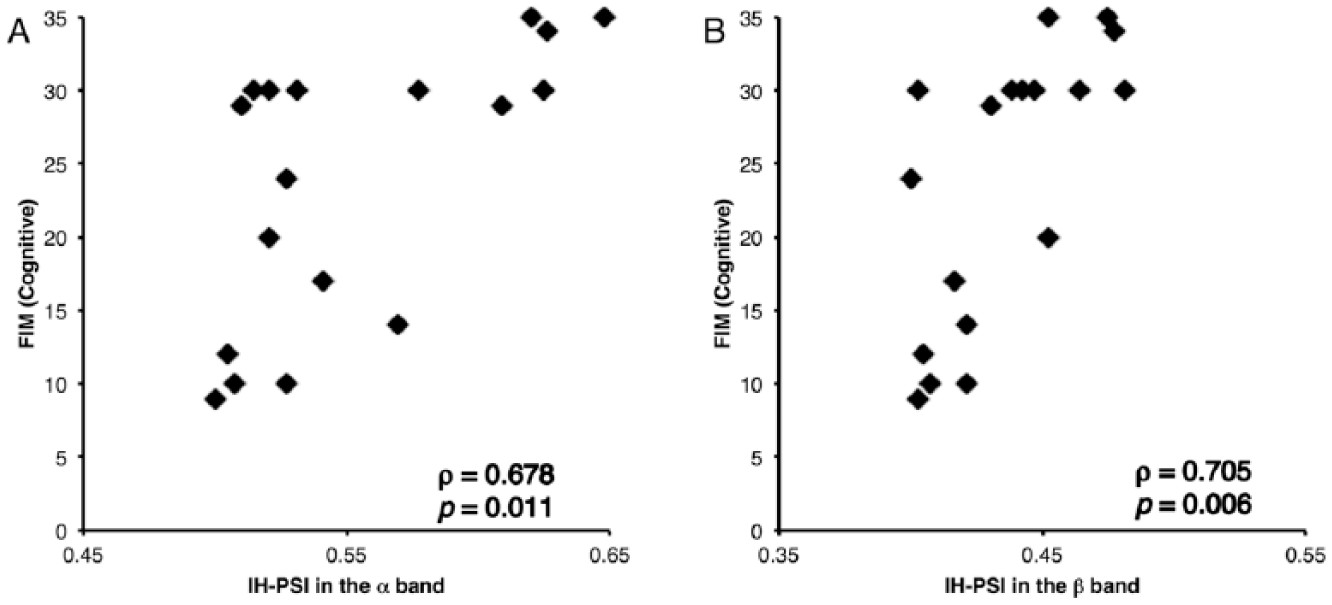
Scatterplots of scores on the Functional Independence Measure (FIM), cognitive subscale. Scores are plotted against interhemispheric phase synchrony indices (IH-PSIs) calculated for the α and β bands (A and B, respectively). FIM cognitive scores (maximum score = 35) show significant positive correlations with IH-PSIs in the α band (ρ = 0.678, P = .011) and in the β band (ρ = 0.705, P = .006).
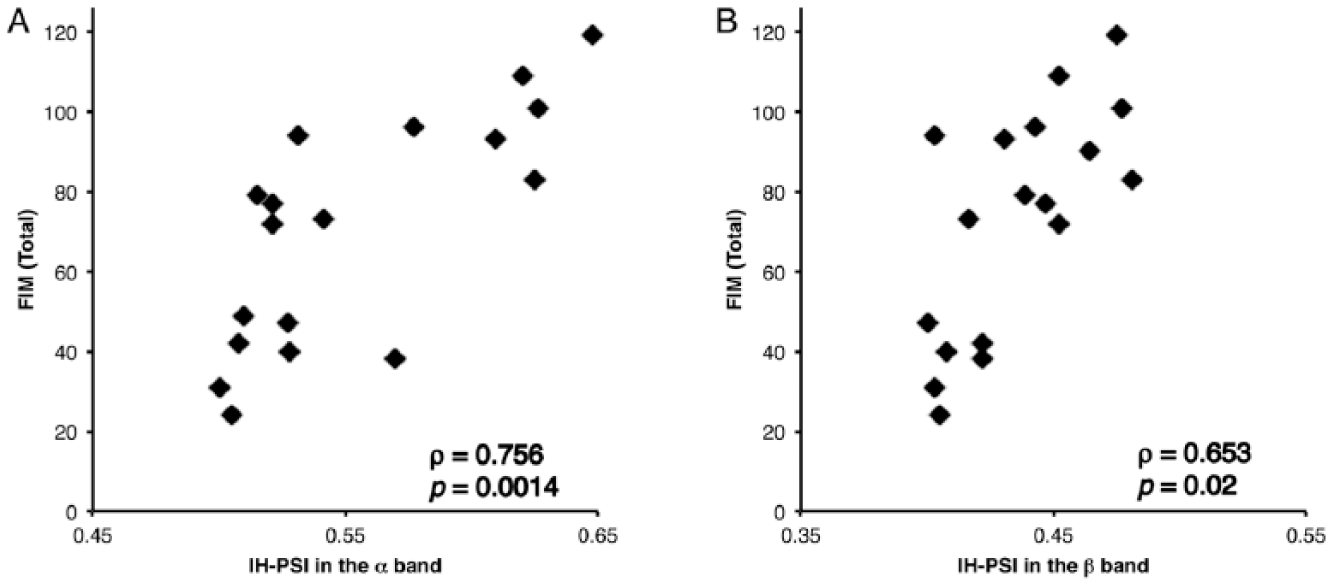
Scatterplots of total scores on the Functional Independence Measure (FIM). Scores are plotted against interhemispheric phase synchrony indices (IH-PSIs) in the α and β bands (A and B, respectively). Total FIM scores (maximum score = 126) show significant positive correlations with IH-PSIs in the α band (ρ = 0.756, P = .0014) and in the β band (ρ = 0.653, P = .02).
Relationships Between IH-PSIs and NIHSS and FMA scores
The mean NIHSS score was 5.7 ± 4.0 (range: 0-12, normal score: 0). A significant negative correlation was observed between IH-PSIs in the α band and NIHSS scores (ρ = −0.687, P = .013, Bonferroni-corrected; Figure 5), but not in the β band (P = .43, Bonferroni-corrected). The mean FMA score was 63.5 ± 26.0 (range: 8-95, normal score: 100). IH-PSIs showed no significant correlations with FMA scores (P = .49 and P = .22 in the α and β bands, respectively, before Bonferroni correction).
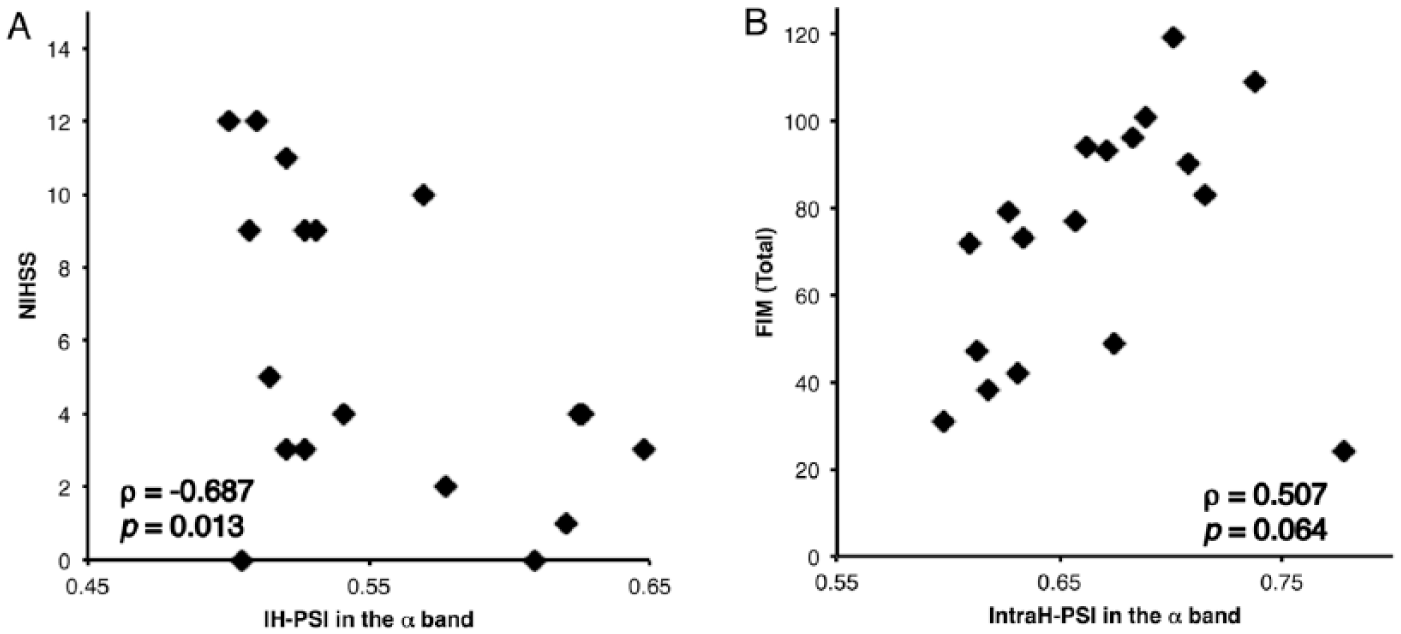
Scatterplot of scores on the National Institutes of Health Stroke Scale (NIHSS), and total scores on the Functional Independence Measure (FIM) against intrahemispheric phase synchrony indices (IntraH-PSIs). Scores are plotted against interhemispheric phase synchrony indices (IH-PSI) in the α band (A). NIHSS scores (maximum score = 42) show a significant negative correlation with IH-PSIs in the α band (ρ = −0.687, P = .013). Total FIM scores are plotted against IntraH-PSIs in the α band (B). Total FIM scores (maximum score = 126) tended to correlate with IntraH-PSIs (ρ = 0.507, P = .064) but did not reach statistical significance. After removal of 1 outlier, total FIM scores show significant positive correlations with IntraH-PSIs (ρ = 0.789, P = .00033).
Correlation of PLIs With FIM Scores, and Spatial and Functional Specificity of PSIs
First, IH-PLIs significantly correlated with FIM total scores in the α band, and tended to correlate in the β band (α band: ρ = 0.626, P = .0082, β band: ρ = 0.468, P = .086, Bonferroni-corrected) (Supplementary Figure 1A). IntraH-PLIs significantly correlated with FIM total scores in the α band, and tended to correlate in the β band (α band: ρ = 0.690, P = .003, β band: ρ = 0.507, P = .064, Bonferroni-corrected) (Supplementary Figure 1B).
Second, IntraH-PSIs tended to correlate with FIM total scores in the α band, but this correlation did not reach statistical significance after correction for multiple comparisons (α band: ρ = 0.507, P = .064, Bonferroni-corrected) (Figure 5B). However, after removal of one outlier (IntraH-PSI > mean + 2SD, ID: 17 with a lesion covering a large part of right hemisphere), IntraH-PSIs significantly correlated with FIM total scores in the α band (ρ = 0.789, P = .00033, Bonferroni-corrected). The lesion volume of this subject was the largest of all subjects (566 887 mm3). In contrast, this subject was not an outstanding outlier and was not excluded from the correlation analysis with IntraH-PLIs (Supplementary Figure 1B; Supplementary Table 1).
Finally, C3C4-PSIs tended to correlate with FMA scores in the α band, but this correlation was not statistically significant (ρ = 0.391, P = .097, before Bonferroni correction).
Lesion Volume Analysis
The median lesion volume was 52 065 mm3 (range: 498-566 887 mm3). First, lesion volumes and FIM total scores were weakly correlated (P = .046). Second, partial correlation analysis revealed that IH-PSIs significantly correlated with FIM total scores after adjustment for the effect of lesion volumes (α band: P = .004, β band: P = .023, Bonferroni-corrected). Finally, multivariate regression analysis revealed that for FIM total scores, the resultant model predicted 57% (α band: P < .01) and 48% (β band: P < .01) of variance, respectively (Supplementary Table 2). All variance inflation factor values were <1.5, suggesting a low possibility of multiple co-linearity between IH-PSIs and lesion volumes. Thus, IH-PSIs were independent predictors of FIM total scores.
Discussion
Correlation of IH-PSIs With Clinical Assessments
Here, we showed that large-scale EEG phase synchrony, represented by IH-PSIs derived from resting-state EEG recordings, reflects the clinical status for both motor and cognitive function in patients with postacute ischemic stroke. Although IH-PSIs were not associated with the severity of pure motor impairment, as scored by the FMA scale, they correlated significantly with NIHSS scores indicating general impairment, and with FIM scores measuring ADL. The significant correlations observed between IH-PSIs and motor, cognitive, and total FIM scores are of particular interest because no report has previously documented an association between brain activity recorded by EEG and scores on the FIM, a standard measure of ADL used during stroke rehabilitation. 19 The observed correlations between IH-PSIs and both motor and cognitive FIM sub-scores indicate that a large-scale interhemispheric network may be involved in both motor and cognitive recovery. Consistent with this notion, Guggisberg et al 21 measured for instance, EEG β-band coherences in contralesional homologous interhemispheric regions, including the triangular part of the inferior frontal gyrus for the language network and the inferior parietal lobule for the spatial attention network, which are critical components of language and spatial attention networks, respectively. Their results showed that β-band coherence in these regions was associated with performances on verbal working memory and spatial attention tasks, respectively. Another study found that resting-state interhemispheric β-band coherence within primary sensorimotor areas was increased by rehabilitation. 26 A longitudinal fMRI study found that progressive recovery of ADL, as assessed by the BI, was associated with changes in FC between ipsilesional and contralesional motor-related areas. 18 In addition, EEG interhemispheric signal coherence showed parallel shifts to FC, as determined by functional MRI (fMRI) in a longitudinal study in rats. 27 These reports suggest that interhemispheric synchronous brain activity may be an important measure of recovery in stroke patients. Based on these reports concerning specific network functions and simple clinical status, our hypothesis that the summation of specific network functions reflects the complex activity of daily living assessed by FIM scores is plausible.
Volume Conduction Effects and the Spatial Specificity of PSIs
When discussing the correlation of IH-PSIs, it is very important to consider the effects of the spurious synchrony caused by the volume conduction from common sources.9,25 It is plausible that if IH-PSIs and IntraH-PSIs are subject to spurious synchrony, the degree of spurious synchrony would be higher for IntraH-PSIs than for IH-PSIs, due to the proximity of the electrodes. As noted in the Results section, both IH-PSIs and IntraH-PSIs (after removal of 1 outlier) correlated with FIM total scores. This indicated that IntraH-PSIs were more susceptible to the presence of outlier. A reason for this might be the extraordinary large lesion, which suggested the presence of cerebrospinal fluid rather than brain tissue under the electrodes, caused the spurious synchrony. Furthermore, as supposed above, the effect of the spurious synchrony was more serious for IntraH-PSIs than for IH-PSIs. In fact, the same subject (ID: 17) was not an outlier in the correlation analysis with IH-PSIs (Figure 4A). It is conceivable that the spurious synchrony would hinder detection of correlations rather than induce a false correlation.
We consider that the results of analysis with the PLI may also supportive to our hypothesis. The PLI is a measure of the asymmetry of the distribution of phase differences between 2 signals and is free from volume conduction. 25 In our study, PLIs correlated significantly with FIM total scores and the results were consistent with that of PSIs (Supplementary Table 1). The fact that 2 different synchrony measures showed consistent results indicated the robustness of the correlation between phase synchrony and the clinical scores. Taken together, it is less likely that the observed correlations originated merely from volume conduction. In addition, the PLI tends to underestimate the true level of coupling, because it discards findings near 0 phase coupling. 25 Thus, it seems to be feasible to use IH-PSIs for the assessments of FIM scores.
Concerning spatial specificity, although both IH-PSIs and IntraH-PSIs correlated with FIM total scores, IH-PSIs was less susceptible to spurious synchrony due to a large lesion than IntraH-PSIs (Supplementary Table 1).
Assessment of the Local Network and the Functional Specificity of IH-PSIs
Although both FMA and FIM motor scores tended to be low in in severely affected patients, IH-PSIs were significantly correlated only with FIM scores. The FMA assesses volitional movement, coordination/speed, and normal reflex activity of limbs. 22 According to an earlier fMRI study, it seemed that the local network of sensorimotor areas would be more appropriate than IH-PSIs for the assessment of FMA scores. 4 To clarify this point, the C3C4-PSIs were evaluated. These values tended to correlate with FMA scores, but the correlation did not reach statistical significance. According to an earlier EEG report, the contribution of the contralesional primary motor cortex may be less apparent in a resting state EEG study, and is subject to the time poststroke. 7 The number of subjects in our dataset may also have contributed to the lack of statistical significance of this correlation.
Assessment of the Lesion Volume
Although lesion volumes and FIM total scores showed a weak negative correlation, the results of partial correlation analysis supported our hypothesis that the correlation of IH-PSIs and FIM total scores were independent of lesion volumes. Multivariate regression analysis revealed that IH-PSIs were better predictors of FIM total scores. The low co-linearity between IH-PSIs and lesion volumes suggested that IH-PSIs do not reflect merely the damaged status of the brain, but rather indicate the damage to the global networks.
Effects of Band Frequency
In contrast to earlier work showing a correlation between NIHSS scores and interhemispheric phase synchronization only in the α band, 16 the current investigation revealed significant correlations of both α- and β-band IH-PSIs with behavioral performance. These results are consistent with previous EEG and MEG studies that have demonstrated the significance of coherence or synchrony in both frequency bands.20,21 Although coherence analysis and phase synchrony analysis are not equivalent, the band specificity of coherence analysis is likely also applicable to phase synchrony analysis, as these two techniques have a common physiological basis. Another EEG study of stroke patients demonstrated that upper extremity motor scores were correlated with α band coherence between lesioned and contralateral motor cortex. 6 Conversely, improvements in grip power of the paretic hand after stroke rehabilitation were correlated with changes in β band coherence between bilateral sensorimotor cortices. 26 In another study, stroke-induced impairments in upper extremity motor function and improvement during rehabilitation, as assessed by the FMA, were both associated with β band coherence between the ipsilesional sensorimotor and premotor cortices. 7 Regarding the functional significance of synchrony within frequency bands, it has been suggested that lagged phase synchronization in the α band reflects network connections between lesioned areas and the remainder of the cortex, whereas amplitude envelope correlation in the β band reflects the coupling of interhemispheric homologous regions. 21 In our study, IH-PSIs were calculated by averaging PSIs among all interhemispheric electrode pairs. Hence, IH-PSIs may have been affected by interhemispheric interactions between both nonhomologous and homologous regions. This diversity may account for the observed correlations between clinical measures and IH-PSIs in both the α and β frequency bands.
Study Limitations
The current study has some limitations. First, the number of subjects was relatively small. However, we clearly detected correlations between IH-PSIs and scores on clinical scales. Second, all subjects had experienced ischemic stroke; hemorrhagic stroke patients were not included in the study. Third, subjects were from a mixed population, which included subacute and chronic patients. Finally, the initial stroke severity, another possible confounding factor could not be assessed due to the unavailability of data on all subjects, as they were transferred from other acute care hospitals. Further studies measuring PSIs in a larger cohort of stroke patients will be required to confirm the clinical relevance of the PSI at both the local and global level. Longitudinal investigations of the relationship between PSI changes and functional improvements after rehabilitation are ongoing.
Conclusions
This study demonstrates that large-scale phase synchrony represented by IH-PSIs correlates with clinical assessments of general impairment and ADL in ischemic stroke patients. Our results also support the significance of frequency bands in phase synchrony analysis. Altogether, our results suggest that EEG synchrony mediated assessment of injury-induced neural network alterations is a potential marker of ADL in stroke patients during the rehabilitation phase. Importantly, as this EEG technique is based on the traditional international 10-20 system, it is neither invasive nor time-consuming and is readily adaptable to routine clinical use. Our novel findings suggest the possibility of employing neuromodulatory interventions to increase IH-PSIs directly in stroke patients, thereby facilitating motor and cognitive improvements. 28
Footnotes
Acknowledgements
The authors wish to thank Prof. Steven Cramer for his valuable advice.
Declaration of Conflicting Interests
The authors declared the following potential conflicts of interest with respect to the research, authorship, and/or publication of this article: Yutaka Uno holds a patent pending JPA No. 2016-47239. Keiichi Kitajo holds patents pending JPA No. 2014-161677, WO2014132964 A1, and JPA No. 2016-47239. Ichiro Miyai serves as an Associate Editor of Neurorehabilitation & Neural Repair.
Funding
The authors disclosed receipt of the following financial support for the research, authorship, and/or publication of this article: This work was supported by the Toyota Motor Corporation. Noriaki Hattori and Keiichi Kitajo were supported by funds from the JST PRESTO program.
Supplementary material is available for this article online on the Neurorehabilitation & Neural Repair website.
References
Supplementary Material
Please find the following supplemental material available below.
For Open Access articles published under a Creative Commons License, all supplemental material carries the same license as the article it is associated with.
For non-Open Access articles published, all supplemental material carries a non-exclusive license, and permission requests for re-use of supplemental material or any part of supplemental material shall be sent directly to the copyright owner as specified in the copyright notice associated with the article.