
Abstract
Background
We recently discovered that individuals with complete spinal cord injury (SCI) have a higher grip force control ability in their intact upper limbs than able-bodied subjects. However, the neural basis for this phenomenon is unknown.
Objective
This study aimed to investigate the neural basis of the higher grip force control in the brains of individuals with SCI using multimodal magnetic resonance imaging (MRI).
Methods
Eight SCI subjects and 10 able-bodied subjects performed hand grip force control tasks at 10%, 20%, and 30% of their maximal voluntary contraction during functional MRI (fMRI). Resting-state fMRI and T1-weighted structural images were obtained to investigate changes in brain networks and structures after SCI.
Results
SCI subjects showed higher grip force steadiness than able-bodied subjects (P < .05, corrected), smaller activation in the primary motor cortex (P < .05, corrected), and deactivation of the visual cortex (P < .001, uncorrected). Furthermore, SCI subjects had stronger functional connectivity between the superior parietal lobule and the left primary motor cortex (P < .001, uncorrected), as well as larger gray matter volume in the bilateral superior parietal lobule (P < .001, uncorrected).
Conclusions
The structural and functional reorganization observed in the superior parietal lobule of SCI subjects may represent the neural basis underlying the observed higher grip force control, and is likely responsible for the smaller activation in the primary motor cortex observed in these individuals. These findings could have applications in the fields of neurorehabilitation for improvement of intact limb functions after SCI.
Keywords
Introduction
Motor learning induces use-dependent plastic changes in the brains of able-bodied (AB) people, while injury-induced compensatory plastic changes occur in people with physical disabilities. In a review of research into human spinal cord injury (SCI), Solstrand-Dahlberg et al 1 reported that significant structural reorganization occurs in the brain following complete deafferentation of the spinal cord. For example, gray matter (GM) volume is reduced in the lower limb representation of the primary somatosensory cortex (S1) after SCI.2-5 Moreover, some studies have also indicated the functional reorganization that S1 upper limb representations are expanded in people with SCI; for example, individuals with SCI show a medial shift in the S1 finger representation during sensory tactile stimulation.4,6 Additionally, some studies have focused on the reorganization of neural connectivity among sensory and motor-related areas after SCI.7,8 These changes likely represent injury-induced brain reorganization to compensate for lost functions 8 and their mechanism partly differs from that of plastic changes in AB individuals.
Many studies have described the relationship between brain reorganization in the sensorimotor cortex and paralyzed body parts after SCI.1-11 However, the relationship between brain reorganization and the motor function of intact limbs has not been fully explored. Until recently, no studies have investigated whether the motor function of intact limbs can be developed more in subjects with SCI than AB. Motor function after injury may be enhanced, as SCI individuals need their remaining body parts to compensate for lost function and to adapt their daily life with their remaining intact limbs. Recently, we found that individuals with complete thoracic or lumbar SCI show higher force steadiness in their intact hand grip than those with other lower limb disabilities and AB subjects. 12 We used the hand grip force control task, well known as an index for evaluating neuromotor control,13-16 which is often used as an assessment of motor function in basic and clinical studies. In addition to peripheral tissues such as muscles, adaptive changes in motor commands from the brain via the corticospinal pathway may affect force fluctuation.17-19 Therefore, we believed that force fluctuation during the task would help clarify the state of comprehensive neuromotor control pathways from the brain to the muscles and hypothesized that functional and/or structural brain reorganization occurs in the sensorimotor cortices of SCI patients. In line with this hypothesis, Mizuguchi et al 20 and Nakagawa et al 21 revealed drastic brain reorganization in the M1 in a world-class amputee athlete, adding that this reorganization might have contributed to the motor function development of their intact body parts. It follows that brain reorganization may be the neural basis of hyperadaptation in the intact limbs of individuals with SCI. Researchers must elucidate these relationships to understand the intrinsic mechanisms underlying brain adaptation to the SCI. The current study aimed to investigate the relationship between this brain reorganization and the increased upper limb motor function observed after complete motor and sensory loss due to SCI. We used multimodal magnetic resonance imaging (MRI) measurements, including task fMRI, resting-state fMRI, and T1-weighted (T1w) structural images, to comprehensively investigate functional and structural brain reorganization after SCI.
Methods
Participants
Hand grip force control tasks were conducted during fMRI in 2 groups: subjects with SCI and AB. The force control task was conducted as it reflected both the state of the motor unit and the condition of the brain, and could evaluate the overall ability of the upper limb motor control system.12-15 Eight individuals with chronic-phase SCI participated in the present study—6 males and 2 females aged 41.0 ± 13.8 years, 18.4 ± 13.1 years post injury. Additionally, 10 AB subjects were recruited—8 males and 2 females aged 23.0 ± 3.6 years. All subjects were confirmed as right-handed according to the Edinburgh Handedness Inventory. 22 Table 1 shows the demographics and relevant clinical information of each group. We recruited individuals with SCI using the following exclusion criteria: (1) paralysis in the upper limbs and difficulty applying force to a force transducer in the hand grip configuration and (2) pain or anomalous sensations in the upper or lower limbs. Most of the recruited patients had complete sensorimotor lesions in the lower limbs (American Spinal Injury Association [ASIA] Impairment Scale [AIS] A; Table 1). One subject’s ankle was not completely paralyzed (Table 1). In terms of medications, only Sub.4 of the SCI group was taking hypertensive medication. A physiotherapist (TN) confirmed that the AB subjects had no neurological disorders, by carefully checking for neurological symptoms, pain, and motor dysfunction through questionnaires and interviews. The study was conducted in accordance with the tenets of the Declaration of Helsinki (2000) and was approved by the Human Ethics Committee of the Graduate School of Arts and Sciences, The University of Tokyo (2018, No. 581-2). Prior to beginning the experiment, each subject read and signed a research consent form approved by the Graduate School of Arts and Sciences, The University of Tokyo (581-2).
Population Demographics and Relevant Clinical Information From Each Group a .
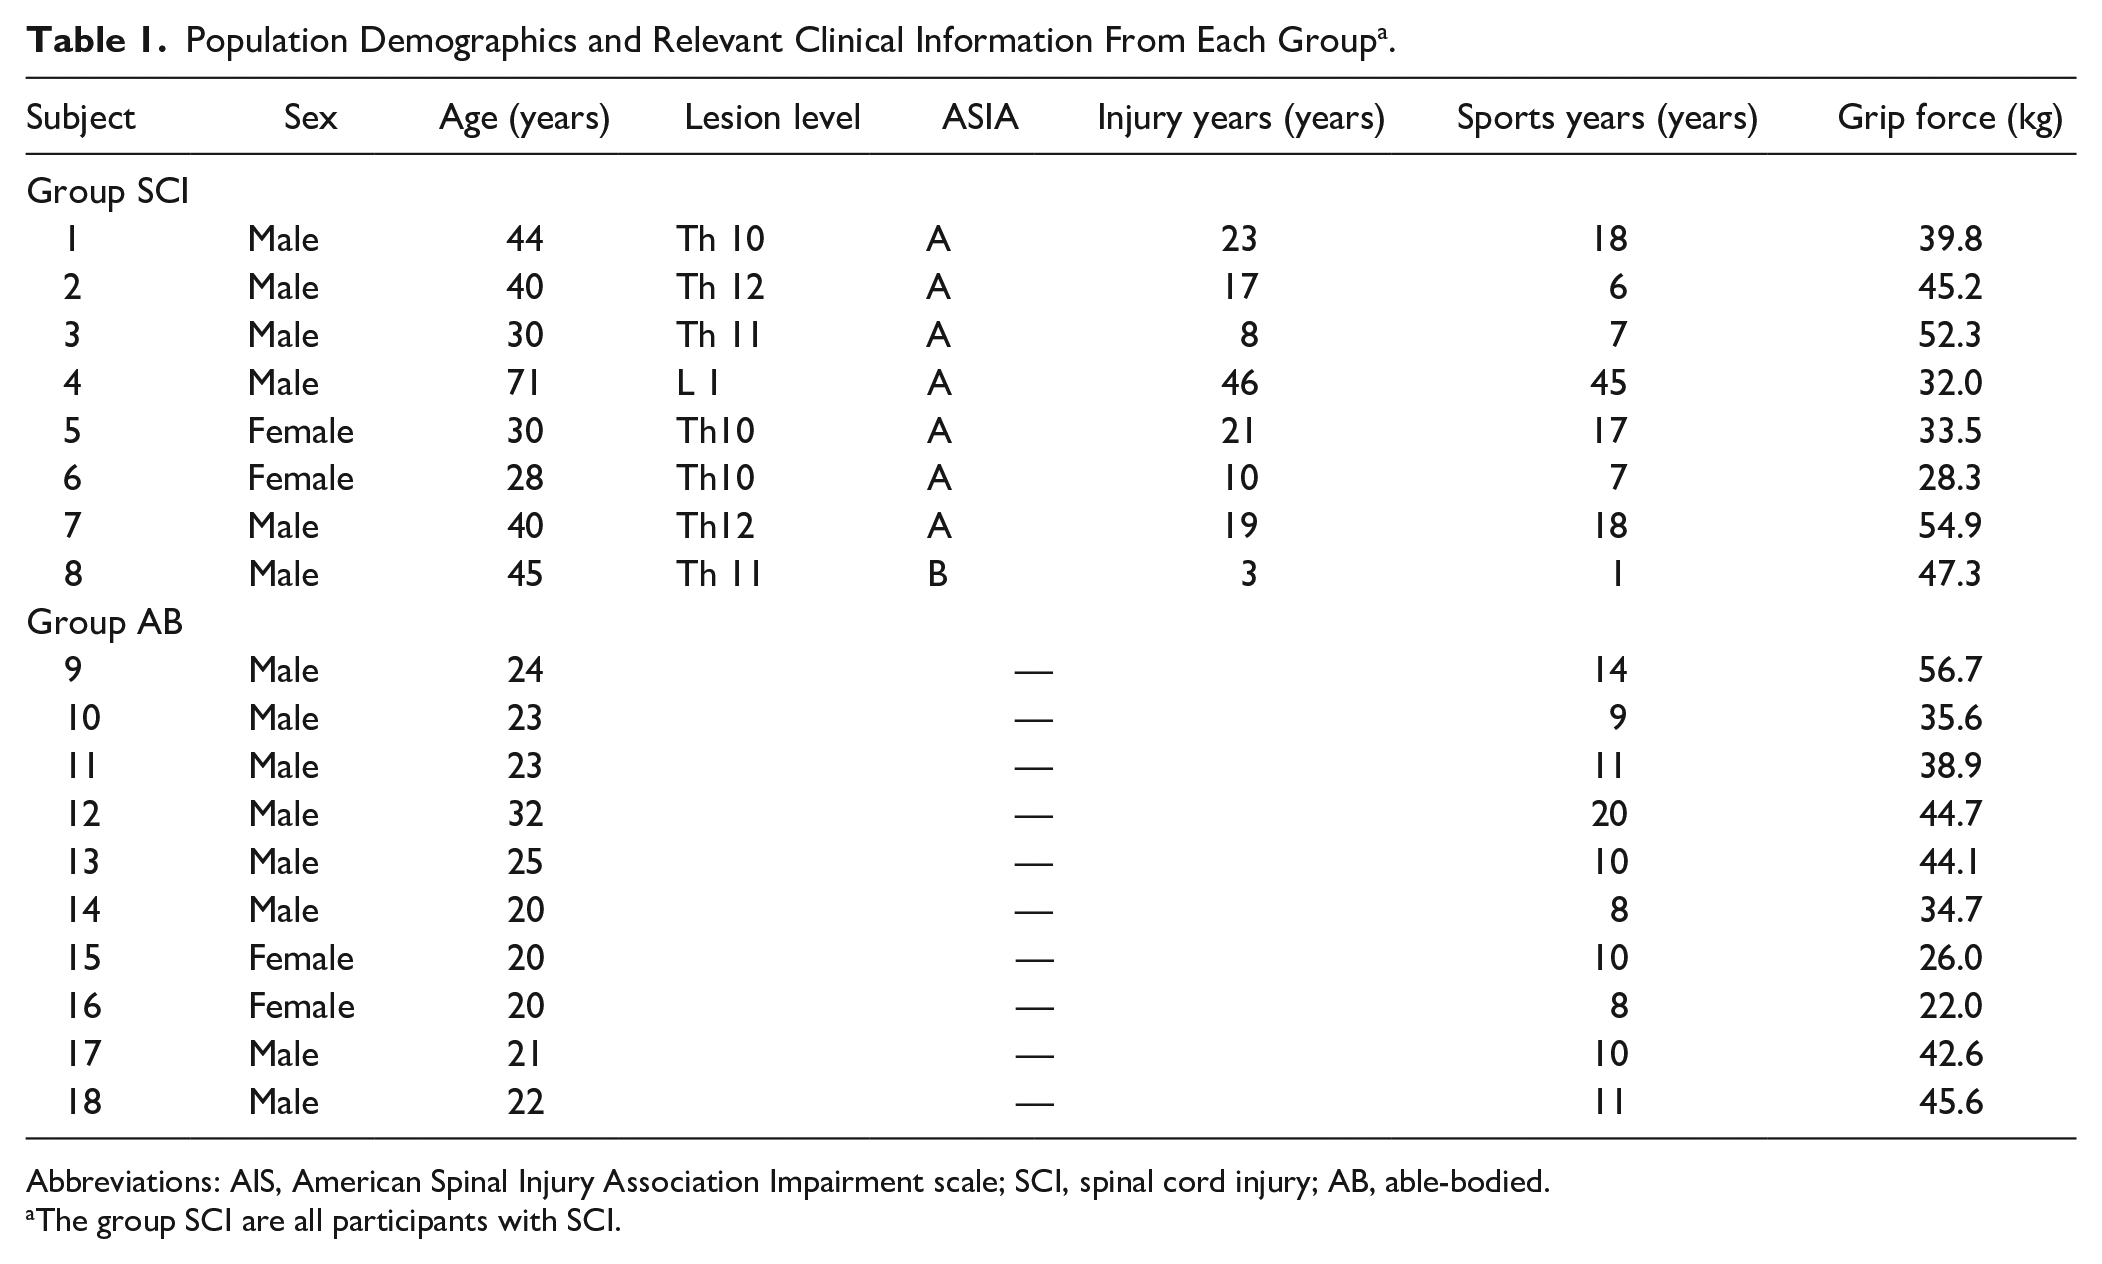
Abbreviations: AIS, American Spinal Injury Association Impairment scale; SCI, spinal cord injury; AB, able-bodied.
The group SCI are all participants with SCI.
Experimental Procedures
Force control tasks during task fMRI, resting-state fMRI, and T1W structural images were assessed on the same day. Prior to the MRI measurements, the participants filled out questionnaires pertaining to their medical history (all past diseases) and the date of injury. Furthermore, routine sports participation years (with sports performed more than once per week) for each subject were recorded (Table 1). Additionally, a physiotherapist evaluated the patients using the ASIA to assess injury level and severity (Table 1). Before entering the MRI scanner, the subjects performed a practice session of the hand grip force control task to become familiar with the task outside of the MRI scanner. During the practice session, participants were seated in front of a display, with both arms flexed to 70° at the elbow, with a force transducer held in the right hand. First, the maximal voluntary contractions (MVCs) of each participant were measured using a grip force transducer (FG-1002FA; Uchida Electronics). Next, horizontal lines indicating the 3 target levels (10%, 20%, and 30% of the maximum voluntary force) were set on the monitor. Participants were instructed to match their force as accurately as possible to the target line shown on the front monitor for 20 seconds. Two practice trials were conducted at each target level. After the practice session, participants laid on their backs in the MRI gantry and gripped the force sensor with their right hand. The 3 target levels were set (10%, 20%, and 30% of the MVC), and participants were instructed to perform the same force control task as in the practice trial over 3 fMRI scan sessions (Figure 1A). Each session included a 10-second dummy scan before the trial, followed by alternating 20-second periods of rest and task performance. Each session included 7 rest periods and 6 task periods (2 trials at each of the 3 target levels). During the tasks, T2*-weighted (T2*w) images were collected using a 3.0-T MRI scanner (MAGNETOM Prisma; Siemens), and force signals were digitized at 1000 samples/second using an analog-to-digital (A/D) converter (Powerlab/16SP; AD Instruments) and stored on a computer.
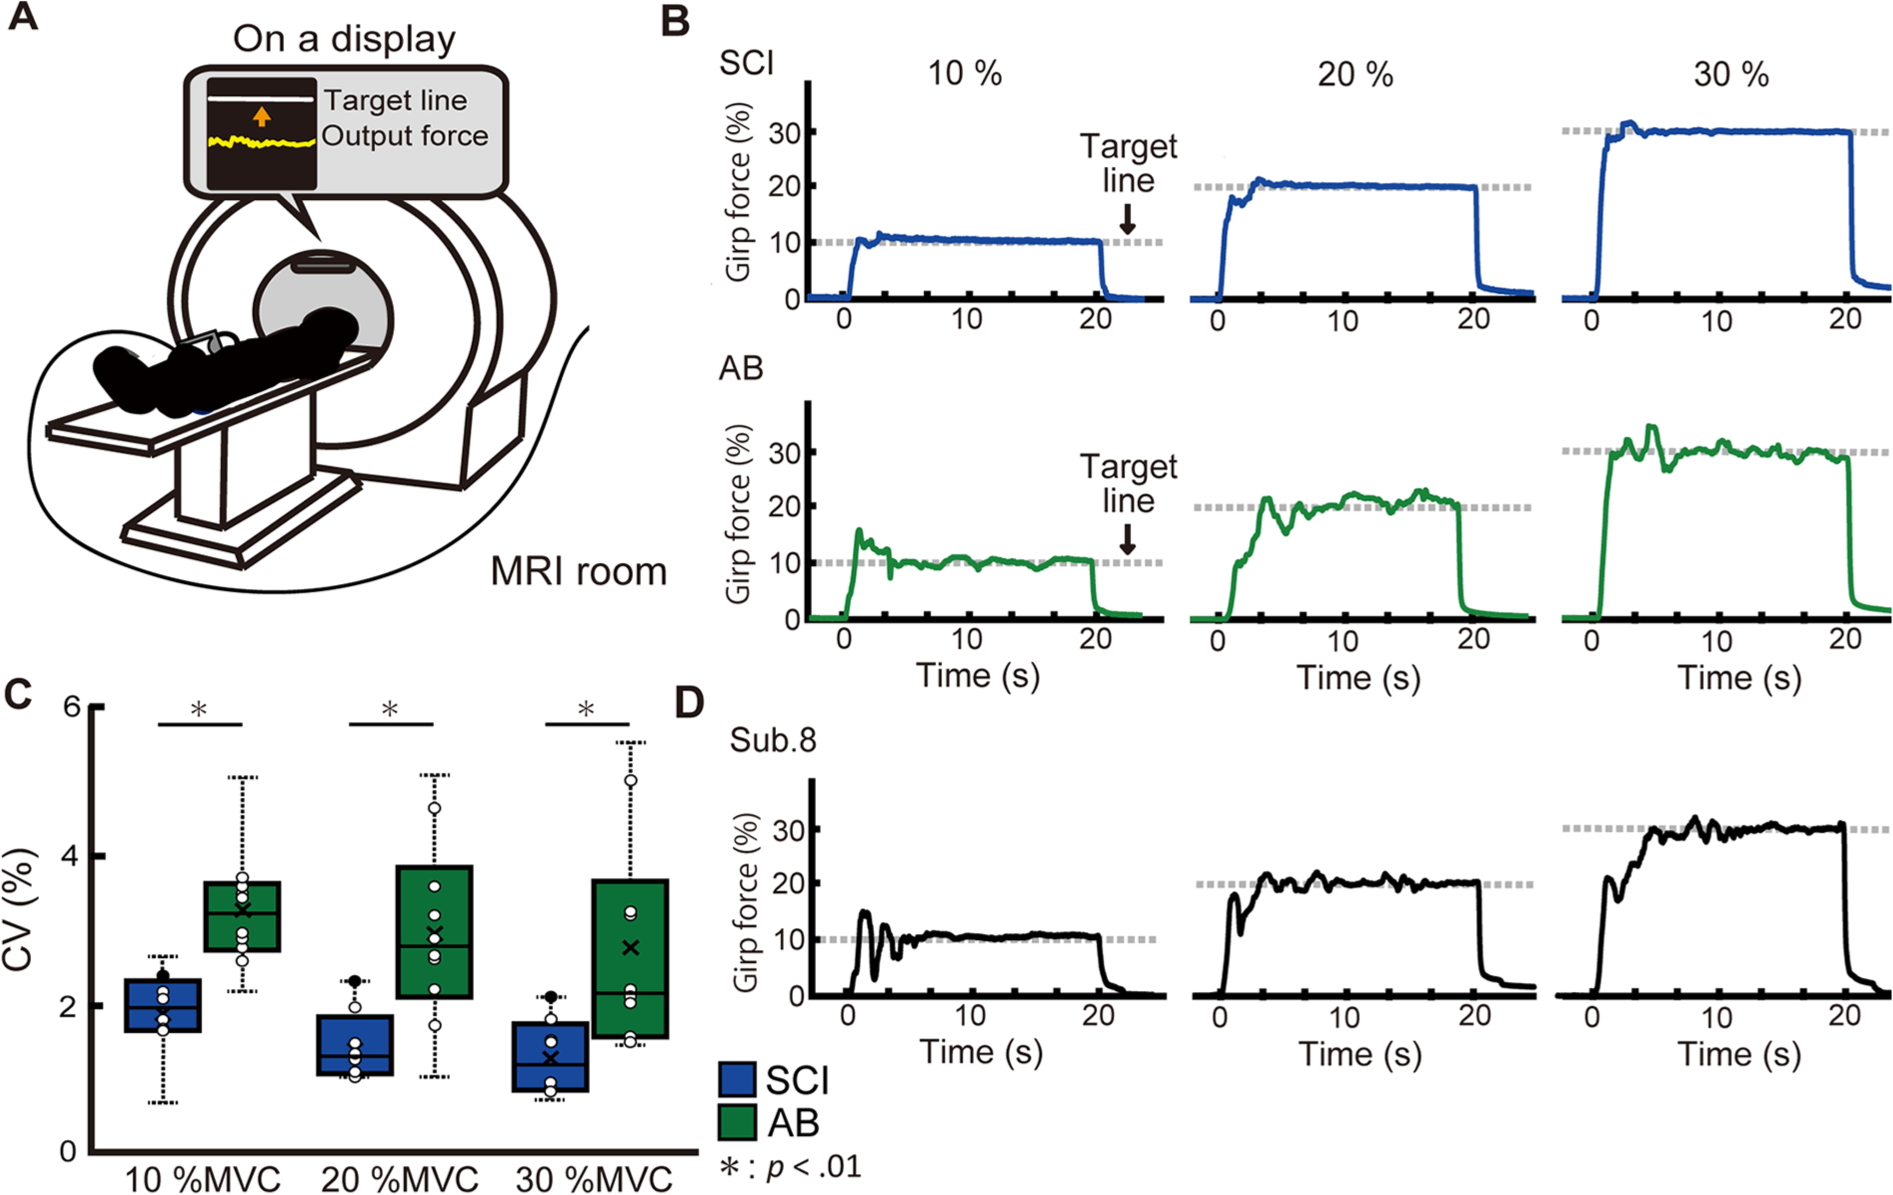
(A) Experimental setup. The participants laid on their backs in the MRI gantry and gripped the force sensor (FG-1002FA, Uchida Electronics) with their right hand. After the participant laid down, the elbow joint angle was fixed at 5° flexion, the forearm was placed in a neutral position. Participants were instructed to gradually increase force exertion and to sustain the force line (bottom line on the display) around the target line (the line above) as steadily as possible for 20 seconds. (B) Typical waveforms of force signal. The typical waveforms are shown from representative subjects in both the SCI (upper) and AB (lower) groups. The waveforms of SCI subjects showed little fluctuation and maintained greater stability compared with those of the AB subjects. (C) Box-and-whisker plot of the force steadiness (CV) of both groups at all target levels. Boxes represent the 25th and 75th percentiles of the CV. The median and mean values are indicated by a horizontal bar and cross mark, respectively. The black dashed line shows the range of total data used in the analysis (SCI; blue bar, AB; green bar). All CV data points are plotted in white circle while the data points of Sub.8, who had incomplete lower limb paralysis, are shown in black circle. (D) Representative waveforms of Sub.8 at each target level. SCI, spinal cord injury; AB, able-bodied; CV, coefficient of variation; MVC, maximum voluntary contraction.
After the task fMRI measurement, resting-state fMRI data were acquired using an echo-planar imaging (EPI) sequence in contiguous axial planes. During resting-state fMRI, all participants were instructed to relax with their eyes open and look at a black cross mark on the screen without moving. The resting-state fMRI session lasted 488 seconds, and high-resolution T1w structural images were acquired.
Scanning Procedure
Task fMRI data were acquired using a 3.0-T MRI scanner with a 64-channel head coil. Functional T2w echo-planar images reflecting the BOLD signal were collected using the same coil, with the following parameters: repetition time (TR) = 2000 ms, echo time (TE) = 25 ms, flip angle = 90°, field of view (FOV) = 192 mm, 39 contiguous axial slices acquired in interleaved order, thickness = 3.0 mm, in-plane resolution: 3.0 × 3.0 mm, bandwidth = 1776 Hz/pixel. Image acquisition parameters were chosen by referring to similar previous studies. 23 Siemens auto-align was run at the start of each session. Resting-state fMRI data were acquired using the following parameters: TR = 2000 ms, TE = 25 ms, flip angle = 90°, FOV = 192 mm, 39 contiguous axial slices acquired in interleaved order, thickness = 3.0 mm, in-plane resolution: 3.0 × 3.0 mm. In total, 240 volumes were obtained. High-resolution T1w structural images were also acquired for structural analysis using a 3D magnetization-prepared rapid acquisition with gradient echo pulse sequence, with the following parameters: TR = 2000 ms, TE = 2.9 ms, flip angle = 9.0°, FOV = 256 mm, 176 contiguous axial slices, thickness = 1.0 mm, in-plane resolution: 1.0 × 1.0 mm.23,24
Task fMRI Data Analysis
For the fMRI analysis, DICOM image files were converted to NIFTI format prior to data analysis using statistical parametric mapping (SPM12; Wellcome Trust Center for Neuroimaging), implemented in MATLAB (R2017b; MathWorks Inc). The first 5 scans of each session were excluded from the analysis due to the unstable magnetic field. The remaining data were analyzed using SPM12 software. First, preprocessing was performed in the following order: (1) Realignment: excessive head movement was corrected using the realignment procedure by applying a threshold of 2 mm for translation and 2° for rotation. As no excessive movements were identified in any of the images, no scans were excluded. (2) Co-registration: the T1w structural scan and average EPI scan from each of the 3 fMRI sessions were aligned to superimpose the head position information. (3) Normalization: the structural scan was segmented, providing normalization parameters, which were used to normalize the EPI scans to the Montreal Neurological Institute (MNI) space (resized voxels: 3 × 3 × 3 mm). 25 (4) Smoothing: EPI scans were smoothed using a Gaussian kernel of 8 mm. 24 After preprocessing, single-participant (first-level) analyses were performed to depict the general features of brain activation in each participant and the number of activated voxels was calculated. The general linear model of the time course data obtained from each condition was used to estimate the amount of neural activation during each task.26,27 The head motion parameters obtained during the preprocessing stage were included as regressors in each session to minimize the effect of head motion artifacts. Next, regions of interest (ROIs) were set at the left precentral gyrus and postcentral gyrus using automated anatomical labeling, a toolbox for identifying anatomical locations on the MNI template. 28 The number of activated voxels and the brain signal intensity (β-contrast) of the most activated voxel in each target level of the ROIs were measured using SPM12 during the force control task; only clusters that surpassed a cluster-level threshold, corrected at a family wise error (FWE) of P < .05, were measured. The number of activated voxels and β-contrast did not follow a normal distribution in either group (P > .05 by the Shapiro-Wilk test); therefore, the nonparametric Mann-Whitney U test was used to analyze each target level.
To analyze the group effect (second level), a nonparametric permutation test was performed for group comparison using SPM{Z} for each subject. The following 2 contrasts were used: (1) emphasis on the force control task and (2) emphasis on the rest–force control task. The first contrast identified brain areas used during force control, while the second, defined as the deactivation analysis, identified brain areas in which activity declined during the task. In SPM12, the statistical methods and procedure used to detect significantly deactivated areas were the same as those used to identify significantly activated areas. Physiologically, deactivation results show decreased MRI signal intensity, based on BOLD contrast.29,30 The threshold of deactivation analysis was set to P < .001 (uncorrected) at the cluster level to ensure clear identification of differences between the groups.
Resting-State fMRI Analysis
The CONN functional connectivity toolbox (v18.b; https://www.nitrc.org/projects/conn) was used to analyze the seed-to-voxel connectivity relationships in individual subjects. All processes were conducted using standard CONN settings. First, preprocessing was conducted to remove noise, in accordance with the CONN default pipeline. Regressors corresponding to the 6 motion-correction parameters, as well as to their first temporal derivatives, global GM, white matter (WM), and cerebrospinal fluid (CSF), were also included to remove any motion-related variance. After preprocessing, seed-based analysis was conducted. CONN performs seed-based analysis by computing the temporal correlation between the BOLD signals from a given voxel and those from all other voxels in the brain. The seed ROI was set on the left prefrontal gyrus based on anatomical labels. After analysis of each subject, between-group analyses under 2 contrast conditions (SCI > AB and SCI < AB) were performed. Differences were considered significant if they passed an uncorrected statistical threshold of P < .001.
T1w Structural Image Analysis
SPM12 was used to calculate the GM volume of each subject and to conduct voxel-based morphometric (VBM) analysis. All processes were conducted using standard SPM12 settings. The T1w images were segmented for GM, WM, and CSF, based on the International Consortium of Brain Mapping (ICBM) template for East Asian brains. Subsequently, a normalization procedure was conducted, whereby GM images from each subject were registered to a standard MNI space to interpolate differences in the subjects’ brain shapes. In the final phase of preprocessing, an 8-mm full-width Gaussian kernel filter was used to smooth the normalized T1w structure images. In the T1w structural image analysis, whole-brain voxel-wise comparisons of GM between the SCI and AB groups under 2 contrast conditions (SCI > AB and SCI < AB) were conducted in SPM12 using general linear model analysis. Age, time since injury, and total intracranial volume were included in the calculation of volume as covariates of interest. We used an adjusted uncorrected P value of <.001 as the cutoff for statistical significance.
Behavioral Data Analysis
Before analyzing the force data, we conducted an independent t test to compare the mean MVC grip force between individuals with SCI and AB subjects. The significance level was set at .05.
The most stable 15 seconds of output force data were extracted to calculate the mean and standard deviation (SD) of the force. This 15-second window was determined as the period in which the force signal had the smallest SD in each trial. After extraction, force fluctuation was normalized to the force magnitude by computing the coefficient of variation (CV) as follows: CV = (SD/mean) × 100. In this manner, the magnitude of force fluctuation was assessed. 13 R v2.8.1 (R Foundation for Statistical Computing) was used to analyze the behavioral indices. The CV did not follow a normal distribution in either group (P > .05 by the Shapiro-Wilk test), and thus, the nonparametric Mann-Whitney U test was used to analyze each target level. The significance level was set at .05.
Results
Force Steadiness During the Force Control Task
To ensure that differences in MVC and sports years did not affect the results, a statistical test was conducted to compare MVC and sports years between patients with SCI and AB individuals, which found no significant difference between the groups (P < .05). With regard to the force control performance, Figure 1B shows typical waveforms of the force signals. The waveforms of the SCI group had higher stability than those of the AB group. The Mann-Whitney U test revealed that the CV was significantly lower in the SCI group than in the AB group at all levels (10%, P = .0003; 20%, P = .009; 30%, P = .009; peak voxel level). The representative waveforms of Sub.8, who did not have complete paralysis and had residual ankle sensation, are shown in Figure 1D to compare with other participants with complete paralysis.
Brain Activity During the Force Control Task
Figure 2A shows the whole brain activation pattern of each group at each target level, and Table 2 details the activated brain regions during the task. The major difference between the groups was the number of activated voxels in the left precentral gyrus, showing that activation of the M1 was smaller in SCI subjects than in AB subjects during the force control task (cluster-level FWE corrected at P < .05). Figure 2B shows the ROI analyses calculating the number of activated voxels in the sensorimotor cortex during the tasks. These analyses were performed to quantify activation in M1 and S1. The nonparametric Mann-Whitney U test revealed that the number of activated voxels in the M1 and S1 were significantly lower in the SCI group than in the AB group at all levels (10%: P = .01, r = 0.59; 20%: P = .03, r = 0.49; 30%: P = .04, r = 0.47; Figure 2B).
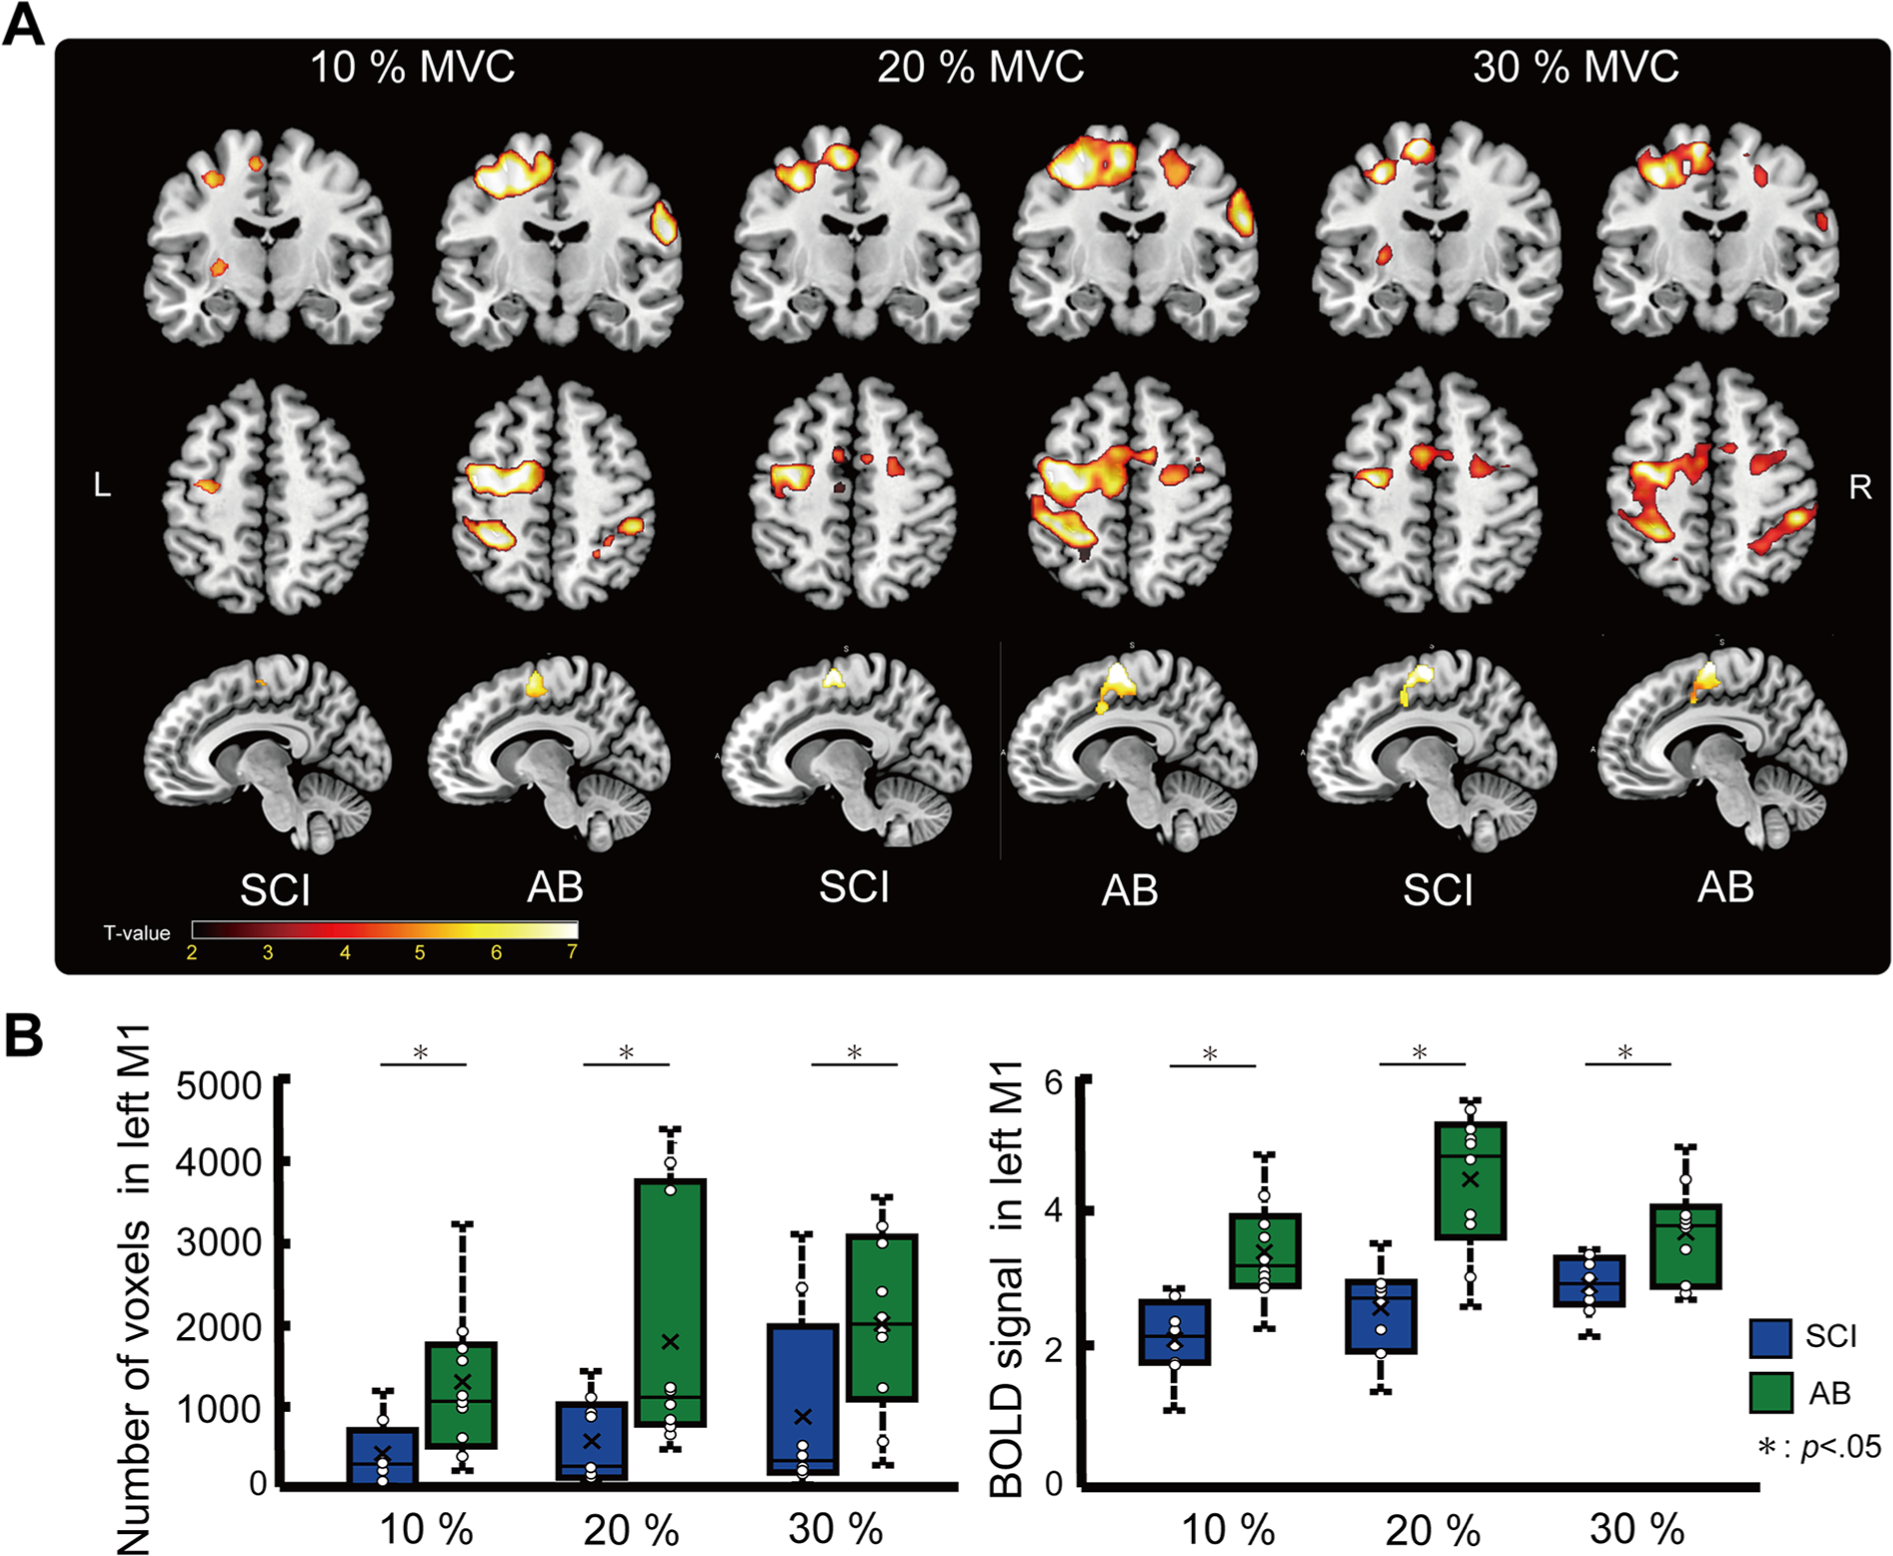
(A) Activated brain regions of each group during the force control task. Only clusters that surpassed a cluster-level threshold corrected at a family-wise error (FWE) of P < .05 were plotted. (B) Cluster size and brain signal intensity in the left M1 of each group. Box-and-whisker plot of the number of activated voxels and brain signal intensity during the force control task at 3 target forces (10%, 20%, and 30% MVC) compared between the 2 groups (SCI; blue bar, AB; green bar). Boxes represent the 25th and 75th percentiles of the cluster size and brain signal intensity. The median and mean values are indicated by a horizontal bar and cross mark, respectively. The black dashed line shows the range of total data used in the analysis (SCI; blue bar, AB; green bar). M1, primary motor cortex; SCI, spinal cord injury; AB, able-bodied; MVC, maximum voluntary contraction.
Summary of the Functional Magnetic Resonance Imaging (fMRI) Main Effect Area for Each Target Level and Group.
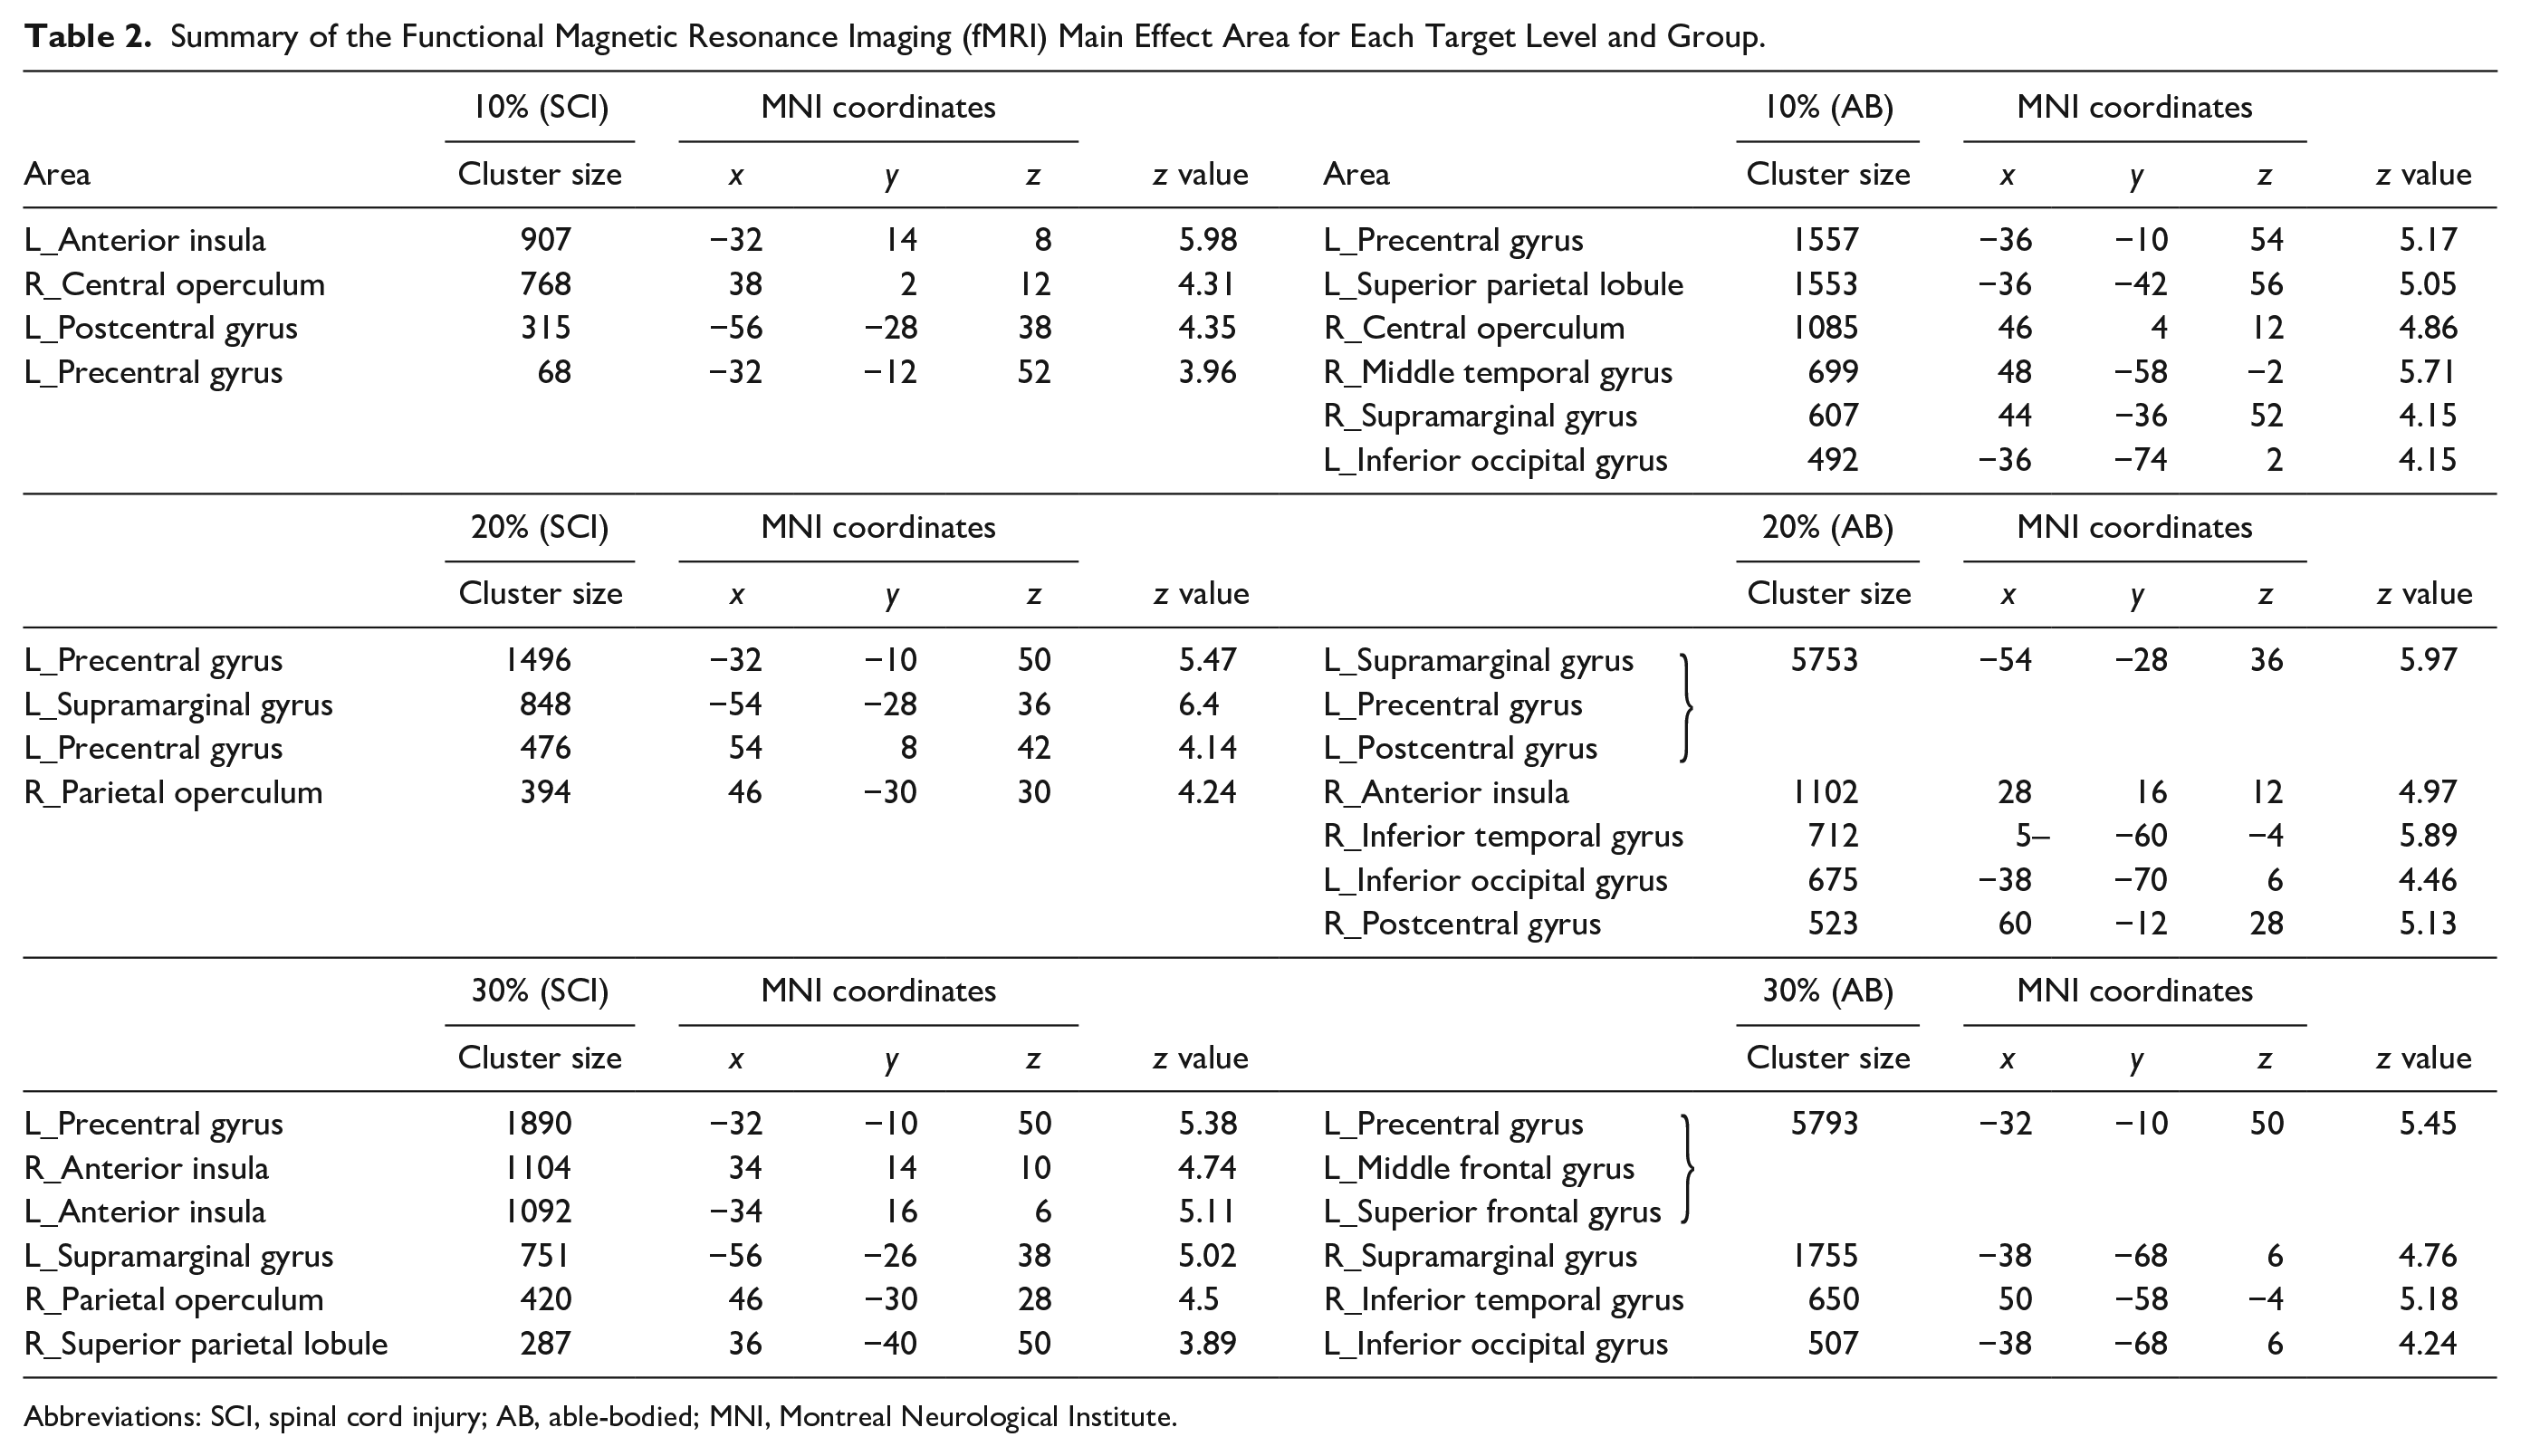
Abbreviations: SCI, spinal cord injury; AB, able-bodied; MNI, Montreal Neurological Institute.
Deactivation During the Force Control Task
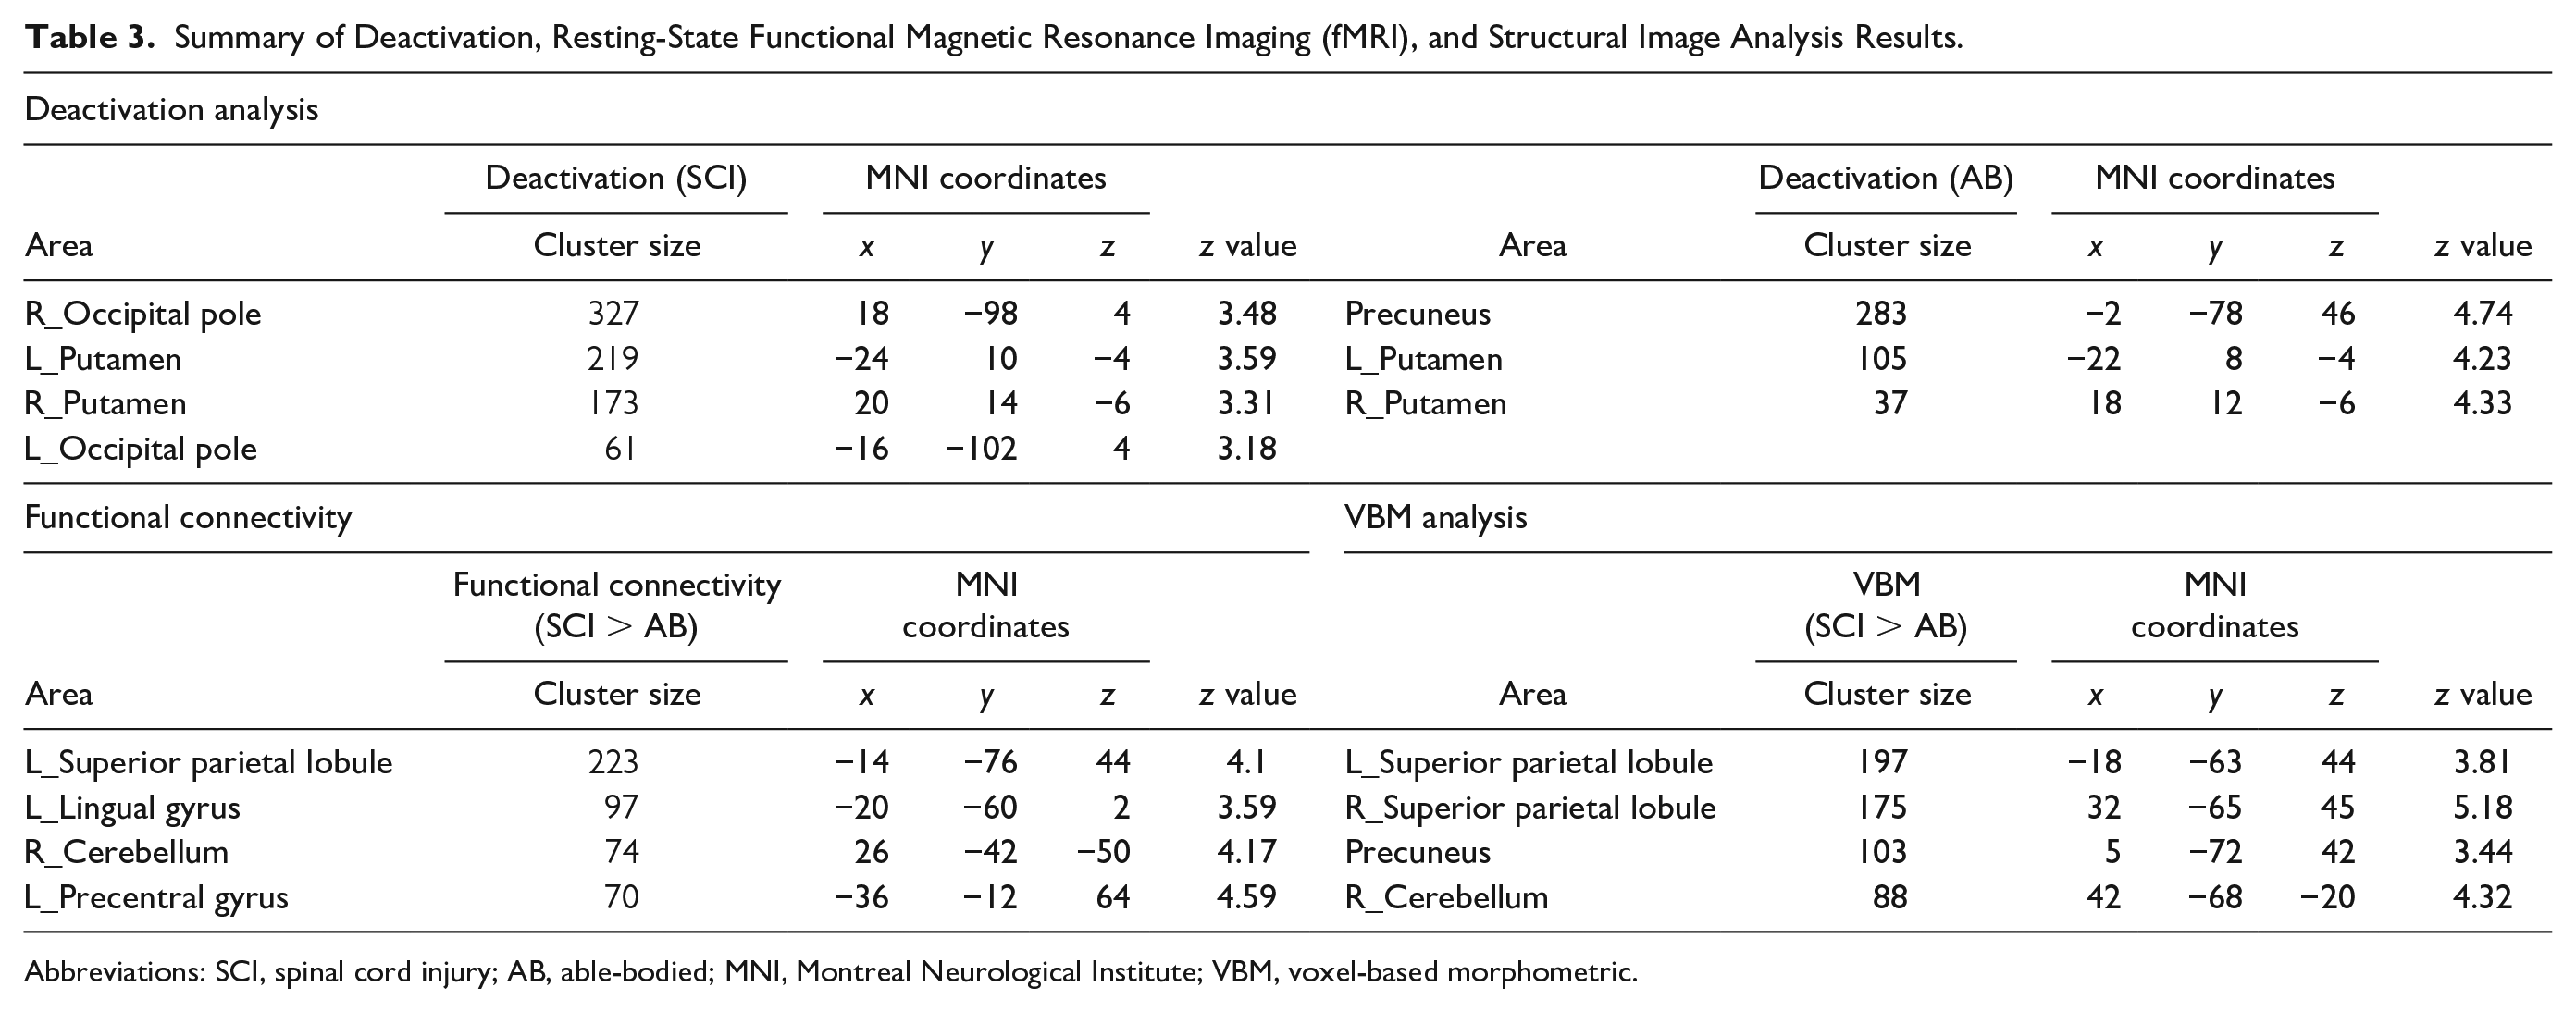
The deactivation analyses revealed a significant decrease in the BOLD contrast signal (Figure 3A and Table 3). The pattern of deactivation differed between the groups. The bilateral occipital pole and putamen were deactivated during the force control task in SCI subjects (P < .001, uncorrected); conversely, the occipital pole was not deactivated in AB subjects. Instead, the precuneus was the most deactivated area in AB subjects during this task (P < .001, uncorrected).
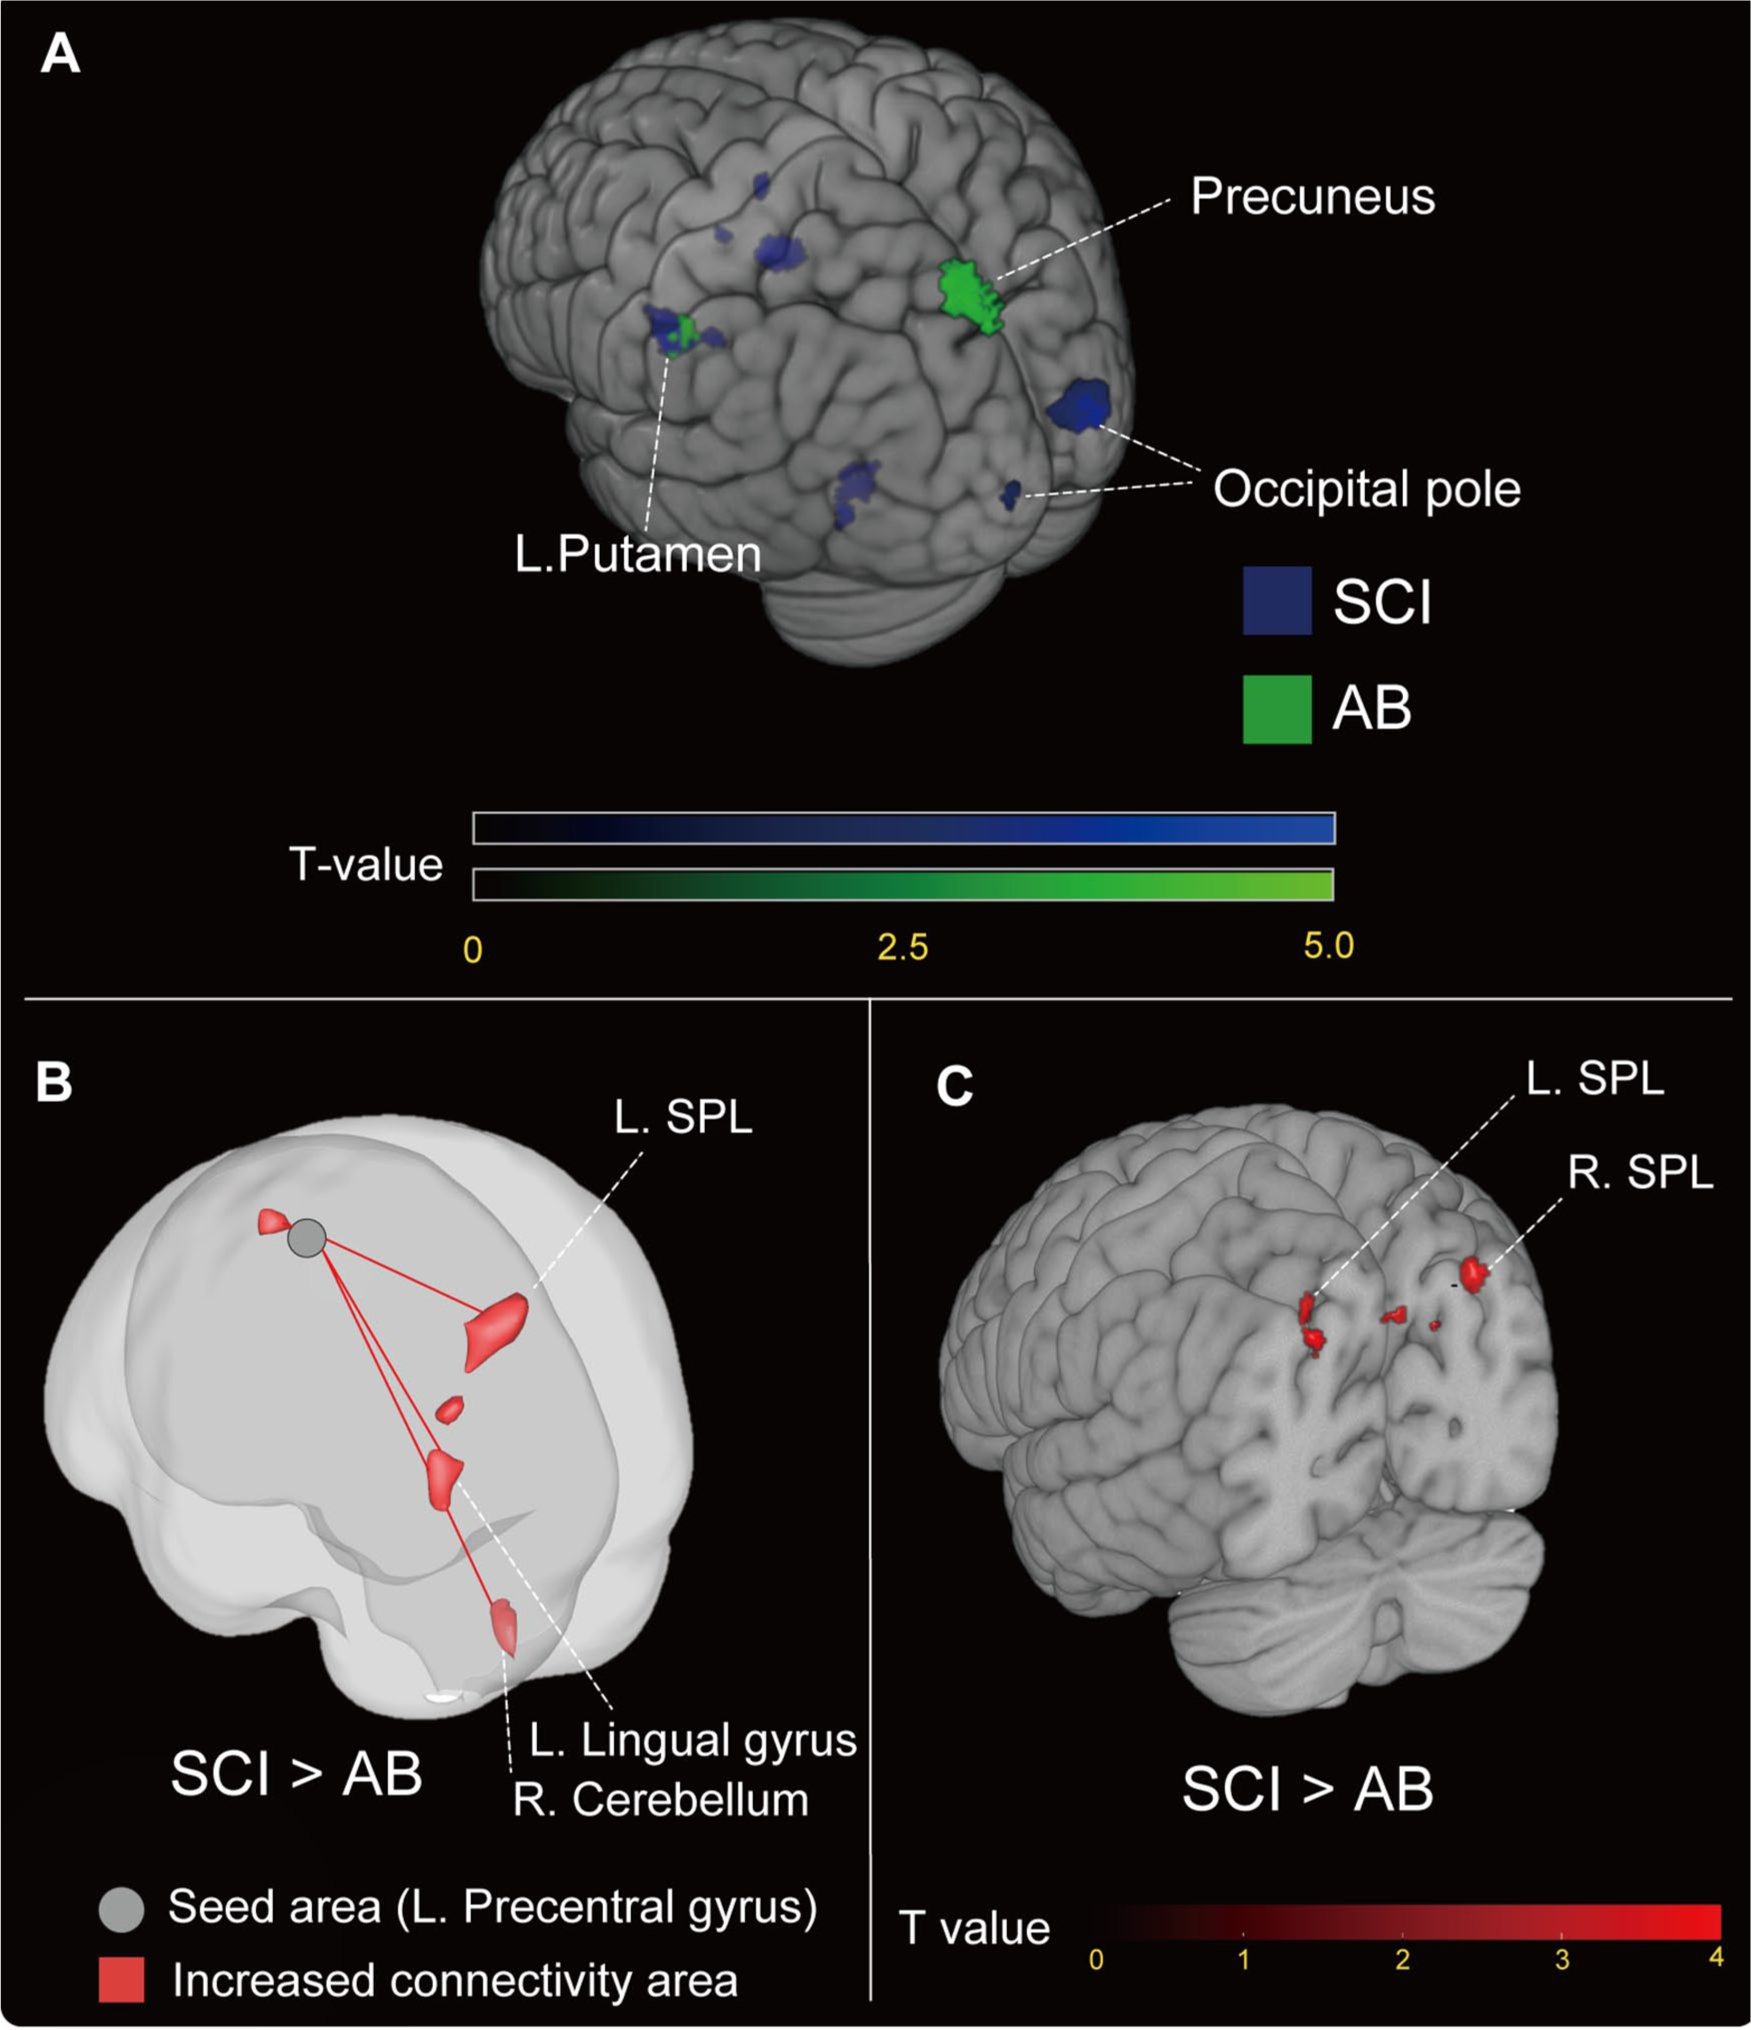
(A) Deactivated brain regions of each group during the force control task. The statistical t value was plotted on the Montreal Neurological Institute brain template. Only clusters that surpassed the statistical threshold (P < .001, uncorrected) are shown (SCI; blue plot, AB; green plot). SCI, spinal cord injury; AB, able-bodied. (B) Functional connectivity differences between SCI and AB subjects. The increased functional connectivity areas in SCI subjects relative to AB subjects were plotted (P < .001, uncorrected). (C) Gray matter volume differences between SCI and AB subjects. The increased gray matter volume areas in SCI subjects relative to AB subjects were plotted (P < .001, uncorrected). SCI, spinal cord injury; AB, able-bodied; SPL, superior parietal lobule.
Summary of Deactivation, Resting-State Functional Magnetic Resonance Imaging (fMRI), and Structural Image Analysis Results.
Abbreviations: SCI, spinal cord injury; AB, able-bodied; MNI, Montreal Neurological Institute; VBM, voxel-based morphometric.
Increased Functional Connectivity in SCI
In the functional connectivity analysis, the seed voxel was set on the left precentral gyrus, based on the default atlas set of the CONN toolboxes. A seed-to-ROI analysis was then conducted to clarify the network-level differences between the M1 and the whole brain. This seed region was defined according to the analysis design established before the experiment. The results demonstrated that, in subjects with SCI, the M1 showed greater functional connectivity and a low P value in the peak voxels with the left superior parietal lobule (SPL; P = .00002, uncorrected), left lingual gyrus (P = .00017, uncorrected), and right cerebellum (P = .00001, uncorrected) than in AB subjects (Figure 3B and Table 3). No regions which showed significantly stronger connectivity and satisfied the cutoff P value were found in the AB > SCI contrast.
Increased GM Volume in SCI
The VBM analysis is shown in Figure 3C and Table 3. The volumes of the left and right SPL were significantly larger in the SCI group than in the AB group (left SPL: P = .004; right SPL: P = .006, uncorrected). No regions which showed significantly larger volume and satisfied the cutoff P value were found in the AB > SCI contrast. These results were consistent with those obtained from the connectivity analysis, which showed significantly stronger connectivity between the left M1 and SPL in subjects with SCI.
Discussion
The main objective of this study was to reveal the neural basis of superior upper limb motor function in individuals with SCI. The force control task showed that force steadiness was higher in subjects with SCI than AB at all target levels. Furthermore, subjects with SCI showed less activation in the M1 than AB subjects during the task, as well as deactivation in the visual cortex. Subjects with SCI also showed stronger functional connectivity between the SPL and left M1, and increased GM volume in the bilateral SPL. These brain changes may contribute to the high force steadiness in SCI subjects.
Higher Force Steadiness in SCI Subjects
The finding that individuals with SCI demonstrated significantly higher force steadiness than AB subjects was consistent with our recent study, 12 in which we confirmed that the level of force steadiness in subjects with complete SCI was significantly higher than that in subjects with other lower limb disabilities who used wheelchairs in their daily lives and had incomplete lower limb paralysis. The difference between the 2 groups was whether or not their lower limbs were completely paralyzed. Therefore, we suggest that the greater force steadiness observed in subjects with complete SCI was not simply related to the higher rate of upper limb use after SCI, which would be a neural compensational change in response to the complete loss of the afferent signal from the lower limb. Consistent with our previous results, 12 Sub.8, who did not have complete paralysis, showed the worst CV in the SCI group (Figure 1C and D). It has previously been shown that the brain undergoes reorganization after a complete injury; Aguilar et al 32 revealed that deafferentation due to complete spinal cord injury can immediately change the state of the cortex in S1, including large brain networks. As the SPL receives direct anatomical projections from S1, 33 it could be subsequently reorganized to accompany S1 changes. Moreover, the cerebellum receives a copy of the efferent signals that sensorimotor cortical areas send to the spinal and brain stem motor neurons; it could also be reorganized according to S1 changes. Therefore, we assumed that complete sensory loss may play a major role in the reorganization of large brain networks and the development of superior upper limb motor function after complete SCI.
Neural Efficiency During the Force Control Task
In this study, although force output during the force control task was comparable between the subjects with SCI and AB individuals, the SCI group showed significantly less activation in the M1. This phenomenon is defined as neural efficiency and has been observed in professional musicians and elite athletes.24,31-33 Debarnot et al 34 suggested the following possible background mechanisms for neural efficiency: (1) Expertise can build internal models in the cerebellum through repeated exercises. Consequently, voluntary movements become automated and the amount of energy consumed is reduced; therefore, motor actions can be executed using fewer metabolic resources. (2) Expertise allows less energy to be used because the subject develops sensorimotor cortex networks and increased nerve conduction efficiency.24,34,35 This study demonstrated that SCI could lead to the same neural efficiency as individuals adapt to their daily lives. Notably, almost all the individuals with SCI in this study had complete afferent signal blocking. Complete afferent signal blocking could induce synaptic unmasking; therefore, it was assumed to be a trigger of the sensorimotor cortex development in individuals with SCI.36-38
Structural and Functional Reorganization in the SPL May Contribute to Higher Force Steadiness
In addition to neural efficiency in the left M1, subjects with SCI showed greater functional connectivity between the SPL, right cerebellum, and left M1, as well as increased GM volume in the bilateral SPL. The SPL is important for maintaining an internal representation of the body’s state. 39 Specifically, the SPL receives strong anatomical projections from the primary somatosensory area and projects to the frontal lobe. 40 It provides the neural basis by which information about joint positions and limb segment positions is integrated to determine where the arm is, or where a segment of the arm is. 41 Importantly, Wolpert et al 39 reported a force control test in a patient with an SPL lesion. The patient could not maintain his grip force despite having a normal somatosensory function. Thus, the SPL plays a key role in force control through its sensorimotor integration function. Furthermore, the internal representation and model function of the SPL and cerebellum may directly affect force control performance, because it is necessary to correctly maintain the upper limbs in a certain position during the task. Thus, increased GM volume and functional connectivity to the M1 may enhance the body schema of the upper limbs and contribute to greater force control performance in subjects with SCI. However, we did not extract group differences in the activation of the SPL and cerebellum during the task. This could be because the minimal BOLD signal shown in SCI would indicate the development of the motor-related nervous system (ie, neural efficiency). Therefore, we consider that the lack of detection of an activation difference is due to the development and optimization of neural pathways in the SPL-M1 and cerebellum-M1 network,31-34 which allowed them to more precisely control the upper limbs with a minimal BOLD signal. However, this is speculation; future detailed studies will be necessary to clarify this conclusion.
The results of our deactivation analysis support these interpretations. In this analysis, the greatest difference between the 2 groups was found in the visual cortex, which was only deactivated during the force control task in subjects with SCI. In the force control task, subjects had to look at the instructions at all times, including during the rest period. Therefore, subjects with SCI may have depended on visual feedback during the rest period, but after starting the force control task, their relative dependence on somatosensory feedback increased. This full use of somatosensory input and integration may have caused deactivation in the visual cortex. To support this assumption, Halder et al 42 proposed that deactivation in visual-related areas during force control indicates neural development related to visual feedback processing. In this study, subjects with SCI may have improved their force control steadiness by developing a feedback processing network center in the SPL, thus reducing their dependency on visual information. Therefore, functional deactivation and neural efficiency are suggested to be neural indicators of plastic changes in the brain resulting from motor expertise.31-33,43,44
In summary, neural efficiency and deactivation in subjects with SCI are the same as those in healthy experts. However, the neural basis of these phenomena in subjects with SCI is not only adaptation of the sensorimotor cortex, but also of the SPL and cerebellum, which are the areas responsible for internal representation of the body’s state. These adaptive mechanisms of the brain in response to the complete loss of afferent signals from the lower limb and efferent signals from the brain could have applications in the fields of neurorehabilitation, such as brain-targeted interventions for improvement of intact limb functions after SCI.
Limitations of the Study
Although we recruited individuals with chronic-phase SCI, it is possible that an improvement in motor function by rehabilitation would have led to the observed brain reorganization. Furthermore, the adaptations in motor and brain function may depend on the level of rehabilitation and daily activity, which would be different for each individual. A future longitudinal study would be necessary to specifically identify the relationship between the improvement of force control and actual activity levels in daily life.
Second, there was a large age difference between the 2 groups. To estimate the effect of age, we conducted a correlation analysis, which showed no significant correlation between behavior parameters, brain activity, and age. Moreover, although force control ability and brain function are generally superior in younger individuals, 13 the results of the SCI group were better than those of the younger AB group. Therefore, we compared the older SCI group with the younger AB group, as in our previous study. 12 However, careful interpretation of our results considering the age difference is required.
Finally, the sample size in the present study was relatively small. Therefore, we had to report some results using uncorrected P values in the analysis of deactivation, functional connectivity, or VBM, which were conducted to explore the specificity of the SCI-related changes. As such, the statistical robustness of these results was not completely confirmed. We reported some results using uncorrected P values as these findings were considered novel and may have valuable clinical applications. However, more extensive research will be necessary to guarantee the statistical validity of these results. Therefore, a careful interpretation of our results is needed.
Footnotes
Acknowledgements
We would like to thank the subjects for their participation in this experiment and Advanced Bioimaging Support (ABIS) for their advice on MRI data acquisition and analysis techniques.
Declaration of Conflicting Interests
The author(s) declared no potential conflicts of interest with respect to the research, authorship, and/or publication of this article.
Funding
The author(s) disclosed receipt of the following financial support for the research, authorship, and/or publication of this article: This work was supported by the Japan Society for the Promotion of Science Grants-in-Aid for Scientific Research (KAKENHI; Grant Numbers 18H04082 and 19J21542) and the Japanese Physical Therapy Association (JPTA; Grant Number H30-A50).