
Abstract
Background. Spinal cord injury (SCI) results in impaired function, and ankle joint spasticity is a common secondary complication. Different interventions have been trialed with variable results. Objective. We investigated the effects of pharmacological and physical (locomotor training) interventions on function in people living with incomplete motor function loss caused by SCI and used different analytical techniques to understand whether functional levels affect recovery with different interventions. Methods. Participants with an incomplete SCI were assigned to 3 groups: no intervention, Lokomat, or tizanidine. Outcome measures were the 10-m walk test, 6-minute walk test, and the Timed Up and Go. Participants were classified in 2 ways: (1) based on achieving an improvement above the minimally important difference (MID) and (2) using growth mixture modeling (GMM). Functional levels of participants who achieved the MID were compared and random coefficient regression (RCR) was used to assess recovery in GMM classes. Results. Overall, walking speed and endurance improved, with no difference between interventions. Only a small number of participants achieved the MID. Both MID and GMM-RCR analyses revealed that tizanidine improved endurance in high-functioning participants. GMM-RCR classification also showed that speed and mobility improved after locomotor training. Conclusions. Improvements in function were achieved in a limited number of people with SCI. Using the MID and GMM techniques, differences in responses to interventions between high-and low-functioning participants could be identified. These techniques may, therefore, have potential to be used for characterizing therapeutic effects resulting from different interventions.
Keywords
Introduction
Rehabilitation for people who are living with spinal cord injury (SCI) is focused on optimizing function. One secondary consequence of SCI is neuromuscular abnormalities, resulting in hypertonia or spasticity of muscle groups and has been noted as the main self-reported secondary complication after SCI. 1 Spasticity commonly affects the muscles surrounding the ankle joint, which have important roles during functional tasks. 2 During gait, for example, the gastrocnemius, an ankle extensor, is important for propulsion during the stance phase and the tibialis anterior for foot clearance during the swing phase. In people living with SCI, there is controversy regarding the relationship between hypertonia and gait function. Severe extensor spasticity of gastrocnemius, blocking flexion movements, can impede locomotor ability, and some studies have demonstrated that increased hypertonia relates to impaired function.3-5 Others, however, have demonstrated no functional improvements with reduced hypertonia, based on clinical observations.6,7
Tizanidine, an antispasticity medication, has been shown to reduce hypertonia in individuals with SCI.8-11 As an α2 noradrenergic agonist, it is thought to reduce hypertonia through depression of dorsal horn interneuron excitability. 12 Although studies commonly report the effects of such antispasticity medications on muscle spasticity, assessed by clinical scores8,13 or electromyographic activity,13,14 they rarely report effects on the patient’s functional ability. 15 The few studies that did report more functional measures demonstrated that tizanidine substantially reduced reflex mechanical responses in individuals with SCI 16 and facilitated locomotor capacity in spinalized cats, 17 whereas one study reported that it had no effect on muscle strength or activities of daily living in individuals with SCI. 8
An alternative intervention that became popular in SCI rehabilitation to improve function is locomotor treadmill training (LTT). LTT, incorporating body-weight-supported training and robotic-assistive step training, provides gait assistance and body weight support to a patient on a motorized treadmill, which aims to improve locomotor function. 18 LTT is thought to improve function through the responsiveness of central pattern generators to afferent stimuli noted in mammalian quadrupeds.18,19 In people with chronic SCI, studies have reported that LTT training improves overground walking speed20-24 and endurance, 22 muscle strength,23,25,26 corticospinal tract function, 25 postural alignment, 20 coordination of electromyographic activity, 20 and subjective well-being.23,27 It has also been reported to reduce abnormal neuromuscular activity (spasticity), measured by clinical scores 28 or electromyographic activity, 29 although these changes did not correlate with functional improvements. 28 Some authors, however, believe that the evidence for LTT is limited 30 because studies often omit control and alternative intervention groups, and those that do include alternative interventions have found similar improvements from conventional physical therapy and overgound walking training.23,24,31 Similar findings have been reported from randomized trials in people with acute SCI. 32
Overall, the observed extents and rates of improvement in functional performance from interventions after chronic incomplete SCI tend to be variable. 30 In addition, the population of people living long term with incomplete SCI is heterogeneous in terms of their functional capacities. The combination of these factors results in commonly used group-averaging techniques showing only small overall improvements, 30 which may mask important data. Some individuals with SCI may respond to specific treatments, whereas others do not; identifying those who do respond and understanding how they differ from nonresponders is key. For example, one study reported that a greater proportion of more-impaired participants with SCI, classified by lower-extremity motor scores (LEMS), improved walking speed after locomotor training when compared with less-impaired participants. 24 However, other studies have reported greater improvements in walking speed with LTT in participants with greater baseline muscle strength 33 or in those who have the ability to ambulate prior to the intervention. 34 Determining whether individuals living with SCI respond to interventions differently, according to their baseline functional level, may allow us to recommend optimal interventions on a case-by-case basis.
To assess the individuals who did or did not respond to the intervention, it is necessary to first define the amount of change required for any improvement to be considered real (ie, greater than the change caused by variation or measurement error) and second to define the amount of change for the improvement to be considered “clinically” meaningful. That is, a small but statistically significant improvement may be irrelevant clinically if it does not affect the individual’s quality of life, particularly if the intervention is substantially costly in terms of time, effort, and/or side effects for the individual. Previously, Beckerman et al 35 proposed the small real difference (SRD) approach, which refers to the smallest possible value required to be considered a true difference; thus, the minimally important clinical difference must always be greater than the SRD for a measurement technique to be valid. 35 Subsequently, Lam et al 36 proposed SRDs for a number of outcome measures commonly used in the population of individuals living with SCI. Although these values may be useful in assessing those people who responded to treatment, it should be acknowledged that they were based on a small number of heterogeneous individuals with incomplete SCI and only account for the variability in the measurement technique rather than a change that may be considered clinically relevant or regarded as a minimal important difference (MID) to the individual.
An alternative method of classifying responders from nonresponders is growth mixture modeling (GMM). GMM is used widely in psychological and educational research to capture heterogeneity in developmental pathways and has recently been applied to recovery patterns in rehabilitation research. The technique attempts to classify participants into latent classes according to their baseline scores and recovery trends. This may be useful in rehabilitation by accounting for some of the inherent variability in individuals and individual responses, by considering each individual’s baseline function as well as their recovery trend in response to the intervention. In the future, rehabilitation practitioners may use this information to predict, with a known confidence level, whether or not a new patient will respond positively to an intervention based on their baseline clinical scores. This technique has been used successfully to classify stroke survivors based on their recovery patterns. 37
The aims of the study were to determine and compare the effects of 2 different interventions, LTT and tizanidine, on gait impairments, using commonly used group-averaging techniques, as well as the MID and GMM techniques. We hypothesized that differences in responses to interventions would not be detected by analysis of variance (ANOVA), and both MID and GMM techniques would identify different responses to the interventions in high-compared with low-functioning participants, assessed by Walking Index for Spinal Cord Injury II (WISCI II) scores and baseline outcome measures.
Methodology
Participants
Participants with either cervical or thoracic incomplete SCI as a result of trauma were recruited from the outpatient service at the Rehabilitation Institute of Chicago. All participants provided written informed consent, and the study had ethical approval from the Northwestern University Institutional Review Board. Inclusion criteria were the following: age 18 to 50 years, motor incomplete SCI (ASIA impairment scale classification C or D) with level of injury above T10 and >12 months postinjury, able to ambulate, medical clearance to participate, evidence of clinical spasticity in the ankle joint (Modified Ashworth Score [MAS] ≥1), and lower-limb passive range of motion within functional limits for ambulation. Exclusion criteria were sitting tolerance <2 hours, existing infection, severe cardiovascular or pulmonary disease, concomitant neurological injury, history of fractures post-SCI, and known orthopedic or peripheral nerve injury in the lower extremities. The WISCI II assessment was initially carried out to assess the participants’ walking ability (level of functional impairment). Participants were then randomized into 1 of 3 intervention groups: no intervention (control; n = 29), LTT (Lok; n = 27), and tizanidine (Tiz; n = 27). Participant characteristics are provided in Table 1.
Mean (SD) Characteristics of Participants in the 3 Groups.
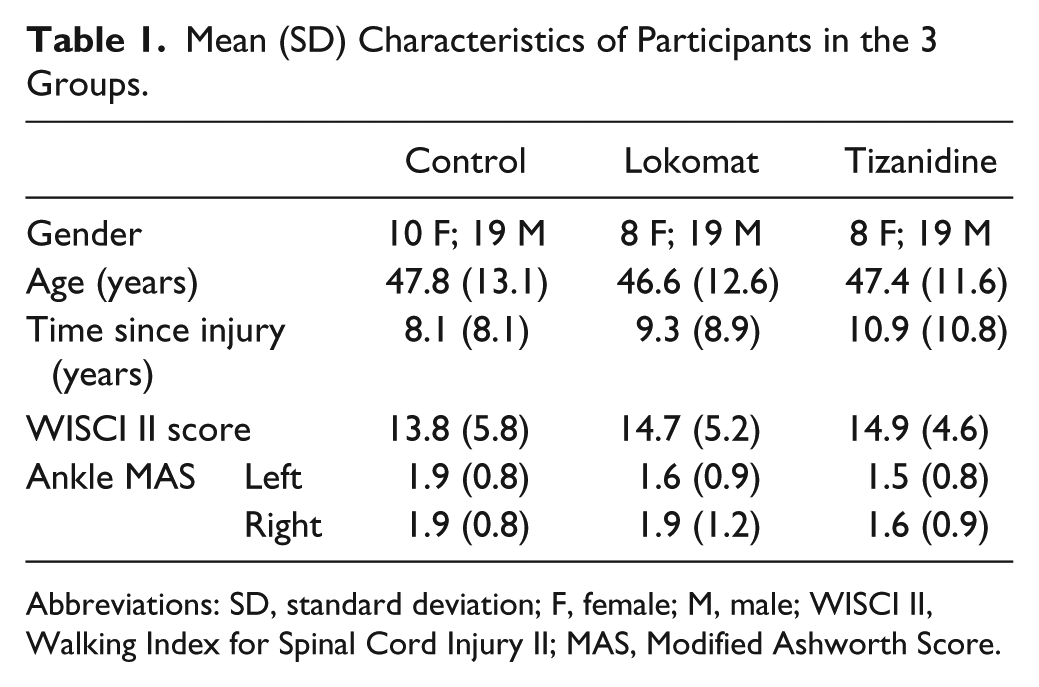
Abbreviations: SD, standard deviation; F, female; M, male; WISCI II, Walking Index for Spinal Cord Injury II; MAS, Modified Ashworth Score.
Interventions
Interventions were given for 4 weeks in the Lok and Tiz groups. Control participants received no intervention. Participants taking muscle relaxant medications prior to enrolling on the study were tapered from their medication prior to the start of the study. Participants were requested not to alter their current medications otherwise, where possible, and to inform us of any changes in their medications during the intervention.
For the Lok group, locomotor training was provided using a robot-assisted locomotor training device (Lokomat, Hocoma AG, Switzerland). This device provides body-weight-supported gait assistance; the individual is suspended in a harness over a motorized treadmill while the frame of the robot, attached by straps to the outside of the lower limbs, moves the limbs in a natural walking pattern.
Training was provided 3 times per week; each session lasted ≤1 hour, with 30 to 45 minutes of training. Treadmill speed, body-weight support, and robotic guidance force were determined by the physical therapist, based on tolerance and comfort of the participant. Generally, however, reducing guidance force was prioritized to promote voluntary drive to muscles and to minimize passive training. Body-weight support was configured to maximize lower-extremity loading without producing excessive knee flexion during the stance phase or allowing toe drag during the swing phase. Participants were instructed to “walk with the robot” to ensure that the lower-extremity movements were consistent with the Lokomat stepping pattern. They were also instructed to pay attention to their ankle movements during the gait cycle—that is, to focus on planting the heel of their foot at heel strike and to lift their toes during the swing phase. A mirror placed in front of the participants provided visual feedback.
For the Tiz group, 0.03 mg/kg of tizanidine was administered 4 times a day for 4 weeks. This dosage represents a useful compromise, in that it usually shows efficacy 16 but does not cause overwhelming side effects. In the first week, administration of the drug was progressively increased until the full dosage was received on day 7, and the full dosage was then administered for a subsequent 4-week period.
Outcome Measures
Outcomes were measured at 4 time points: baseline and 1, 2, and 4 weeks into the intervention (or after baseline for controls). For the Tiz group, outcome measures were taken at baseline and 1, 2, and 4 weeks after the participant’s tizanidine had been regulated.
Functional measures included the following: (1) the 10-m walk test (10MWT), whereby participants are instructed to walk 10 m as quickly and safely as possible, and time is measured38-40; (2) the 6-minute walk test (6MWT), whereby participants are instructed to walk for 6 minutes and the distance covered is measured 40 ; and (3) the Timed Up and Go (TUG), whereby participants are instructed to stand up from a chair with arms, walk 3 m, turn, return to the chair, and sit down, and time is measured. 40
Data Analysis
Statistical tests were carried out using SPSS (SPPS v21, IBM Corp, USA), and P < .05 was considered significant. One-way ANOVA was used to assess differences in patient age, time since injury, and functional level between the 3 intervention groups.
Two-way mixed design ANOVAs were used to identify significant changes resulting from time point (within-subject) and group (between-subject) for the 3 groups.
Data were classified for each task using 2 methods:
According to whether or not they achieved the MID for each test: The MID was defined using control group data; this was calculated as proposed by Beckerman et al 35 (1.96 × √2 × standard error of the mean). Participants who achieved a change from baseline equal to or greater than the MID for that test, after 4 weeks of training, were classified as “MID achieved” and those who had a change from baseline less than the MID for that test were classified as “MID not achieved.” Differences in MAS and WISCI II scores among the 3 intervention groups for those who did achieve the MID for each test were assessed using 1-way ANOVAs. Within each group, differences in WISCI II scores between those who did and did not achieve the MID for each test were assessed using independent-sample t tests.
GMM can be used to identify subpopulations within a group that demonstrate similar longitudinal change or growth (for a basic review, see Ram and Grimm 41 ). The model assumes that the population can be separated into a finite number of classes that are similar, in a post hoc manner (ie, does not include a priori knowledge of how the data should be classified). The model estimates the probability that each individual should belong to each class and then classifies that individual into the class that they are most likely to belong to.
Using R software (R v2.15, R Systems, India), a given number of classes (2, 3, or 4) were generated by the model according to baseline data and recovery slope trends. For the recovery trend, we forced the model to define the pattern linearly, which can be represented by a single slope because this was adequate to describe the relationship. The model with the best fit was accepted for the final classification. This was carried out separately for each outcome measure and group. Subsequently, random coefficient regression (RCR) was used to assess whether or not each GMM class improved significantly with time as a result of the intervention. The RCR method is intended to be a substitute for repeated-measures ANOVA, with the presence of a random effect indexed on participant number for the time factor. The RCR is also more capable of modeling nonlinearities in the trend.
Results
Participants
There were no significant differences between the participants in each intervention group in terms of age, time since injury, WISCI II scores, and MAS (Table 1; P > .05 for all variables). Two participants in the control group did not complete the study, and 1 participant in the Tiz group was not able to complete the clinical measures. Therefore, analysis in the Lok and Tiz groups were carried out on n = 27 and n = 26 patients, respectively. Participants did not report any changes to their medications during the intervention.
Analysis of Variance
Mixed-model ANOVAs revealed significant improvements with time for both walking speed in the 10MWT (P < .001; Figure 1A) and walking distance in the 6MWT (P = .002; Figure 1B), with no group effects or interactions. For TUG, there were no significant effects of either time point or group (Figure 1C).
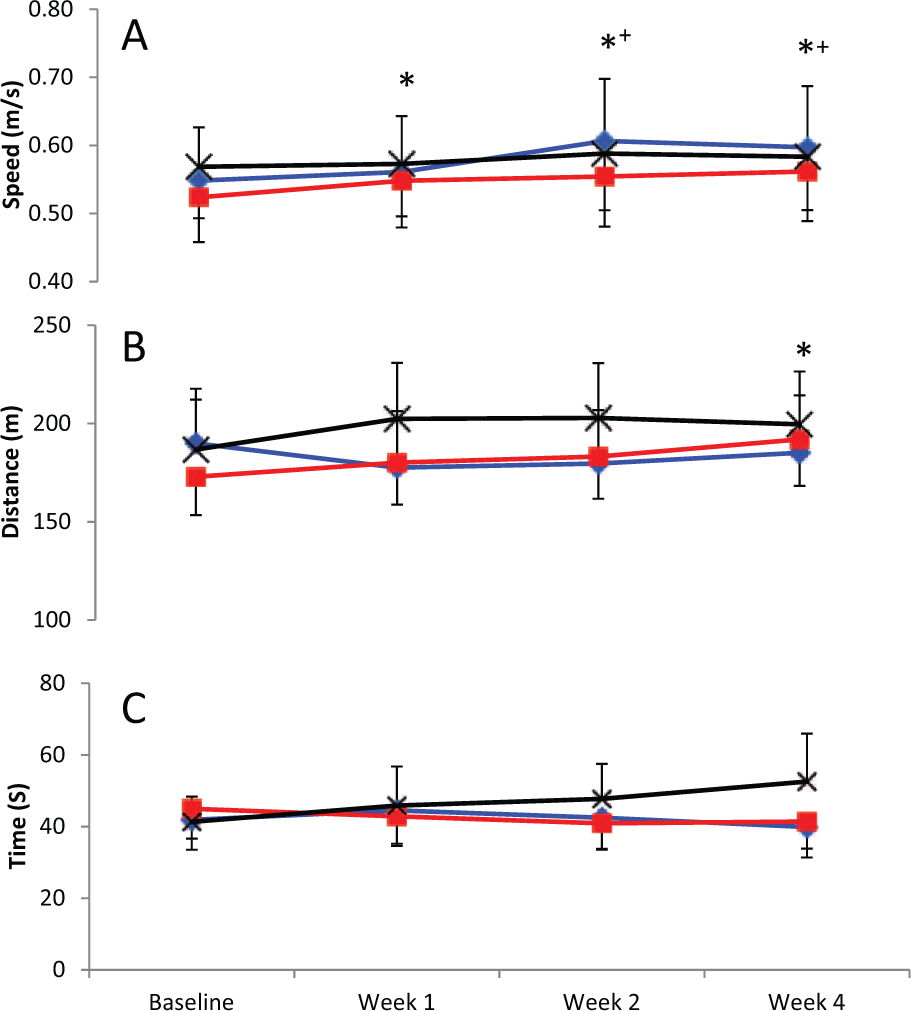
Mean (standard error of the mean) speed in the 10-m walk test (A), distance in the 6-minute walk test (B), and time in the Timed Up and Go test (C) for control (black crosses), Lok (blue diamonds), and Tiz (red squares) groups at each time point (significantly different from *baseline or +Week 1; P < .05).
Minimal Important Differences
Based on our control data, MID values were 0.11 m/s, 37.1 m, and −14.5 s for the 10MWT, 6MWT, and TUG, respectively. Participants were classified according to whether or not they achieved the MID for each test. Individuals were excluded if either baseline or week 4 data were missing; final n values for each group are provided in Table 2. For the 10MWT, the number (proportion) of participants who achieved the MID, after 4 weeks of training, were 2 (8%), 4 (15%), and 6 (23%) for control, Lok, and Tiz groups, respectively. Equivalent values for the 6MWT were 3 (13%), 2 (8%), and 5 (20%), and 2 (8%), 2 (8%), and 3 (12%) for the TUG (Table 2). Of those who did attain the MID within each test, there were no significant differences in MAS or WISCI II scores between the 3 intervention groups. However, those who attained the MID for the 6MWT had significantly higher WISCI II scores than those who did not attain the MID within the Tiz and control groups (P < .001; Table 2). This was also true for the 10MWT within the Tiz group only (P < .001; Table 2), with no significant differences observed for the TUG.
Number (n) of Participants and Mean (SD) Baseline Scores, Mean (SD) WISCI II Scores, and MAS Scores for Participants Who Did and Did Not Attain the MID for the 10MWT, 6MWT, and the TUG in Each Group. a
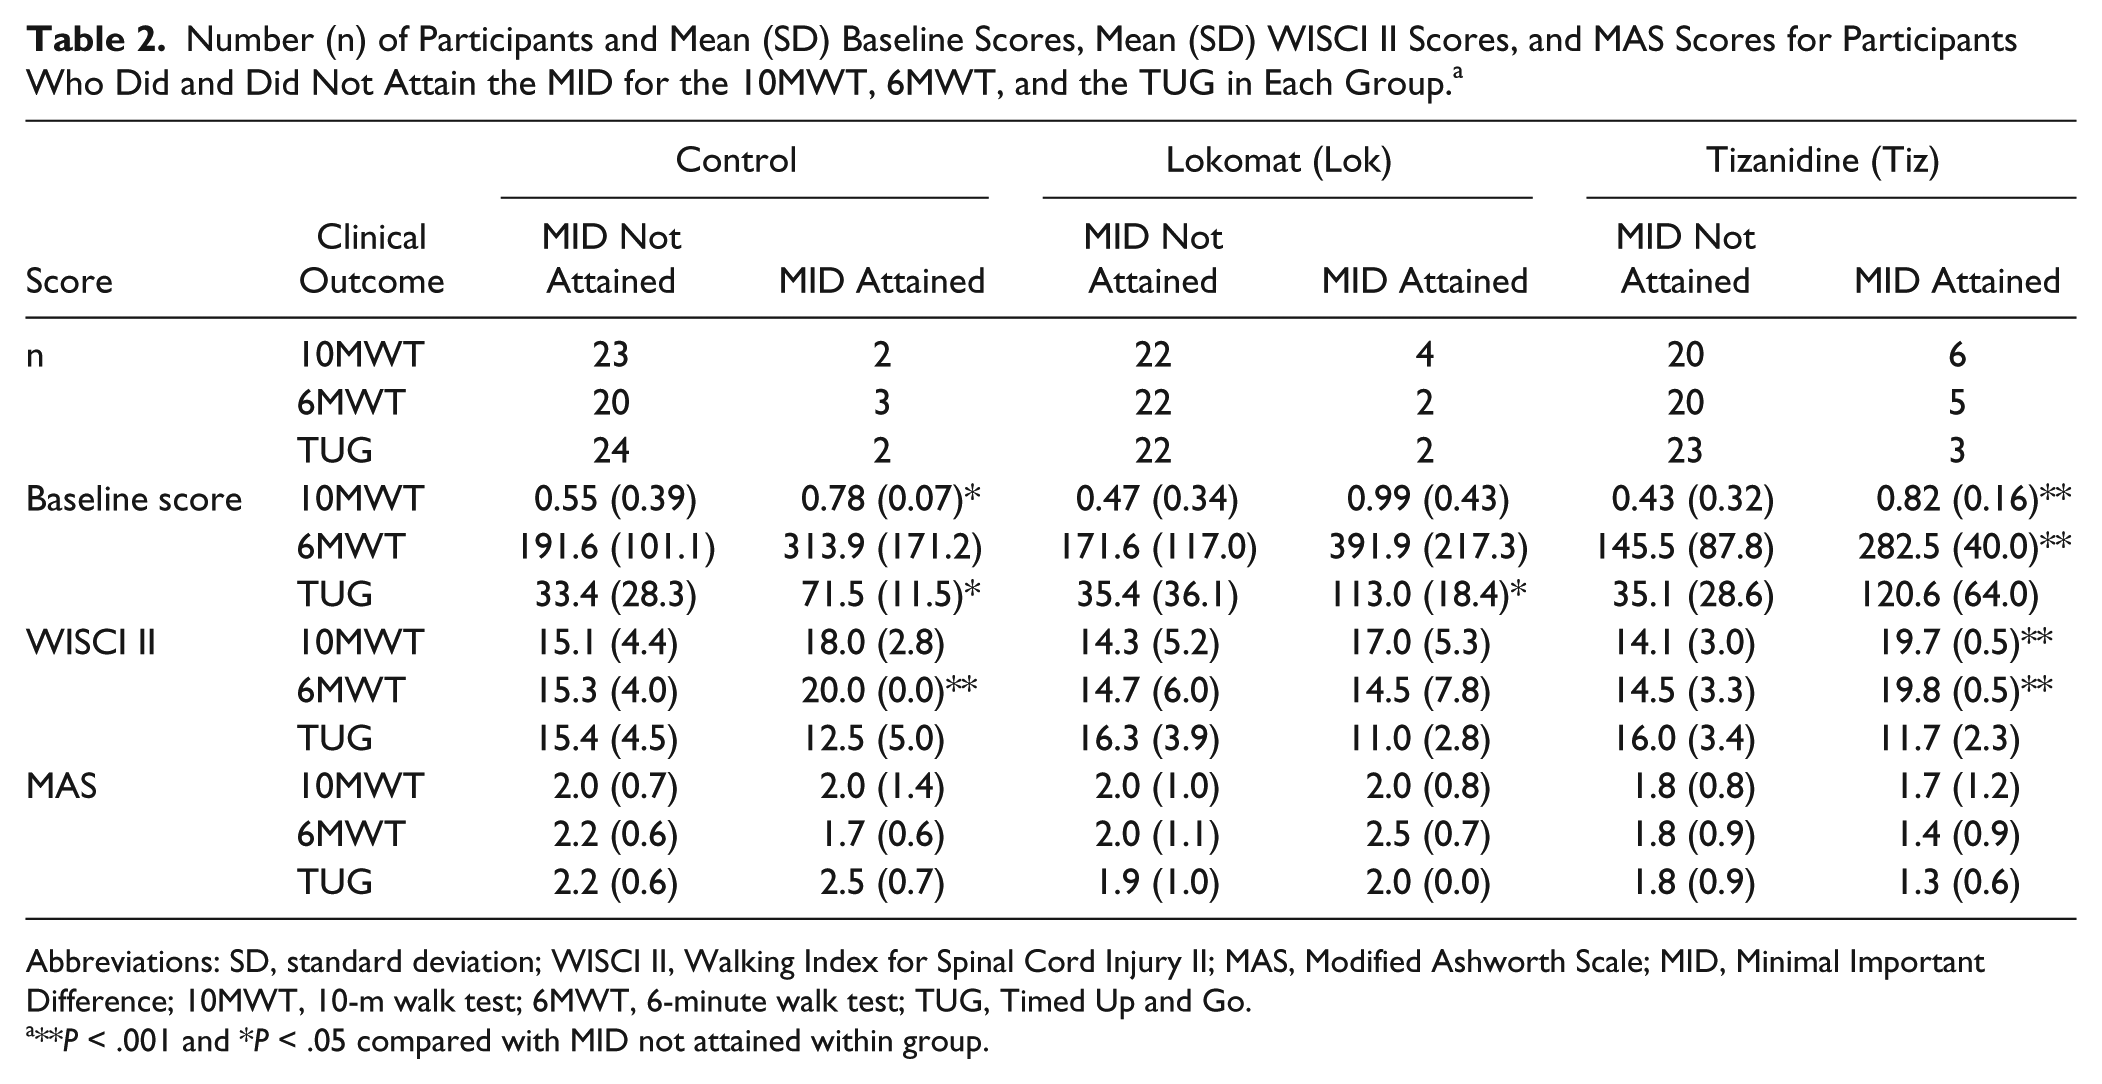
Abbreviations: SD, standard deviation; WISCI II, Walking Index for Spinal Cord Injury II; MAS, Modified Ashworth Scale; MID, Minimal Important Difference; 10MWT, 10-m walk test; 6MWT, 6-minute walk test; TUG, Timed Up and Go.
**P < .001 and *P < .05 compared with MID not attained within group.
In addition, those participants who achieved the MID for the 10MWT had significantly higher baseline walking speeds in both Tiz (P < .001) and control (P = .04) groups, and those who achieved the MID for the 6MWT had significantly higher baseline walking distance in the Tiz group (P < .001). Finally, those who achieved the MID for the TUG had significantly longer times in the control (P = .04) and Lok (P = .04) groups. Overall, therefore, for the 10MWT and 6MWT, the participants who attained the MID tended to be higher functioning (Table 2 and Figures 2A and 2B), and for the TUG, those who achieved the MID tended to be lower functioning (Table 2 and Figure 2C). There were no significant difference in MAS between participants who did and did not attain the MID, for all interventions and outcome measures (Table 2).
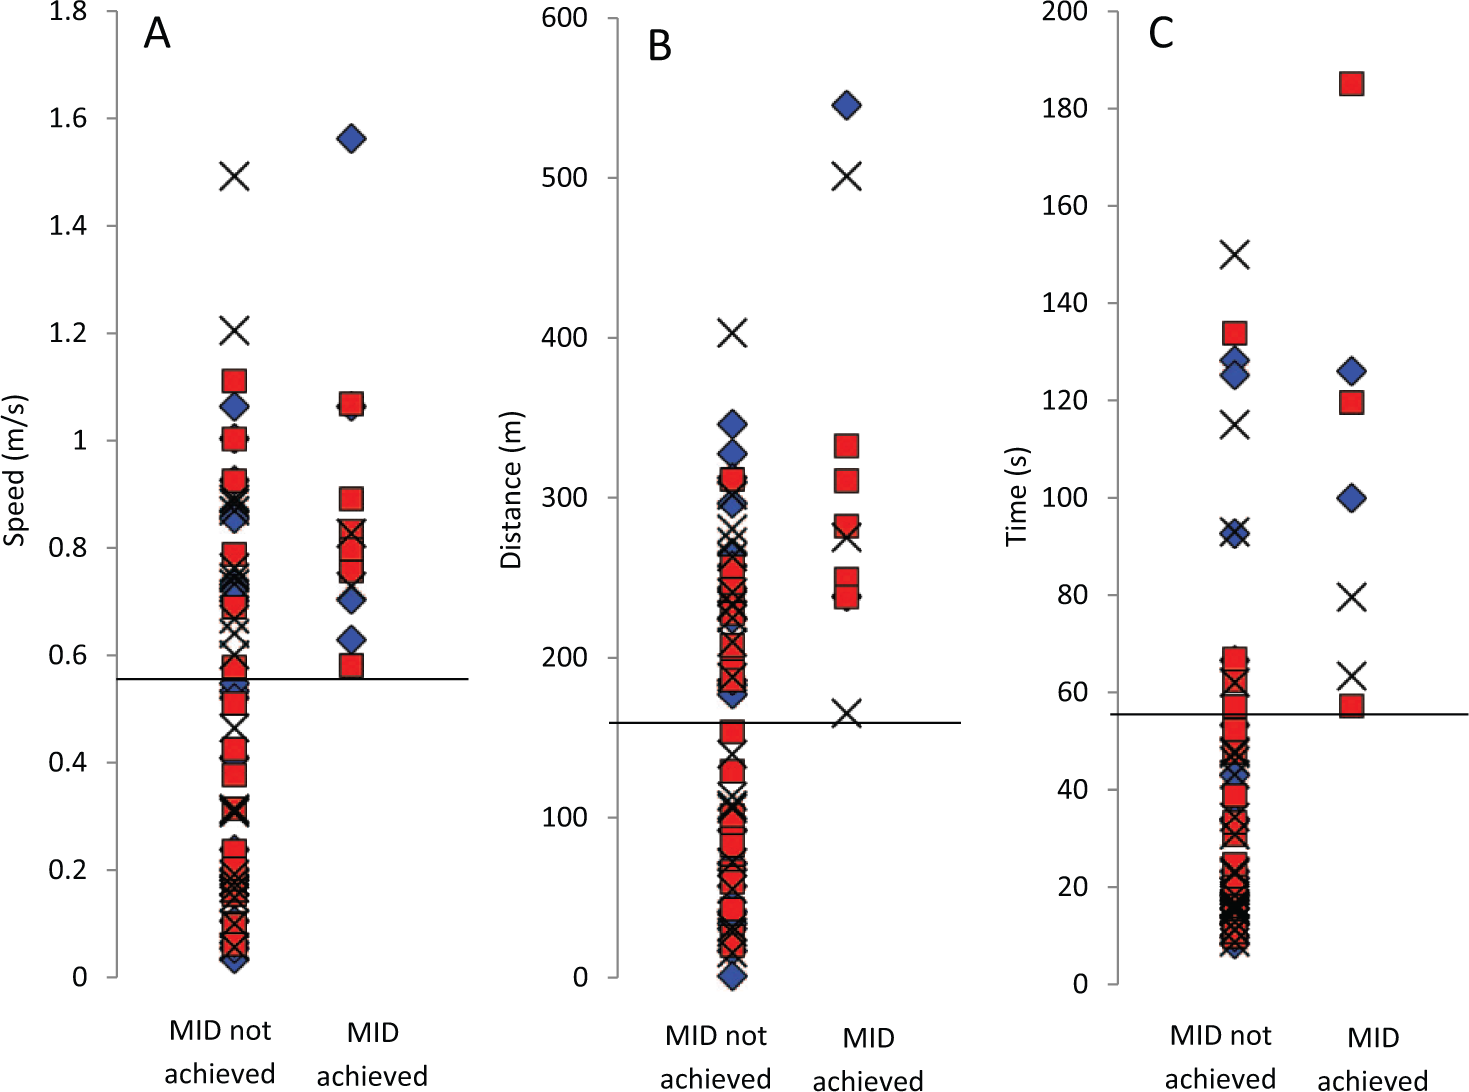
Baseline speed in the 10-m walk test (A), distance in the 6-minute walk test (B), and time in the Timed Up and Go test (C) for participants in the control (black crosses), Lok (blue diamonds), and Tiz (red squares) groups. Dashed black lines indicate the lowest baseline score for individuals that achieved the minimal important difference (MID) for each outcome measure.
Growth Mixture Modeling
Participants were excluded from the analysis if they did not complete any of the tests for a given outcome measure; this was only the case for the 6MWT where some individuals were not able to walk for 6 minutes’ duration throughout the study. Final n values for each group are provided in Table 3. The best-fit GMM categorized participants for each outcome measure into 2 classes for all groups and outcome measures. Participants in class 2 had significantly higher WISCI II scores and significantly improved baseline scores compared with class 1 for all outcome measures and intervention groups (Table 3). Therefore, these classes were considered as high (class 2) and low (class 1) functioning. There were no significant difference in MAS between participants in class 1 compared with class 2 for all interventions and outcome measures (Table 3). For the 10MWT, RCR revealed significant improvements with time for the Lok group in both the higher (class 2, P < .01) and lower (class 1, P < .05) functioning classes, with no significant changes for Tiz or control participants (Figure 3A). For the 6MWT, significant improvements with time were found for the Tiz group in the higher-functioning class only (class 2, P < .05; Figure 3B). For the TUG, significant improvements with time were also found for the Lok group in the higher-functioning class only (class 2, P < .05).
Number (n) of Participants and Mean (SD) Baseline Scores, WISCI II Scores, and MAS Scores for Participants in Class 1 and 2 for the 10MWT, 6MWT, and the TUG in Each Group. a
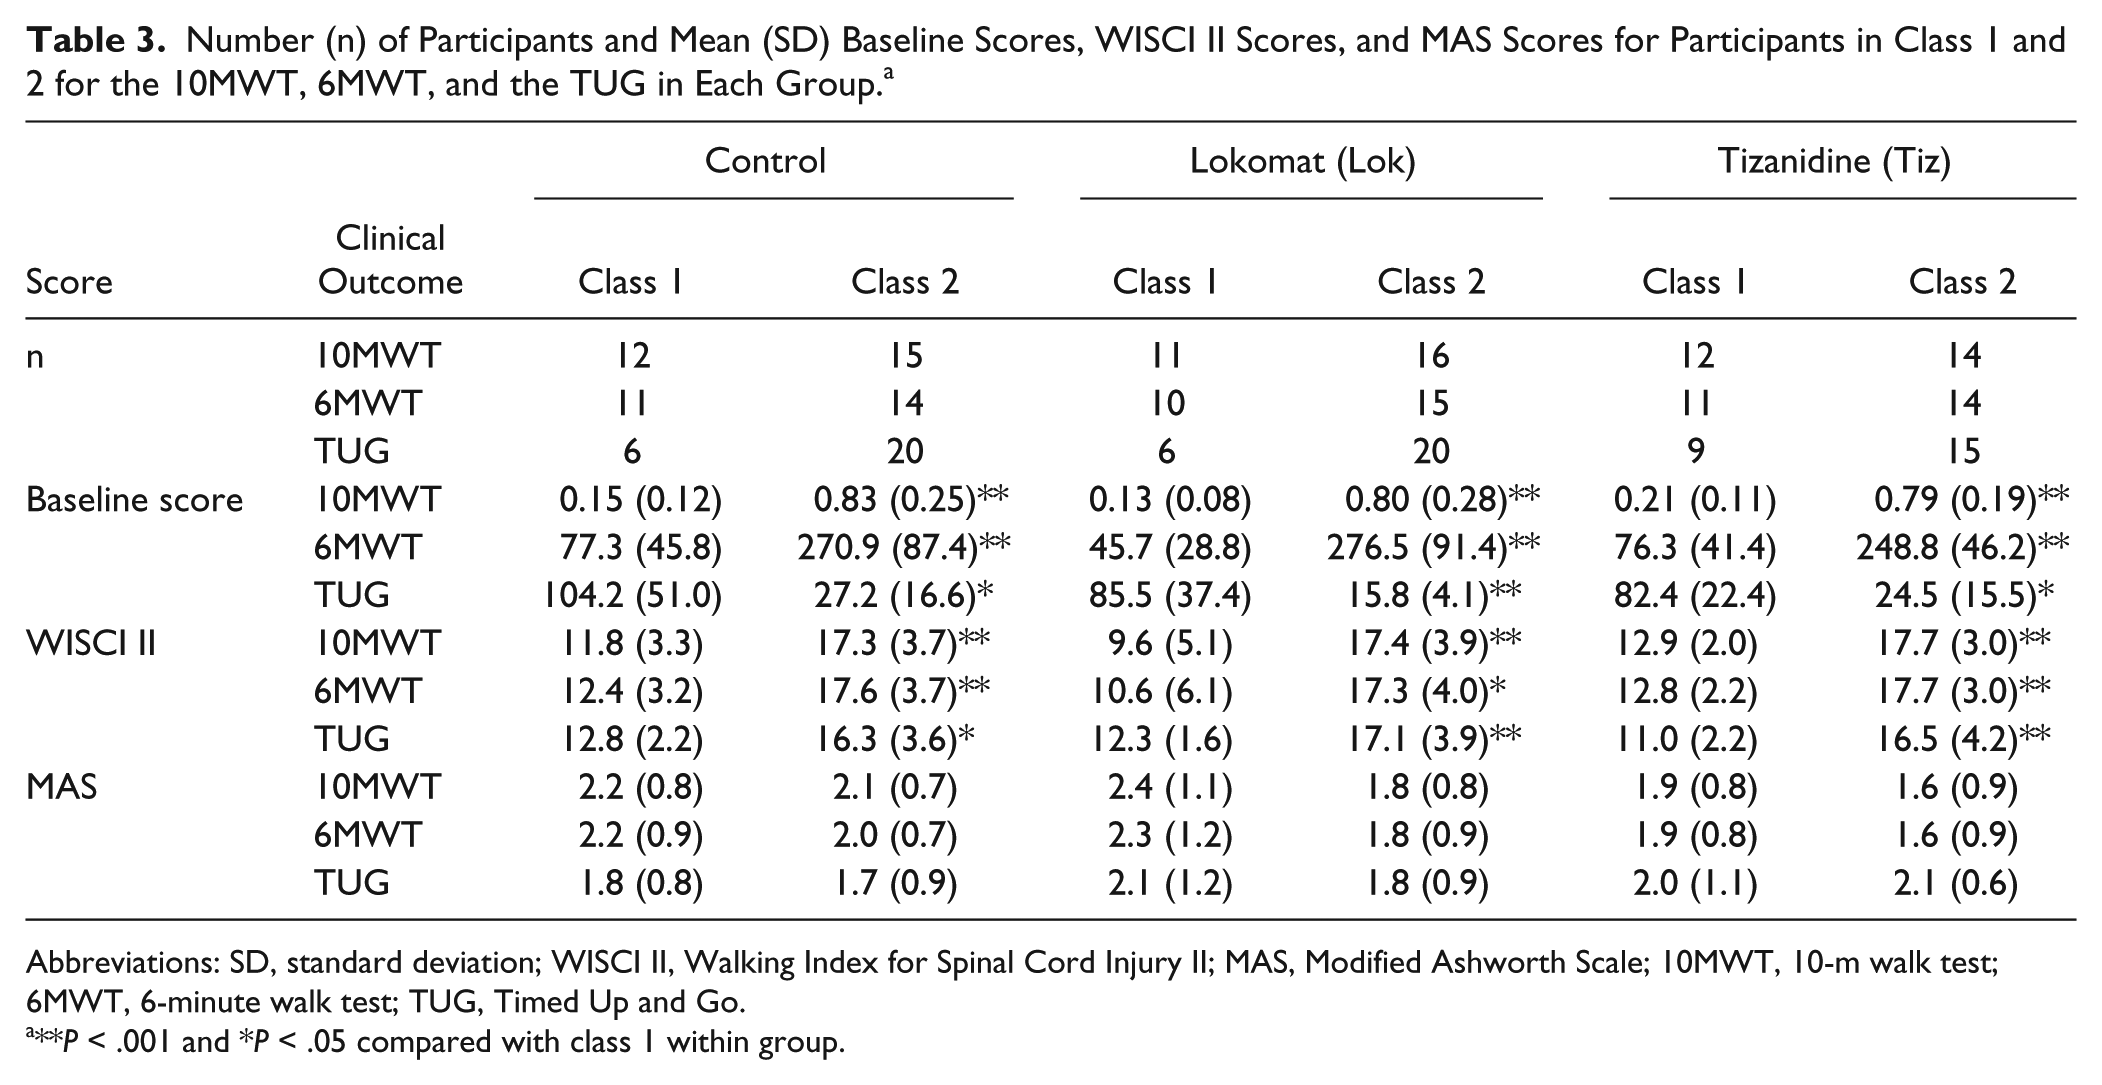
Abbreviations: SD, standard deviation; WISCI II, Walking Index for Spinal Cord Injury II; MAS, Modified Ashworth Scale; 10MWT, 10-m walk test; 6MWT, 6-minute walk test; TUG, Timed Up and Go.
**P < .001 and *P < .05 compared with class 1 within group.
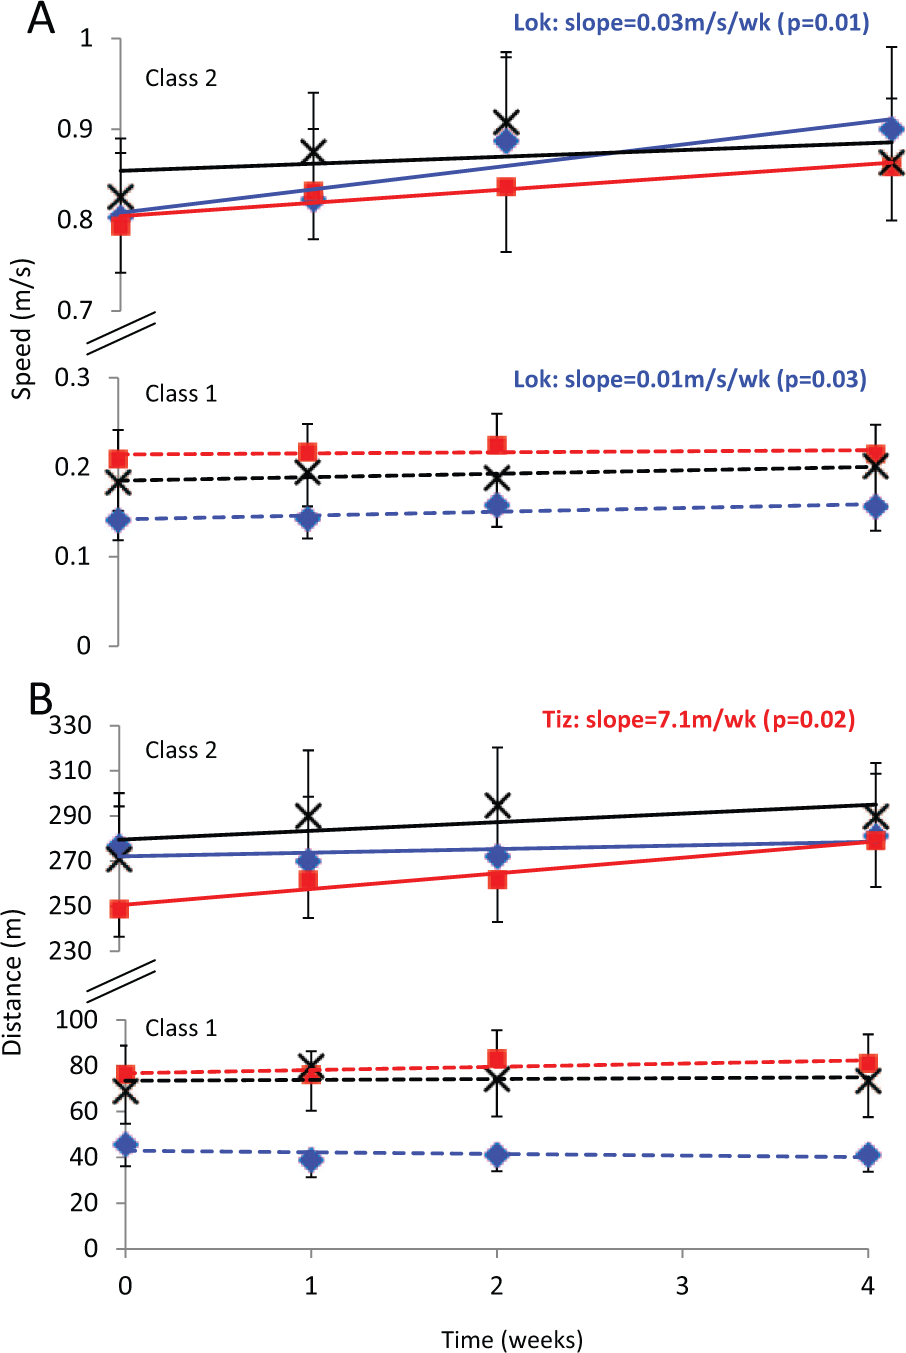
Mean (standard error of the mean) speed in the 10-m walk test (A) and distance in the 6-minute walk test (B) for control (black crosses), Lok (blue diamonds), and Tiz (red squares) groups and slope for class 1 (dashed lines) and class 2 (solid lines) generated by GMM-RCR. For the classes that showed a significant improvement with time, determined by RCR, P values and recovery slope values are provided.
Discussion
This study compared the effects of 2 different interventions—LTT and tizanidine—on gait impairments and used different analytical techniques to understand whether functional levels of people with chronic incomplete SCI affect functional recovery with different interventions. Mixed-model ANOVAs revealed small improvements in walking speed and endurance, with no significant differences between the interventions (LTT, antispasticity medication, and control). Using MID analysis, the number of participants who achieved the MID was small. Both MID and GMM-RCR analyses revealed improved endurance after tizanidine for high-functioning participants only. GMM-RCR analysis also revealed significant improvements in walking speed after Lokomat training for both high-and low-functioning participants and improved mobility for high-functioning participants only.
Using group averaging techniques, we found small improvements in walking speed and endurance, with no significant difference between intervention groups. These findings are consistent with previous reports, which conclude that small functional changes do occur with LTT; however, these changes are similar to those with other physical interventions.23,24,31 The effects of antispasticity medications on functional measures have seldom been reported, and studies that have reported the effects of other pharmacological interventions found small to negative effects on walking speed 42 and concluded that locomotor training resulted in better outcomes than any of the pharmacological interventions studied. 42 In the present study, we found small effects from tizanidine, which were similar to the effects of LTT. There was large variability in the clinical outcome data for each group (Figure 1), which also agrees with previous work 30 and may relate to the wide variability in functional levels among individuals with chronic incomplete SCI.
Therefore, we considered 2 alternative analysis techniques: the MID for clinical outcomes taken, in order to classify the participants who did or did not attain a real (clinical) change because of each intervention, and GMM. From the MID analysis, we noted that 2 to 6 participants achieved the MID, depending on the outcome measure and intervention used. When comparing the classification of participants between the 2 techniques, it was notable that all participants classified as achieving the MID for the 10MWT and 6MWT were also classified as class 2 (high functioning) by the GMM; this was true across all intervention groups. For the TUG, however, all participants who achieved the MID were classed as low functioning (class 1).
Tizanidine improved both walking speed and endurance for the highest number of participants attaining the MID across all groups (5-6 participants). These participants were found to have significantly higher functional levels than those who did not attain the MID, evidenced by significantly higher WISCI II scores (P < .001) and significantly higher baseline scores (P < .001) for both speed and endurance (Table 2). In agreement, GMM-RCR analysis revealed significant improvements in walking endurance with tizanidine in class 2 only; class 2 had higher-functioning participants, evidenced by significantly higher WISCI II (P < .001) and baseline (P < .001) scores (Table 3), similar to MID analysis. However, significant improvements in walking speed were not noted with tizanidine in GMM-RCR analysis, which was in contrast to MID results. Tizanidine may have reduced spasticity in the gastrocnemius muscle, which allowed improved (more coordinated) functioning of the tibialis anterior muscle, resulting in improved walking function. Further research is required to corroborate this speculation.
GMM-RCR analysis also revealed improved walking speed in the LTT group only, which was irrespective of functional level (a significant improvement was noted for both classes; Figure 3). MID analysis revealed improved walking speed with LTT in 4/27 participants, with no difference in functional levels between those who did and did not achieve the MID (no difference in WISCI II scores or baseline walking speed; Table 2). Improved walking speed with LTT has been reported previously20-24 and may be the result of improved muscle strength. 23 The fact that the improvement in walking speed was unrelated to functional level, evidenced in both MID and GMM-RCR analyses, is in contrast to the results of a previous study, which noted that a greater proportion of more-impaired participants with SCI improved walking speed after locomotor training compared with less-impaired participants. 24 In that study by Field-Fote and Roach, the LEMS was used to assess impairment level, which assesses lower-limb muscle strength, as opposed to walking ability, as assessed by WISCI II scores used in the present study. In addition, participants trained for a longer period (12 weeks) in that study, compared with only 4 weeks in our study. Longer-duration LTT may have elicited greater functional adaptations and may have allowed distinction between functional levels.
GMM-RCR analysis also revealed a significant improvement in walking mobility (TUG) for higher-functioning participants only after LTT; however, this result was not evident from MID analysis. MID analysis showed that tizanidine improved mobility in only 3/27 participants, and those who achieved the MID tended to be lower functioning (lower WISCI II score and higher baseline time to complete the TUG); however, these differences were not statistically significant, which may be a result of the low number of participants who did achieve the MID. As stated previously, all participants who achieved the MID for the TUG were classified as low functioning by the GMM (class 1). Therefore, the significant improvement in TUG for high-functioning participants only (class 2) by GMM-RCR analysis is an unexpected result that opposes the results of MID analysis. Such differences between MID and GMM analyses may relate to the fact that MID uses only the baseline and final data points, rather than the overall trend, as was used in GMM analysis; thus, the MID approach may be more susceptible to day-to-day measurement variations. This does, however, highlight the importance of the analysis method chosen. Overall, both GMM and MID techniques could identify some different outcomes for high-versus low-functioning participants that could not be detected using ANOVA alone.
Spasticity
Spasticity may both assist and impair gait function. Thus, baseline levels of spasticity at the ankle joint may be important in determining which patients will respond to different interventions as opposed to (or as well as) functional levels. We, therefore, compared ankle joint MAS between those patients who did and did not attain the MID. Our data suggest that spasticity level does not have an effect on whether or not each individual will attain the MID. However, it has previously been reported that no significant correlation exists between quantitative measures of muscular and reflex torque/stiffness associated with spasticity and the MAS magnitude. 43 Thus, although MAS is sufficient to assess the presence of clinical spasticity as measured by overall stiffness (inclusion criteria), it cannot determine the contribution of neuromuscular properties to the overall stiffness, and thus, it may be unreliable as an indicator of spasticity level.
Knee joint spasticity may also affect gait impairment; in some individuals, particularly those with muscle weakness, knee spasticity may assist walking; thus antispastic medication may not benefit these people, whereas in others, it may reduce knee joint spasticity without reducing stability at the knee. We cannot speculate from our data whether changes in knee joint spasticity influenced the outcomes.
Clinical Significance
An unexpected observation from this study was that, overall, the participants who achieved the MID for the 10MWT and the 6MWT tended to be higher functioning for that measure at baseline. That is, their baseline walking speed and distances were >0.58 m/s and >165 m, respectively (Figures 2A and 2B). In contrast, however, it was the lower-functioning participants who tended to attain the MID for the TUG outcome measure—that is, those with a baseline time of >57 s (Figure 2C; note that an increase in time represents lower function with this measure). This was not, however, significant across all groups, which may have been a result of the fact that a number of participants who did not achieve the MID had baseline scores similar to those who did (Figures 2A-2C) as well as the fact that the number of participants who did attain the MID was low.
The TUG assesses mobility, walking ability, balance, and risk of falling, as opposed to walking speed or endurance, as with the other measures taken. For lower-functioning participants, it may be that an improvement in mobility and balance is required before changes in speed and/or endurance take place. Thus, the TUG may be a more suitable assessment to detect this change in low-functioning participants, whereas the 10MWT and 6MWT were more suitable tests for higher-functioning participants. This is in agreement with a previous study, which showed that the 10MWT and 6MWT were more sensitive to change in participants with SCI with higher walking proficiency than an alternative measure of functional walking tasks (the SCI Functional Ambulation Profile, which includes the TUG). 44
These findings may also be clinically informative. For example, based on our data, it is indicated that individuals with a baseline walking speed of >0.58 m/s have a 55% chance of achieving improved walking speed after a 4-week tizanidine intervention (ie, 6/11 participants who had a baseline speed >0.58 m/s achieved the MID in that group) and have a 33% chance of achieving improved walking speed with 12 sessions of LTT, whereas those with a baseline walking speed of <0.58 m/s have little or no chance of showing an improvement with either intervention.
For the GMM analysis, patients were classified using both their baseline scores and recovery trends. Therefore, in the groups that showed significant improvements with RCR, the majority, but not necessarily all individuals, showed improvements. GMM-RCR results, therefore, similarly allow us to predict, from baseline scores, the likelihood of an individual belonging to a class and thus the probability that the individual will have improved gait function with a given intervention. Both techniques may, therefore, provide useful knowledge to clinicians and patients when deciding on the most appropriate intervention for each individual and provide more information than using group averaging techniques such as ANOVAs.
Limitations
Although GMM-RCR appears to be a useful technique, it should be noted that the significant improvements found by RCR were small and considerably less than our MID values; thus, the changes resulting from the interventions may still not be clinically relevant (ie, may not significantly affect the individual’s quality of life). Similarly, for the MID analysis, only a relatively small number of participants (2-6 participants per group) achieved the MID, and this was also the case in the control group (ie, some control participants did attain the MID with no intervention). Thus, the outcome measures alone may have been sufficient to induce clinically relevant changes in some individuals. It has previously been shown in a review article that the total number of training sessions required to improve walking outcomes >MID was 10 to 130 sessions. 45 In this study we provided only 12 sessions, which is toward the lower end of that range. Therefore, providing more training sessions may have resulted in greater improvements or increased the number of participants who achieved the MID.
This study was sufficiently powered for the group comparisons using ANOVAs and for the comparisons made between classes for the GMM analysis (>0.80). However, because of the low number of participants achieving the MID, the study was underpowered for some statistical comparisons in those groups. In addition, the number of participants within each group who did not attain the MID (21-25 individuals) was substantially different from the number who did, which also affects the validity of the statistical tests used. Therefore, these results should be interpreted with caution, and it is recommended that future studies incorporate more training sessions, which may result in a larger number of participants achieving the MID. A final limitation is that the participants in this study were also not followed up; therefore, we cannot speculate on whether noted changes were long-standing in these patients. Such measures would also be beneficial in future studies.
In conclusion, using group-averaging (ANOVA) techniques, small improvements in walking speed and endurance occur with interventions in people with chronic SCI; however, similar results were observed between interventions. Both MID and GMM-RCR analysis revealed improvements in walking endurance with tizanidine in high-functioning participants only—a finding that the typical group-averaging technique could not detect. GMM-RCR analysis additionally revealed improvements in walking speed and mobility with LTT. MID revealed that the TUG may be a more suitable assessment for low-functioning patients, and the 10MWT and 6MWT may be more suitable for higher-functioning patients. Overall, results of MID and GMM-RCR analysis were in agreement for the 10MWT and 6MWT but disagreed regarding the TUG. These findings demonstrate that both GMM and MID analyses have the potential to characterize the therapeutic effects of various types of interventions on clinical outcome measures.
Footnotes
Acknowledgements
We wish to thank L. Ness, D. Varoqui, M. Kindig, and D. Kotsapouikis for their contributions.
Declaration of Conflicting Interests
The authors declared no potential conflicts of interest with respect to the research, authorship, and/or publication of this article.
Funding
The authors disclosed receipt of the following financial support for the research, authorship, and/or publication of this article: This work was supported by the National Institutes of Health and the Craig H. Neilsen Foundation awards to MMM.