
Abstract
Background. Various prognostic biomarkers for upper extremity (UE) motor recovery after stroke have been reported. However, most have relatively low predictive accuracy in severe stroke patients.
Objective. This study suggests an imaging biomarker-based model for effectively predicting UE recovery in severe stroke patients.
Methods. Of 104 ischemic stroke patients screened, 42 with severe motor impairment were included. All patients underwent structural, diffusion, and functional magnetic resonance imaging at 2 weeks and underwent motor function assessments at 2 weeks and 3 months after stroke onset. According to motor function recovery at 3 months, patients were divided into good and poor subgroups. The value of multimodal imaging biomarkers of lesion load, lesion volume, white matter integrity, and cortical functional connectivity for motor recovery prediction was investigated in each subgroup.
Results. Imaging biomarkers varied depending on recovery pattern. The integrity of the cerebellar tract (P = .005, R 2 = .432) was the primary biomarker in the good recovery group. In contrast, the sensory-related corpus callosum tract (P = .026, R 2 = .332) and sensory-related functional connectivity (P = .001, R 2 = .531) were primary biomarkers in the poor recovery group. A prediction model was proposed by applying each biomarker in the subgroup to patients with different motor evoked potential responses (P < .001, R 2 = .853, root mean square error = 5.28).
Conclusions. Our results suggest an optimized imaging biomarker model for predicting UE motor recovery after stroke. This model can contribute to individualized management of severe stroke in a clinical setting.
Introduction
Understanding the recovery mechanisms and predicting recovery patterns are important for establishing individually tailored rehabilitation strategies and allowing patients to set realistic goals in clinics. 1 Previous studies have reported diverse prognostic factors related to upper extremity (UE) recovery, such as injury of the corticospinal tract (CST).1,2 A previous neuroimaging study used CST lesion load, which measures damage to the CST, to predict UE motor recovery after events including severe stroke. 3 However, the predictive accuracy of CST lesion load tended to decline when applied in severe stroke patients. 3 Another factor with prognostic value for motor recovery is motor evoked potential (MEP). The positive predictive value for MEP status is high, but the negative predictive value is low. 1 Because patients with severe motor impairments have a higher rate of negative MEP response, predicting UE motor recovery in these patients is challenging.
Therefore, there is a need among clinicians and investigators to identify novel neuroimaging biomarkers with better recovery prediction of UE motor function among patients with severe stroke. Multimodal neuroimaging data such as magnetic resonance imaging (MRI) images have been useful for predicting motor recovery of severe stroke patients. 1 Considering that severe stroke patients exhibit a large degree of inter-individual variability in functional recovery, 4 it is conceivable that different neuroimaging biomarkers contribute to good or poor recovery. Various imaging biomarkers have been reported. In anatomical imaging, the CST lesion load is a representative biomarker, as mentioned above, and lesion volume is a well-known biomarker even though it is not the most predictive. 5 In diffusion tensor imaging (DTI), the integrity of the CST or partial regions of the CST is a predictive neuroimaging biomarker with the greatest consensus among experts. 6 Also, the integrity of the cortico-cerebellar tract and that of the corpus callosum are worth noting as predictive biomarkers.7-9 The cerebellum is connected densely to motor areas and is involved in motor learning and control.10,11 The corpus callosum is the largest white matter structure that plays an important role in the transfer of motor and sensory information. 12 In resting-state functional magnetic resonance imaging (rs-fMRI), interhemispheric connectivity is related to prediction of motor outcomes.13-16 Disruption of interhemispheric connectivity is the most noticeable characteristic and a good indicator of bihemispheric imbalance after stroke.14,17 We hypothesized that there are distinct neuroimaging biomarkers predicting good and poor recovery. We examined neuroimaging biomarkers in patients who showed good or poor recovery, and these biomarkers were applied to patients with a positive or negative response to MEP.18,19 Then, we examined whether certain neuroimaging biomarkers could improve the predictive accuracy of UE motor recovery compared to previously established neuroimaging biomarkers and MEP response alone.
Methods
Study Participants
One hundred four ischemic stroke patients were screened retrospectively from the stroke database of the Department of Physical and Rehabilitation Medicine, Samsung Medical Center. This database comprises stroke patients with motor impairment who received comprehensive inpatient rehabilitation therapy for approximately 3 weeks during the subacute phase. The inclusion criteria were (1) age 19 years or older at the time of stroke onset, (2) first-ever unilateral stroke, (3) severe motor impairment (Fugl-Meyer Assessment (FMA) of UE score <35 at 2 weeks, comprising the severe and severe-moderate groups from Woytowicz et al 20 ), and (4) three-dimensional (3D) T1-weighted MRI, DTI, and rs-fMRI data at 2 weeks. The exclusion criteria were (1) clinically significant neuropsychiatric comorbidities in addition to stroke, (2) metallic implants in the brain, (3) hemorrhagic stroke, (4) bilateral lesions, and (5) recurrent stroke. Forty-two stroke patients were included in this analysis after excluding four patients with image artifacts or failure of spatial normalization of MRI data. The patients underwent clinical assessment including National Institutes of Health Stroke Scale (NIHSS), Mini Mental State Examination (MMSE), and FMA at 2 weeks. FMA was repeated 3 months after onset to examine recovery of motor impairment. The comparison of characteristics of included and excluded patients is presented as Supplemental Table 1.
Participants were divided into good and poor recovery subgroups. Patients who achieved a minimal clinically important difference (FMA-UE3m − FMA-UE2w > 12)
21
during the recovery period and functioned corresponding to moderate-mild impairment (FMA-UE3m ≥ 35)
20
at 3 months were assigned to the good recovery group (n = 21). The rest of the patients (n = 21) were assigned to the poor recovery group. The flowchart of the study is shown in Figure 1. Flowchart of the retrospective study design.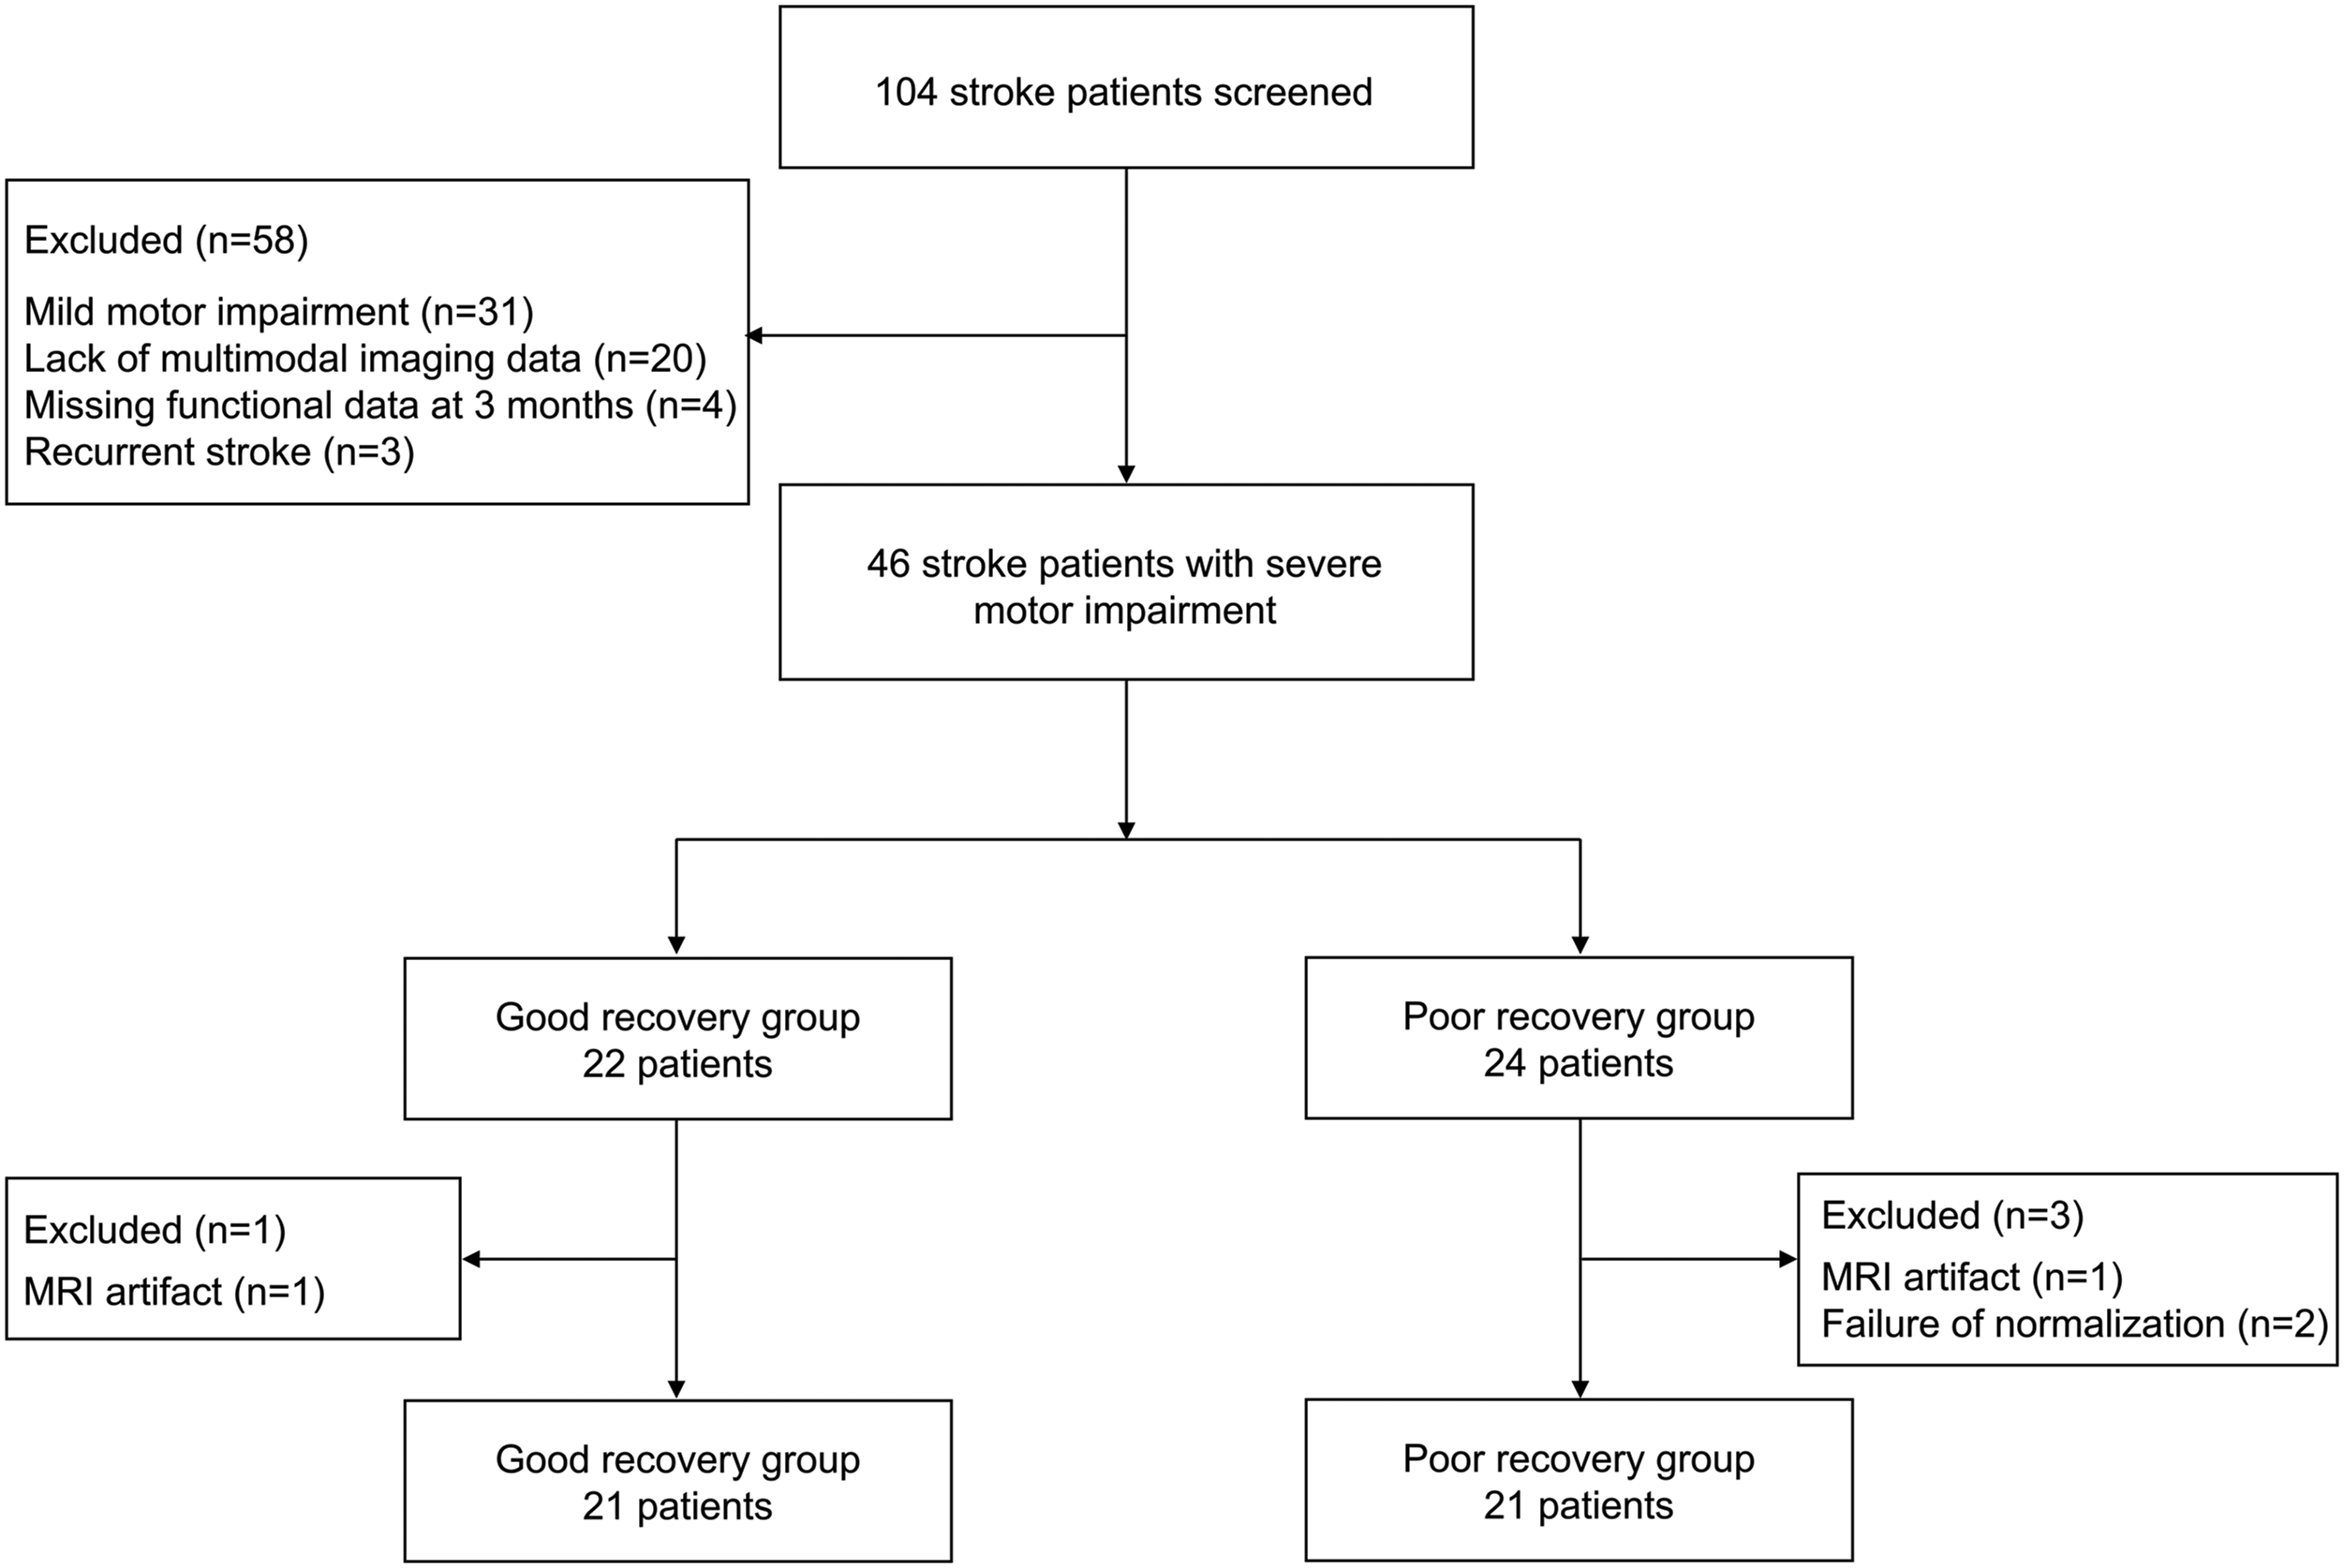
Ethical approval was obtained from the Institutional Review Board (IRB) of Samsung Medical Center, Seoul, Republic of Korea. We received an exemption for informed consent from the IRB because we used only previously collected data and did not exceed the minimal risk.
Determination of Motor Evoked Potential Response Using Single-Pulse Transcranial Magnetic Stimulation
Single-pulse transcranial magnetic stimulation (TMS) was performed to determine the presence of an MEP response 2 weeks after stroke onset. To examine TMS-induced MEP at rest, the participants were seated in a reclining armchair with both hands pronated. Electromyography (EMG) electrodes were attached to record signals from the contralateral first dorsal interosseous muscle, and the signals were bandpass filtered at 10-2000 kHz. A TMS system (Magstim Rapid2® stimulator; Magstim Ltd., Carmarthenshire, UK) and 70-mm figure-eight coil were used. The electromagnetic current flowed perpendicular to the central sulcus because the coil handle was oriented 45° posterior to the midline. Using the international 10-20 system, the vertex (Cz) point was marked, and the initial scalp location was identified 5 cm lateral to the intersection line from the vertex to the preauricular point. The presence of an MEP response was assessed by moving the coil in 1-cm steps in each direction at intervals of 5 s. Each patient’s resting motor threshold (rMT) was defined as the lowest intensity of stimulus necessary to produce an MEP peak-to-peak amplitude ≥50 μV in 5 of the 10 consecutive trials. If patients had no response ≥50 μV for at least 5 of 10 trials with maximum stimulator output, they were assigned to the MEP negative group.
According to MEP response, patients were described as MEP positive (MEP+) or MEP negative (MEP−).
Magnetic Resonance Imaging Data Acquisition
T1-weighted structural MRI, DTI, and rs-fMRI data were acquired using a 3T Philips ACHIEVA® MR scanner (Philips Medical Systems, Best, Netherlands). Imaging data were acquired with the following settings: T1-weighted structural data, 124 axial slices, slice thickness = 1.6 mm, no gap, matrix size = 512 × 512, voxel size = .47 × .47 mm, repetition time = 13.9 ms, echo time = 6.89 ms, flip angle = 8°, and field of view = 240 × 240 mm; DTI data, b = 1000 s/mm2, 45 non-colinear gradient directions, 60 axial slices, slice thickness = 2.25 mm, no gap, matrix size = 112 × 112, voxel size = 1.96 × 1.96 mm, repetition time = 8770 ms, echo time = 60 ms, and field of view = 220 × 220 mm; rs-fMRI data, 100 volumes, 35 axial slices, slice thickness = 4 mm, no gap, matrix size = 128 × 128, voxel size = 1.72 × 1.72 mm, repetition time = 3000 ms, echo time = 35 ms, and field of view = 220 × 220 mm.
Extraction of Imaging Biomarkers and Use of Motor Evoked Potential
CST lesion load, lesion volume, and fractional anisotropy (FA) values of CST related to brain region (posterior limb of the internal capsule, PLIC; cerebral peduncle, CP; superior corona radiata, SCR), corpus callosum (genu of the corpus callosum, GCC; body of the corpus callosum, BCC; splenium of the corpus callosum, SCC), superior cerebellar peduncle (SCP), and interhemispheric homotopic functional connectivity (IHFC) were extracted as imaging biomarker candidates. The predictive accuracy of the imaging biomarkers was examined in the good and poor recovery subgroups. To validate imaging biomarkers in practice, imaging biomarkers identified from the good and poor recovery subgroups were applied to MEP+ and MEP− patients, respectively.
Lesion Load and Lesion Volume
Each individual lesion was drawn manually on diffusion-weighted images using FSLview 4.0.1 (part of FSL software version 5.0.9). Each lesion volume was warped to the Montreal Neurological Institute (MNI) standard space using the transformation matrix obtained from DTI normalization. The results were visualized using MRIcroGL (McCausland Center for Brain Imaging, University of South Carolina, http://www.cabiatl.com/mricrogl). Lesion volumes were flipped for patients with lesions on the right side; all lesions were overlaid on the left side. We used a probabilistic CST template that descended from the primary motor cortex (M1) obtained from probabilistic tractography in nine healthy DTI patients to calculate CST lesion load.
22
Lesion load was calculated by overlaying each individual lesion volume onto the probabilistic CST template3,23 as follows
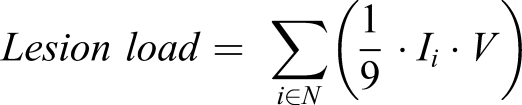
Lesion volume was calculated by counting the number of lesioned voxels from the normalized lesion map and multiplying by voxel volume. Log transformation of the lesion volume was performed to adjust for the skewness of this value. All calculations were performed using MATLAB® (Mathworks, Natick, MA, USA).
Fractional Anisotropy Analysis from Diffusion Tensor Imaging
Individual DTI data were preprocessed using the FMRIB’s Diffusion Toolbox from the FSL software package version 5.0.9 (FMRIB Software Library, FMRIB, Oxford, UK, http://www.fmrib.ox.ac.uk/fsl). Eddy currents and head motion were corrected, and brains were skull stripped. The DTIfit algorithm was used to fit a tensor model and calculate FA maps for eddy currents and head motion-corrected data. FA maps were registered non-linearly to the MNI standard space (FMRIB58_FA standard space image) using the registration algorithm of the tract-based spatial statistics (TBSS) technique. At that time, the lesioned voxels were masked, and the stroke lesion was not considered during registration. Preprocessing steps were performed according to a previous study by Schulz et al. 22 The warped FA maps were assessed visually. To obtain region-specific FA values, the Johns Hopkins University white matter atlas (JHU ICBM-DTI-81) 24 provided by FSL was used. The PLIC, CP, SCR, SCP, and corpus callosum were extracted from the atlas. The corpus callosum consists of the GCC, BCC, and SCC. Each region was binarized and masked over the warped FA map. The FA value of the region was obtained by averaging the FA values of each comprising region. Proportional FA values (affected/unaffected hemisphere) were calculated in the PLIC, CP, SCR, and SCP.
Functional Connectivity Analysis from Resting-State fMRI
Preprocessing of rs-fMRI data was performed primarily using the CONN toolbox version 17f (McGovern Institute for Brain Research, Massachusetts Institute of Technology, Cambridge, MA, USA, http://www.nitrc.org/projects/conn) implemented in MATLAB®. Preprocessing included head motion correction and slice timing correction, outlier detection for scrubbing using ART-based identification, registration of structural images, segmentation, lesion-masked normalization, and spatial smoothing with an 8-mm full-width at half maximum Gaussian kernel. In connectivity analysis, several nuisance sources, including motion-related artifacts and other confounding signals, were removed using linear regression. The confounding factors were six head motion parameters and six first-order temporal derivatives of the motion parameters, each of the five parameters obtained from a principal component analysis of the temporal components of white matter and ventricle signals, and ART-based scrubbing parameters for outlier volumes. Bandpass filtering between .008 and .09 Hz and linear detrending were performed.
The automated anatomical labeling (AAL) template 25 was used for region-wise connectivity analysis. The atlas was co-registered to the normalized rs-fMRI data space using the SPM12 package (Welcome Trust Centre for Neuroimaging, University College London, London, UK, http://www.fil.ion.ucl.ac.uk/spm). Lesioned voxels were masked. Functional connectivity was measured by calculating Pearson’s correlation coefficients between the mean time courses across regions. The strength of the IHFC was obtained by averaging the strength of the connections between homotopic regions in the bilateral cerebral hemispheres. An additional biomarker was investigated using rs-fMRI data in the poor recovery group. Connectivity related to motor recovery was investigated in whole-brain regions as an imaging biomarker candidate. The connectivity with the best predictive accuracy was extracted and used as an imaging biomarker.
Statistical Analysis
All variables were assessed for normal distribution using the Shapiro–Wilk normality test. The independent t-test and chi-square test were used to evaluate significant differences in clinical characteristics. Analysis of covariance (ANCOVA) followed by Bonferroni correction was conducted to evaluate differences in imaging variables between groups. Patient age, sex, and lesion volume were included as confounding variables. Pearson’s correlation was used to identify the predictive value of biomarkers for improvement of FMA-UE. Multiple corrections for pairwise correlations were performed using the permutation test. Partial correlation was performed after adjusting for patient age and sex and lesion volume. Multiple linear regression was used to establish prediction models using the best biomarkers for each subgroup identified in correlation analysis. Prior to linear regression, assumptions were tested (see Supplemental Material). Leave-one-out cross-validation (LOOCV) was used to assess the performance of our proposed prediction model. The predictive accuracy of the models is presented as R 2 and root mean square error (RMSE). These results were derived using the statistics toolbox of MATLAB R2016a, where P < .05 was considered statistically significant.
Results
Predictive Accuracy of Biomarkers
Demographic and clinical characteristics in participants.
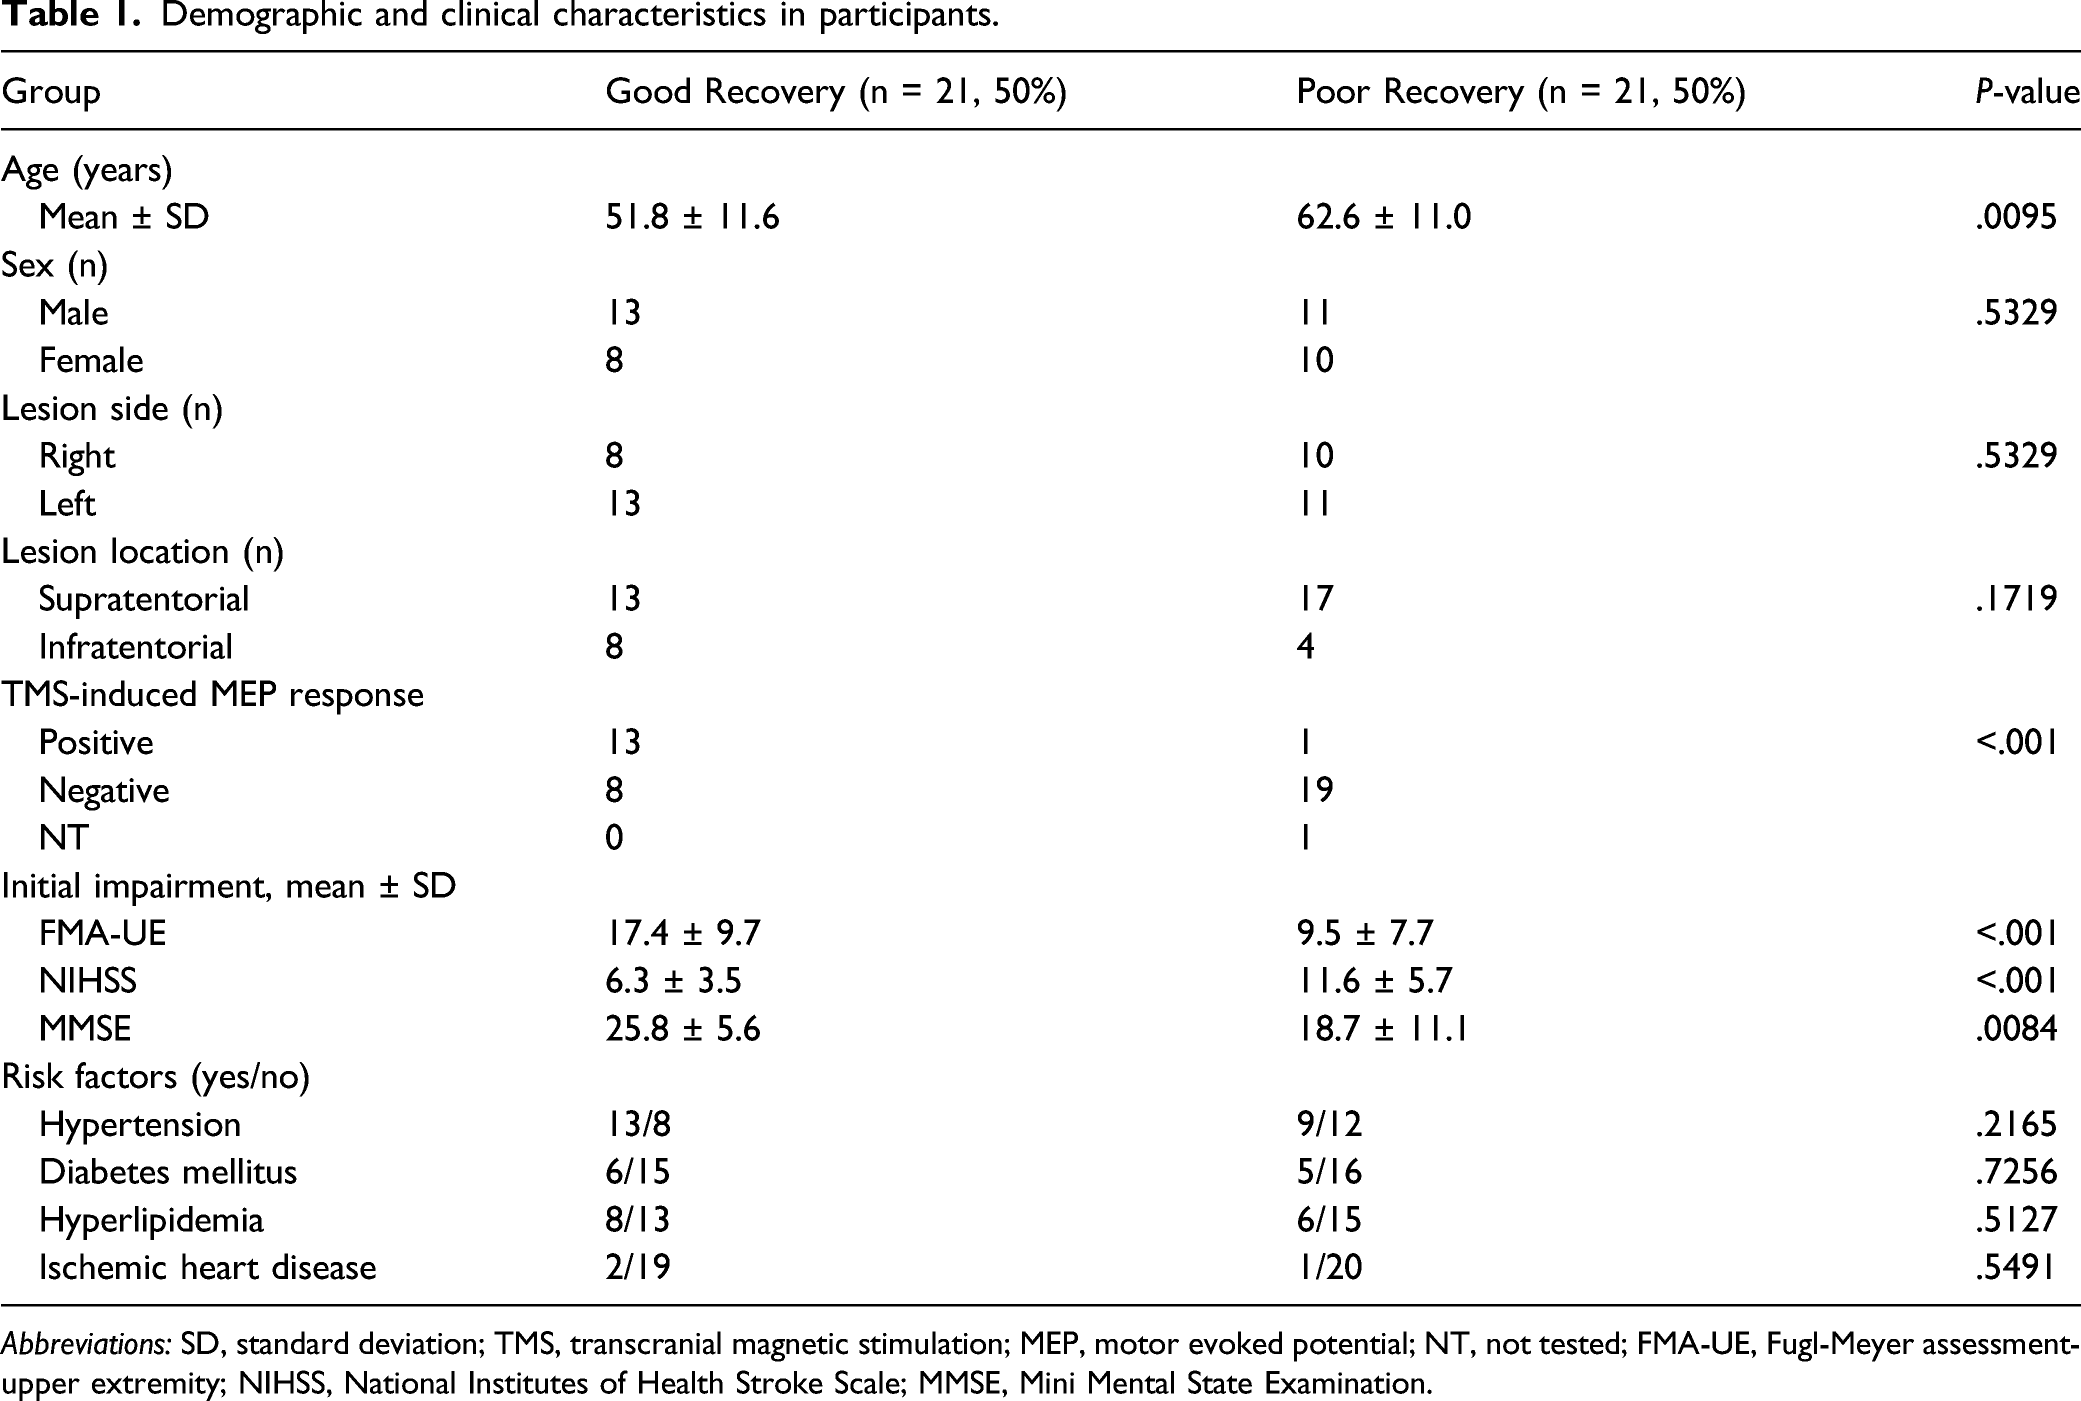
Abbreviations: SD, standard deviation; TMS, transcranial magnetic stimulation; MEP, motor evoked potential; NT, not tested; FMA-UE, Fugl-Meyer assessment-upper extremity; NIHSS, National Institutes of Health Stroke Scale; MMSE, Mini Mental State Examination.
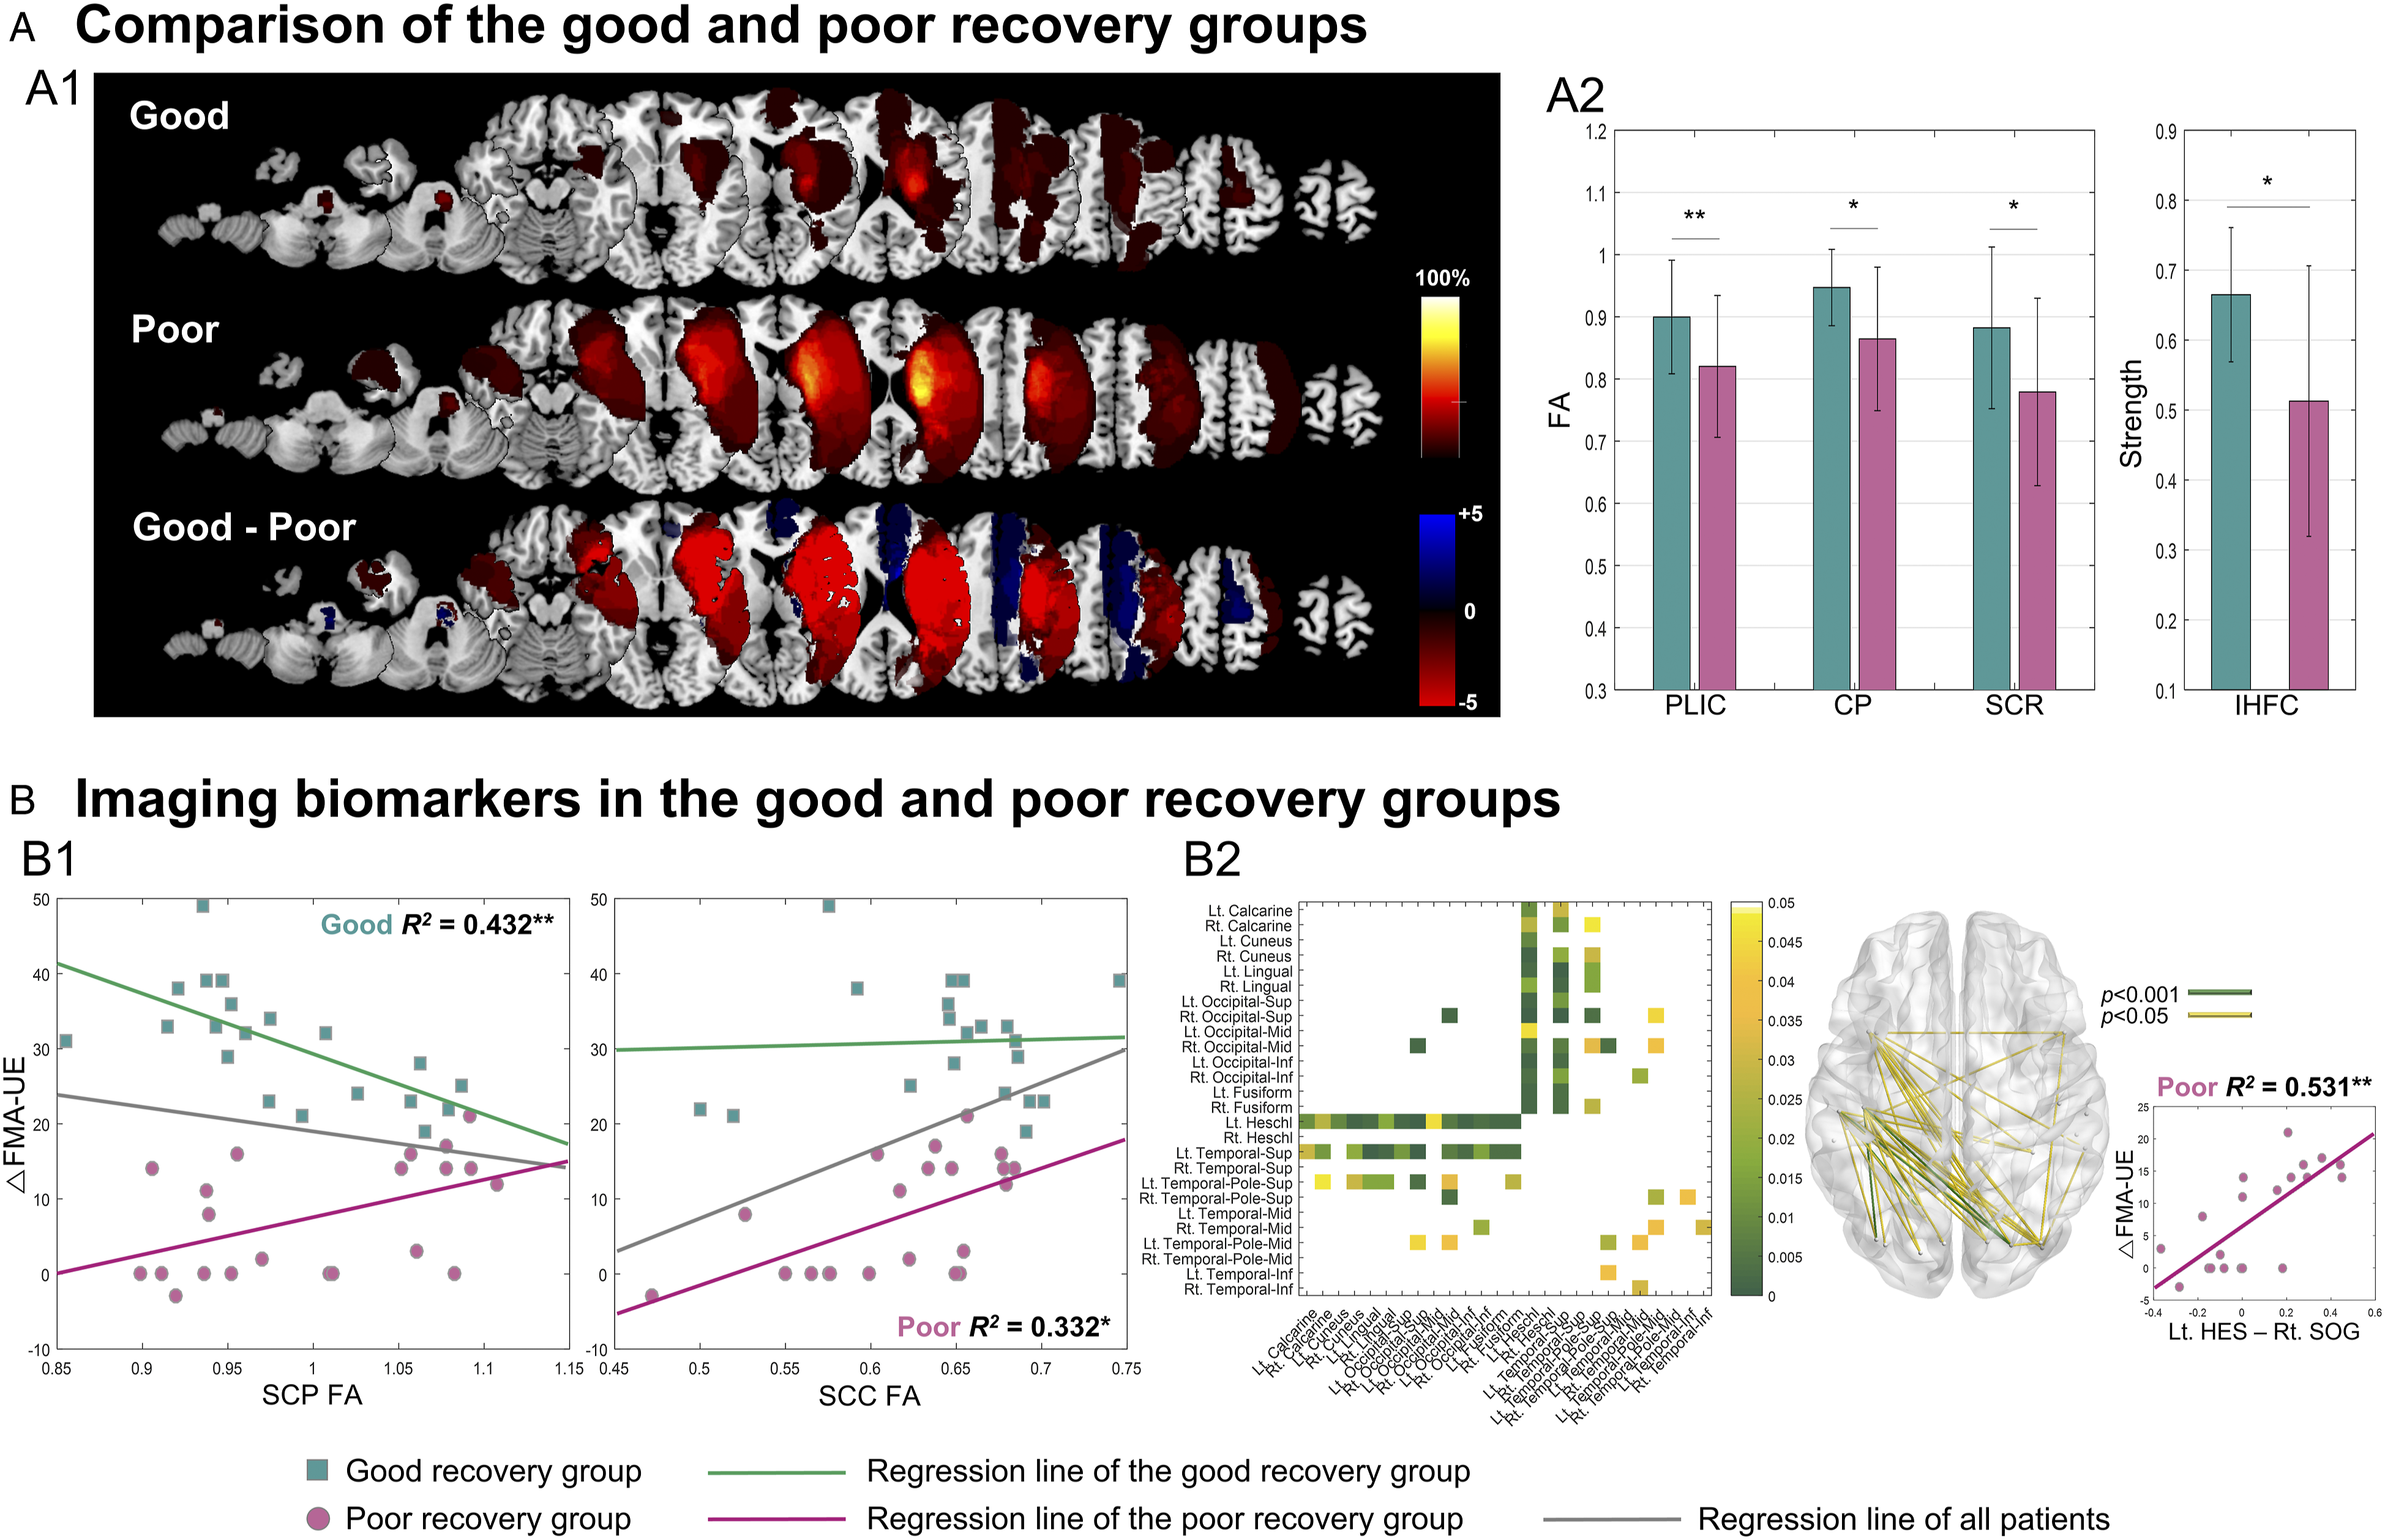
Characteristics of imaging biomarkers between the good and poor recovery groups. (A) Comparison of the good and poor recovery groups. A1, lesion information; A2, FA values for white matter regions and IHFC strength. (B) Imaging biomarkers, B1, DTI biomarkers: SCP FA and SCC FA; B2, rs-fMRI biomarkers. The matrix and glass-brain views show significant functional connectivity with upper extremity motor recovery. FA, fractional anisotropy; PLIC, posterior limb of the internal capsule; CP, cerebral peduncle; SCR, superior corona radiata; IHFC, interhemispheric homotopic functional connectivity; SCP, superior cerebellar peduncle; SCC, splenium of the corpus callosum;
Coefficient of determination (R 2 ) and significance of the correlation between imaging biomarkers at 2 weeks post-stroke and improvement in FMA-UE over 3 months in patients.
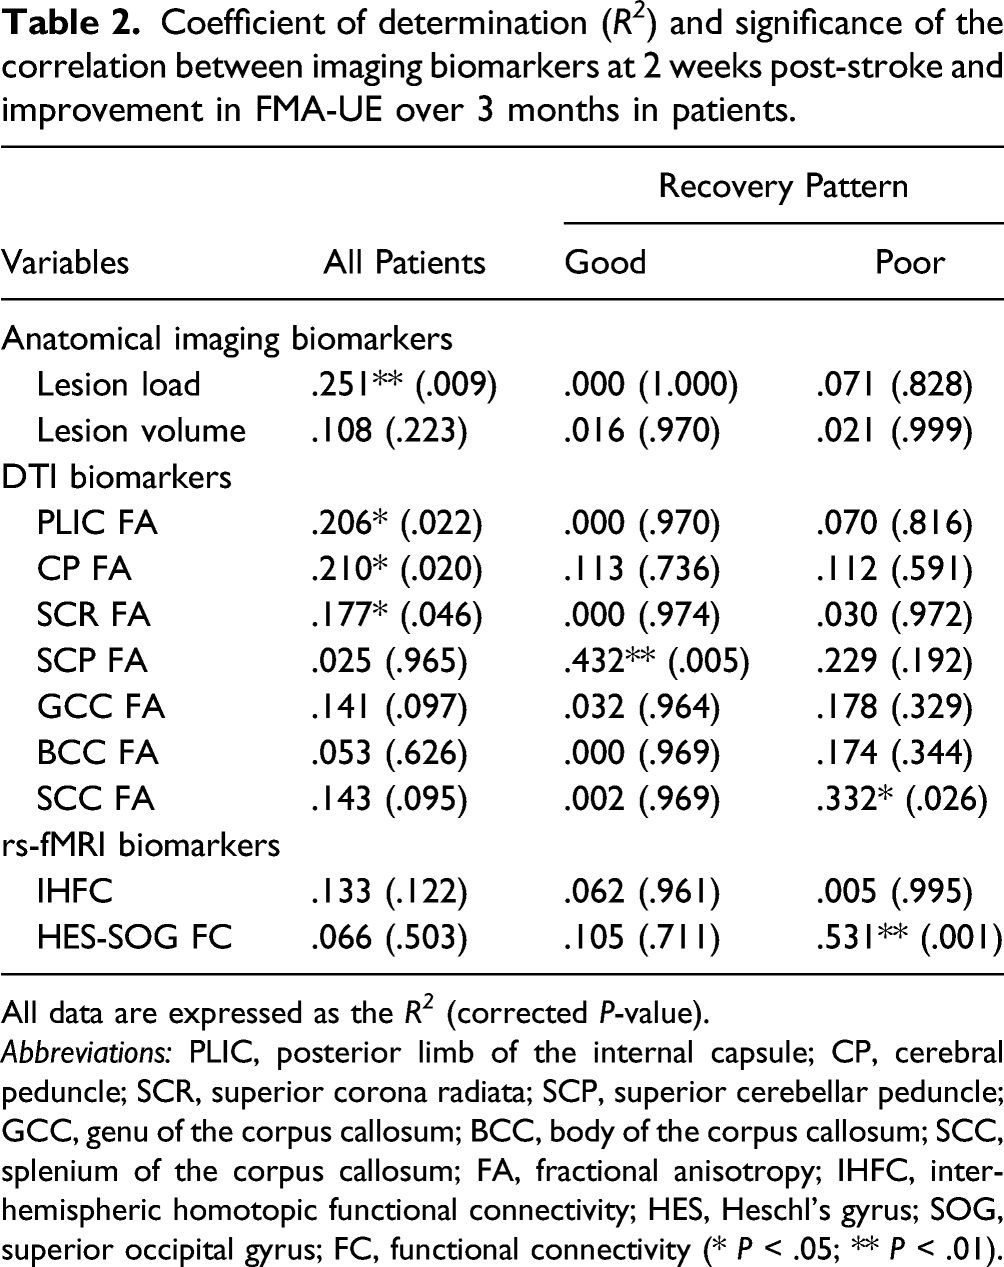
All data are expressed as the R 2 (corrected P-value).
Abbreviations: PLIC, posterior limb of the internal capsule; CP, cerebral peduncle; SCR, superior corona radiata; SCP, superior cerebellar peduncle; GCC, genu of the corpus callosum; BCC, body of the corpus callosum; SCC, splenium of the corpus callosum; FA, fractional anisotropy; IHFC, interhemispheric homotopic functional connectivity; HES, Heschl’s gyrus; SOG, superior occipital gyrus; FC, functional connectivity (* P < .05; ** P < .01).
Prediction Model Using a Stratification Strategy
Prediction models for upper extremity motor recovery in patients according to MEP response in all patients.
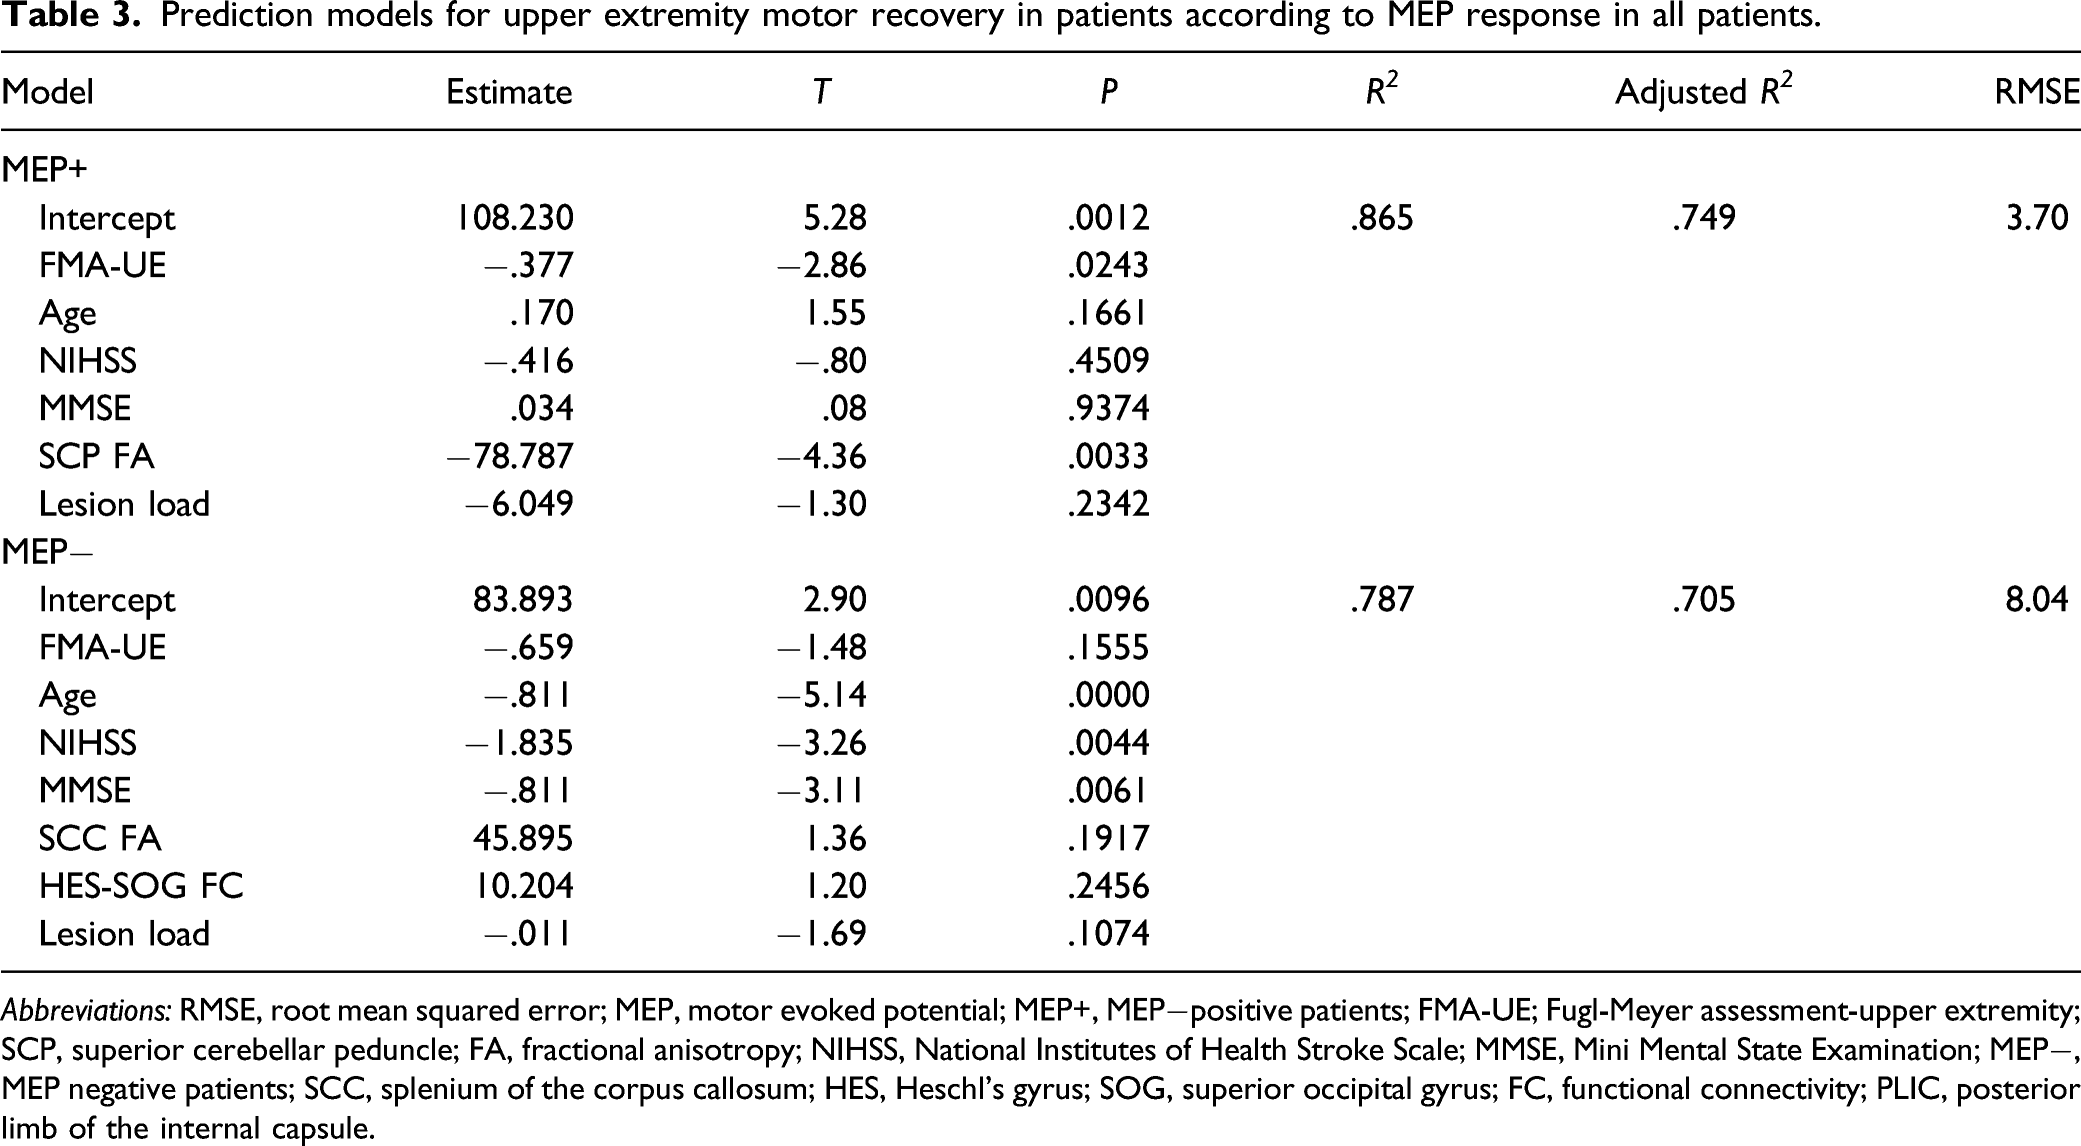
Abbreviations: RMSE, root mean squared error; MEP, motor evoked potential; MEP+, MEP−positive patients; FMA-UE; Fugl-Meyer assessment-upper extremity; SCP, superior cerebellar peduncle; FA, fractional anisotropy; NIHSS, National Institutes of Health Stroke Scale; MMSE, Mini Mental State Examination; MEP−, MEP negative patients; SCC, splenium of the corpus callosum; HES, Heschl’s gyrus; SOG, superior occipital gyrus; FC, functional connectivity; PLIC, posterior limb of the internal capsule.
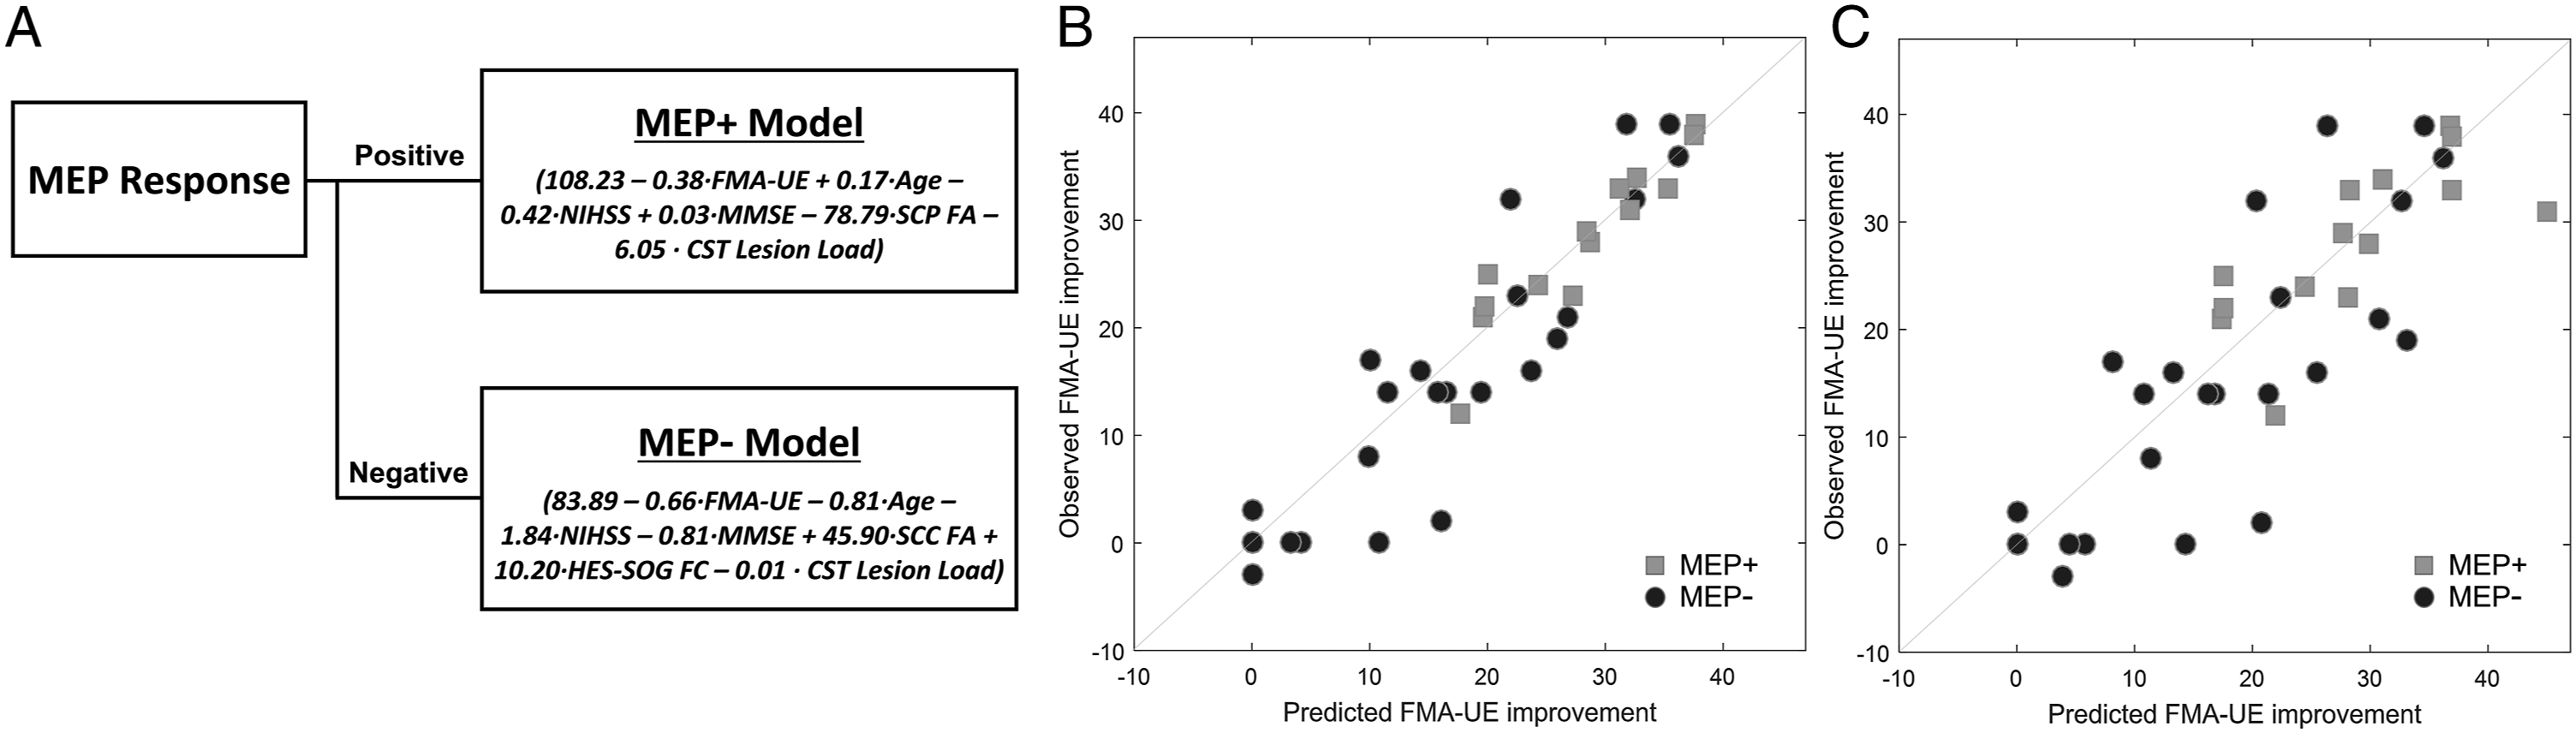
(A) Diagram of the prediction model using a stratification strategy. (B) Results predicted by the proposed model (P < .001, R 2 = .853, RMSE = 5.28). (C) Cross-validation results (P < .001, R 2 = .598, RMSE = 8.73). FMA-UE, Fugl-Meyer assessment-upper extremity; MEP, motor evoked potential; MEP+, MEP positive patients; NIHSS, National Institutes of Health Stroke Scale; MMSE, Mini Mental State Examination; SCP, superior cerebellar peduncle; FA, fractional anisotropy; MEP−, MEP negative patients; SCC, splenium of the corpus callosum; HES, Heschl’s gyrus; SOG, superior occipital gyrus; FC, functional connectivity.
The results of cross-validation are presented in Figure 3C, which shows the relationship between the predicted FMA-UE improvement obtained from the proposed model and actual FMA-UE improvement obtained from the test data (P < .001, R 2 = .598, RMSE = 8.73). This result was higher than that of cross-validation of the single model including clinical factors, representative imaging biomarkers, and MEP response (P < .001, R 2 = .405, RMSE = 10.63).
Discussion
In this study, we investigated multimodal imaging biomarkers to improve the predictive accuracy of UE motor recovery in severe stroke patients. Predictive imaging biomarkers depended on recovery pattern, and biomarkers for good and poor recovery were extracted. These biomarkers were applied to patients with different MEP responses. We established prediction models that were applicable to patients according to MEP response.
In our study, age, initial impairment, MEP response, lesion distribution, and imaging biomarkers differed between the good and poor recovery groups. Among those factors, age, initial impairment, and MEP response are representative markers related to motor recovery after stroke.6,26,27 There was a higher prevalence of old age, negative MEP response, and higher initial motor impairment in the poor recovery group compared to the good recovery group. This can be explained partially by examining imaging biomarkers. CST-related imaging biomarkers (lesion load, PLIC, CP, and SCR FA values) differed significantly between groups.
Lesion load and CST-related FA values were previously identified as primary imaging biomarkers. 6 The predictive power of PLIC, CP, and SCR FA values were similar; prior studies used those regions alone or in combination. In this study, CST-related imaging biomarkers had some but not high predictive value for all severely impaired patients. CST-related imaging biomarkers might have reached a limit as imaging biomarkers in patients with severe impairment. This indicates that CST-related imaging biomarkers alone do not adequately predict functional recovery in severe stroke patients. In the good recovery group, the SCP FA, which is a region of the cortico-cerebellar pathway, was the only biomarker with high predictive power. The cortico-cerebellar pathway is a sensorimotor pathway with reciprocal connections to motor-related regions and the cerebellum. 11 Thus, the cortico-cerebellar pathway is related to motor function after stroke9,28 and is involved in motor learning and control.10,29 In particular, fine motor skills are related to the pathway and activity of the cerebellum in both healthy people and those with stroke. 9 Therefore, it seems reasonable to use the cortico-cerebellar pathway for prediction of motor recovery. Learning fine motor skills is difficult without partial preservation of the CST, which is the principal motor pathway for voluntary movement. In the good recovery group (that showed relatively little damage to the CST), SCP was particularly valuable as a primary biomarker.
The corpus callosum is one of the pathways that conduct sensorimotor information; it has been shown to play an important role in regaining motor skills after stroke.7,8 The SCC FA was the primary biomarker in the poor recovery group. The splenium is the posterior part of the corpus callosum and consists of axonal fibers that mainly connect the bilateral temporal and occipital cortical regions. 30 The SCC is involved in transfer of visual and auditory information and integration of audiovisual information between hemispheres.31,32 In the poor recovery group, the HES-SOG FC connectivity biomarker showed the highest predictive power in our study. In addition, many of the connections between the left HES and occipital cortical regions and between the left STG and occipital cortical regions also had predictive value. In functional connectivity analysis, connectivity between the left auditory and bilateral visual areas predicted motor recovery. In other words, imaging biomarkers in the poor recovery group suggest involvement of non-motor areas in recovery when significant damage has occurred in the primary motor pathway. According to a recent study, 33 interactive connections between motor functions and other sensory functions indicate that multisensory stimulation such as virtual reality, biofeedback, and motor imagery could help patients efficiently regain motor function after stroke. Furthermore, action observation and motor execution involve both non-motor areas and motor areas such as visual, auditory, somatosensory, and affective areas. 34 The left auditory cortical regions were consistently dominant; the best biomarker in our study was connectivity between the left HES and right SOG. Sensory areas in bilateral hemispheres were specialized and lateralized. 35 The left auditory cortical regions are specialized to hear human speech and are sensitive to temporal acoustic characteristics.36,37 In addition, both speech decoding and word recognition mechanisms depend critically on the left auditory cortical regions. 38 Therefore, the left auditory cortex might be important during voluntary movement and seems dominant in regaining motor function after stroke. The SOG is a visual association area with multimodal integrating functions. 39 The right visual cortex is dominant in the processing of visual–spatial relationships. 35 The right SOG connects to auditory areas, as shown in a previous study, 40 which demonstrated that applying TMS over the right SOG interferes with sound localization abilities. Thus, the predictive imaging biomarkers in the poor recovery group indicated that the involvement of non-motor areas is important when significant damage has occurred in the motor pathway.
We investigated the usability of the examined predictive markers in clinical situations by generating prediction models after regrouping severe stroke patients according to MEP responses. Unlike the MEP+ model, the contribution of the imaging biomarkers was modest, and the clinical biomarkers accounted for the majority of variance in the MEP− model. The improvement in R 2 with addition of imaging biomarkers in MEP− patients was not statistically significant compared to using the clinical biomarkers. This result could be related to the low negative predictive value of the MEP− response. The MEP− patients included quite a few good recovery patients in our study. The presence of MEP in the UE after stroke is a good predictive marker that can be used to classify good and poor recovery groups. 1 However, the negative predictive value in the absence of an MEP response is relatively low. 41 In other words, the absence of MEP does not rule out good motor recovery. Our study revealed the same trends: the MEP− group did not accurately reflect good or poor recovery (positive predictive value of MEP− response = 92.9%, negative predictive value of MEP− response = 70.4%). This could reduce the impact of imaging biomarkers identified from poor recovery patients in the MEP− group. Additional neuroimaging studies on MEP− patients are needed to investigate supplemental biomarkers.
Ultimately, we propose a prediction model using a stratification strategy. The imaging biomarker-based prediction model proposed in this study could improve the predictive accuracy of UE motor recovery in patients with severe motor impairment. This model also can provide practical guidelines for optimal and efficient use of imaging biomarkers. However, further validation and measurement of functional status in additional patients are necessary.
Supplemental Material
sj-pdf-1-nnr-10.1177_15459683211070278 – Supplemental Material for Multimodal Imaging Biomarker-Based Model Using Stratification Strategies for Predicting Upper Extremity Motor Recovery in Severe Stroke Patients
Supplemental Material, sj-pdf-1-nnr-10.1177_15459683211070278 for Multimodal Imaging Biomarker-Based Model Using Stratification Strategies for Predicting Upper Extremity Motor Recovery in Severe Stroke Patients by Jungsoo Lee, Heegoo Kim, Jinuk Kim, Won Hyuk Chang, and Yun-Hee Kim in Neurorehabilitation and Neural Repair
Footnotes
Acknowledgments
We would like to thank the Neuroplasticity Neurorehabilitation and Imaging laboratory members for their assistance. We also thank the staff of the Department of Radiology at Samsung Medical Center.
Author Contributions
J.L. contributed to the design and conceptualization of the study, data acquisition, analysis and interpretation of data, and drafting the manuscript. H.K. and J.K. contributed to data acquisition. W.H.C. contributed to analysis and interpretation of data. Y-H. K contributed to the design and conceptualization of the study, analysis and interpretation of data, critical revision of the manuscript for important intellectual content, and final approval of the version to be submitted.
Declaration of Conflicting Interests
The author(s) declared no potential conflicts of interest with respect to the research, authorship, and/or publication of this article.
Funding
The author(s) disclosed receipt of the following financial support for the research, authorship, and/or publication of this article: This study was supported by National Research Foundation of Korea (NRF) grant (NRF-2020R1A2C3010304, NRF-2020R1C1C1011688) and by a grant from the Korea Health Industry Development Institute (KHIDI) funded by the Ministry of Health & Welfare (HI17C1501).
References
Supplementary Material
Please find the following supplemental material available below.
For Open Access articles published under a Creative Commons License, all supplemental material carries the same license as the article it is associated with.
For non-Open Access articles published, all supplemental material carries a non-exclusive license, and permission requests for re-use of supplemental material or any part of supplemental material shall be sent directly to the copyright owner as specified in the copyright notice associated with the article.