
Abstract
People with hemiparesis after stroke appear to recover 70% to 80% of the difference between their baseline and the maximum upper extremity Fugl-Meyer (UEFM) score, a phenomenon called proportional recovery (PR). Two recent commentaries explained that PR should be expected because of mathematical coupling between the baseline and change score. Here we ask, If mathematical coupling encourages PR, why do a fraction of stroke patients (the “nonfitters”) not exhibit PR? At the neuroanatomical level of analysis, this question was answered by Byblow et al—nonfitters lack corticospinal tract (CST) integrity at baseline—but here we address the mathematical and behavioral causes. We first derive a new interpretation of the slope of PR: It is the average probability of scoring across remaining scale items at follow-up. PR therefore breaks when enough test items are discretely more difficult for a patient at follow-up, flattening the slope of recovery. For the UEFM, we show that nonfitters are most unlikely to recover the ability to score on the test items related to wrist/hand dexterity, shoulder flexion without bending the elbow, and finger-to-nose movement, supporting the finding that nonfitters lack CST integrity. However, we also show that a subset of nonfitters respond better to robotic movement training in the chronic phase of stroke. These persons are just able to move the arm out of the flexion synergy and pick up small blocks, both markers of CST integrity. Nonfitters therefore raise interesting questions about CST function and the basis for response to intensive movement training.
Introduction
The proportional recovery (PR) rule was first observed in the context of upper extremity (UE) movement using the Fugl-Meyer (FM) score, 1 a widely used impairment-based measure in stroke rehabilitation research, and then confirmed in larger samples.2-4 Samples of patients were evaluated at 1 week and at follow-up (typically 3 or 6 months) and most (the so-called “fitters”) recovered on average 70% to 80% (depending on the study) of the difference between their baseline and UEFM score and the maximum UEFM score (Figure 1A). The rule is:

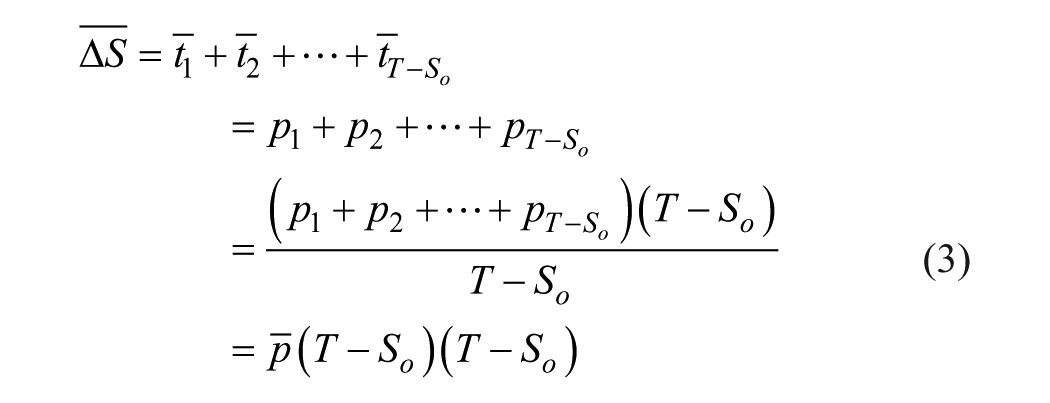
where ∆S is the mean change in score for all subjects with a baseline score of
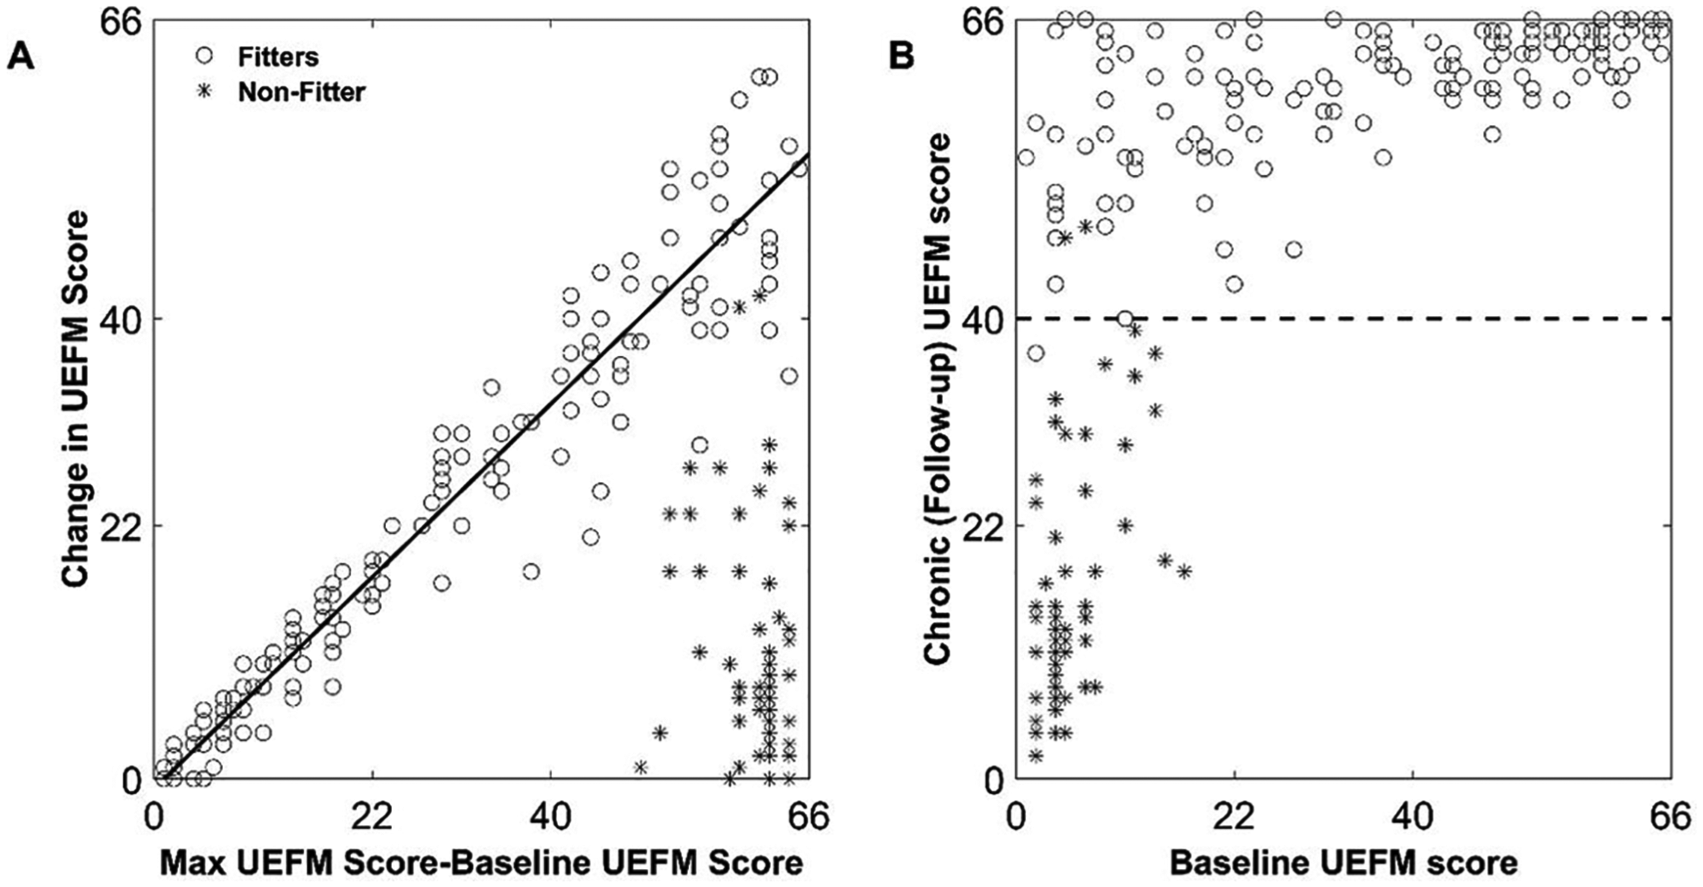
Proportional recovery of the upper extremity Fugl-Meyer (UEFM) score after stroke. These plots combine data that we digitized from reported data of 214 subjects enrolled in 2 studies.2,3 Baseline scores were measured within 2 weeks poststroke and follow-up at 6 months (chronic stage) (A) For “fitters” (o), the average change in UEFM score is proportional to how many points a patient has left to recover (ie, the maximum UEFM score of 66 minus the baseline UEFM score). “Nonfitters” (*) show decreased recovery. (B) By plotting the same data another way (ie, showing the relationship between chronic [follow-up] UEFM score and baseline UEFM score), it is apparent that 99% of patients with a chronic UEFM score less than 40 (dashed line) in the chronic stage are nonfitters.
Predictions of stroke recovery are multifactorial and highly variable,
6
so the finding of such a regularity, especially one driven by a single impairment-based input and present for a wide variety of outcome measures, is striking and even mathematically suspicious, or in the words of Hawe et al,
5
“ too good to be true.” Indeed, Hawe et al
5
and Hope et al
7
recently used statistical analysis and simulation to demonstrate that a PR-like relationship arises even if outcomes are unpredictable and recovery is random. Mathematical coupling between ∆S and
But if mathematical coupling encourages PR, then why does PR not arise for a particular subset of stroke patients—the “nonfitters”—who recover less than that predicted by PR? At the neuroanatomical level of analysis, this question has already been elegantly answered: Lack of corticospinal tract (CST) integrity strongly predicts nonfitters.3,4,8-10 The first to demonstrate this were Byblow et al 3 who used motor-evoked potentials (MEPs) and found that individuals who at baseline evaluation did not have an MEP response (ie, who were “MEP−”) were highly likely to be the nonfitters. Stinear et al 4 confirmed this predictive value of MEP in a larger sample.
Here, we sought to gain mathematical and behavioral insight into the rule breakers of PR by analyzing the rule in terms of the way the UEFM score is constructed—as a sum of subscores on a series of test items—and determining how the ability to score on those items at follow-up mathematically influences PR. We also queried the effect of rehabilitation for fitters and nonfitters by analyzing data from robotic UE training.
Preliminary Observations
We digitized reported data from 214 subjects enrolled in 2 studies2,3 for analysis here. The inclusion criteria for both studies were (see Table S1 in the Supplemental Material for more detail): (1) first ever ischemic stroke: anterior circulation
2
/monohemispheric,
3
(2) assessments within 2 weeks of stroke, (3) no severe cognitive or communication impairment, (4) no severe mobility and daily activity impairment (premorbid Barthel Index of
The second preliminary observation has to do with identifying nonfitters. It is not possible to reliably identify nonfitters using their baseline UEFM alone.2,9-11 Individuals with lower initial UEFM are not necessarily the nonfitters, as can be seen in Figure 1A. However, importantly for our analysis here, it is possible to identify nonfitters when they reach the chronic stage of recovery using an UEFM threshold of about 40. Ninety-nine percent of patients with a chronic UEFM score less than 40 in the chronic stage are nonfitters, as seen in Figure 1B. That is, fitters nearly always recover to an UEFM greater than 40. We will use this observation below in several analyses.
Interpreting the PR Rule in Terms of Scale Construction
We first analyze PR for scales that are calculated by summing subscores on a set of items (such as the UEFM score). We show that PR arises robustly for such scales (as expected because of mathematical coupling5,7), and that the slope has a probabilistic interpretation related to scale construction. We also show that the local slope is not constant for previously reported UEFM PR data, consistent with this probabilistic interpretation. Finally, PR is broken (producing nonfitters) when a substantial number of scale items are discretely more difficult to score on at follow-up for some patients. Finally, we identify the specific UEFM test items that nonfitters have the lowest probability of being able to perform.
Constructing an Outcome Measure
Assume we evaluate recovery at two time points (baseline and follow-up) using a measure that is composed by adding
Now, assume that at the follow-up the subscore for each remaining item

Now, imagine designing an outcome measure—what should one design the IRPF’s look like? A common strategy in scale design is to observe a sample of patients at baseline and then follow them; this appears to be how the UEFM scale was developed. 12 Based on observations and some theoretical basis for a patient’s evolving capabilities (such as a progression out of abnormal synergies for the UEFM scale 12 ), one then designs a set of test items such that there is a finite probability that some fraction of subjects will be able to do each item at follow-up. Ideally, these probabilities will vary across items, creating a range of items from easy to difficult. Indeed, in one formal approach to scale development, Rasch analysis, scales are designed so that the probabilities of achieving items are spaced across the range of ability measured over a sample of recovered subjects. 13 When Rasch analysis is applied to the UEFM scale, it shows that the UEFM items span a range of difficulties and can be rank-ordered in terms of those difficulties. 14
Figure 2A shows a set of theoretical IRPFs with the number of test items T = 33, matching the UEFM scale. The lower curves represent more difficult items. The probabilities increase with increasing baseline score (ie, decreasing remaining items to score on), capturing the intuition that patients who are better recovered at baseline have a higher chance of scoring on items at follow-up.
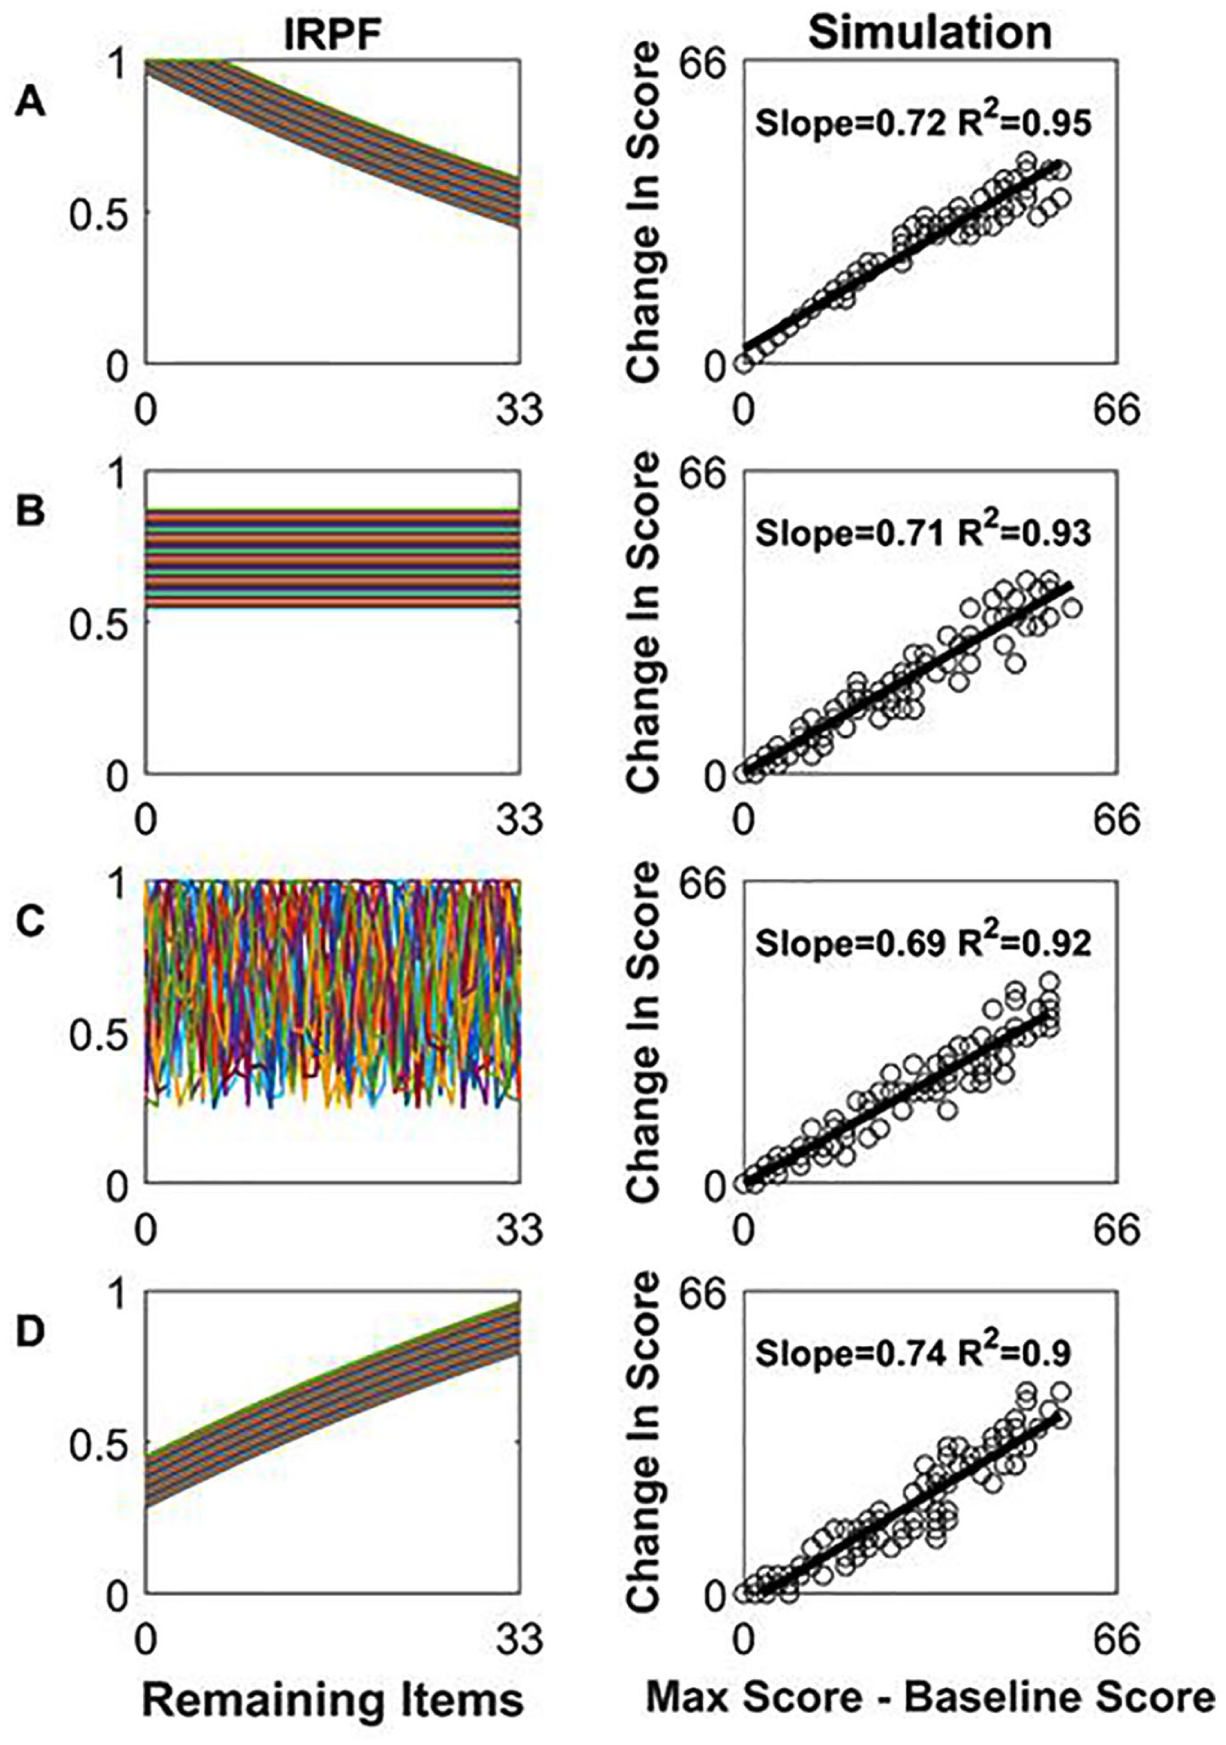
Proportional recovery (PR) arises robustly from simulations using a variety of item recovery probability functions (IRPFs). Left column: Examples of IRPFs, the functions that define the probability of scoring on an item at follow-up given the number of remaining items left to score on. Each line is the IRPF for a different item, for a test composed of 33 items scored 0 or 2. Right column: Recovery results from simulating 120 patients. As can be seen, a variety of IRPFs produce a PR-like relationship, which is expected given mathematical coupling.
Simulating Recovery
Given a set of IRPFs, we can simulate recovery. To produce a total score equal to that possible with the UEFM scale (ie, 66 points), we assumed the 33 items could be scored a 0 or a 2. We used a uniform initial distribution of baseline scores
How dependent is the PR-like behavior on the shape of the IRPFs? We ran the simulation with several types of IRPFs:
Bending PR: The Local Slope
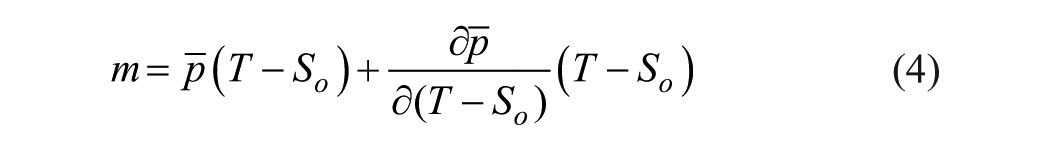
We can gain insight into why PR rises robustly for a wide range of IRPFs by estimating the slope of the PR curve. Returning to the case when only scores of 0 and 1 are possible, the mean increase in score from Equation (2) is:
Equation 4 can be solved assuming a constant m, resulting in a family of functions shifted by an arbitrary constant. Thus, an infinite number of
First, note that if the IRPFs vary smoothly across
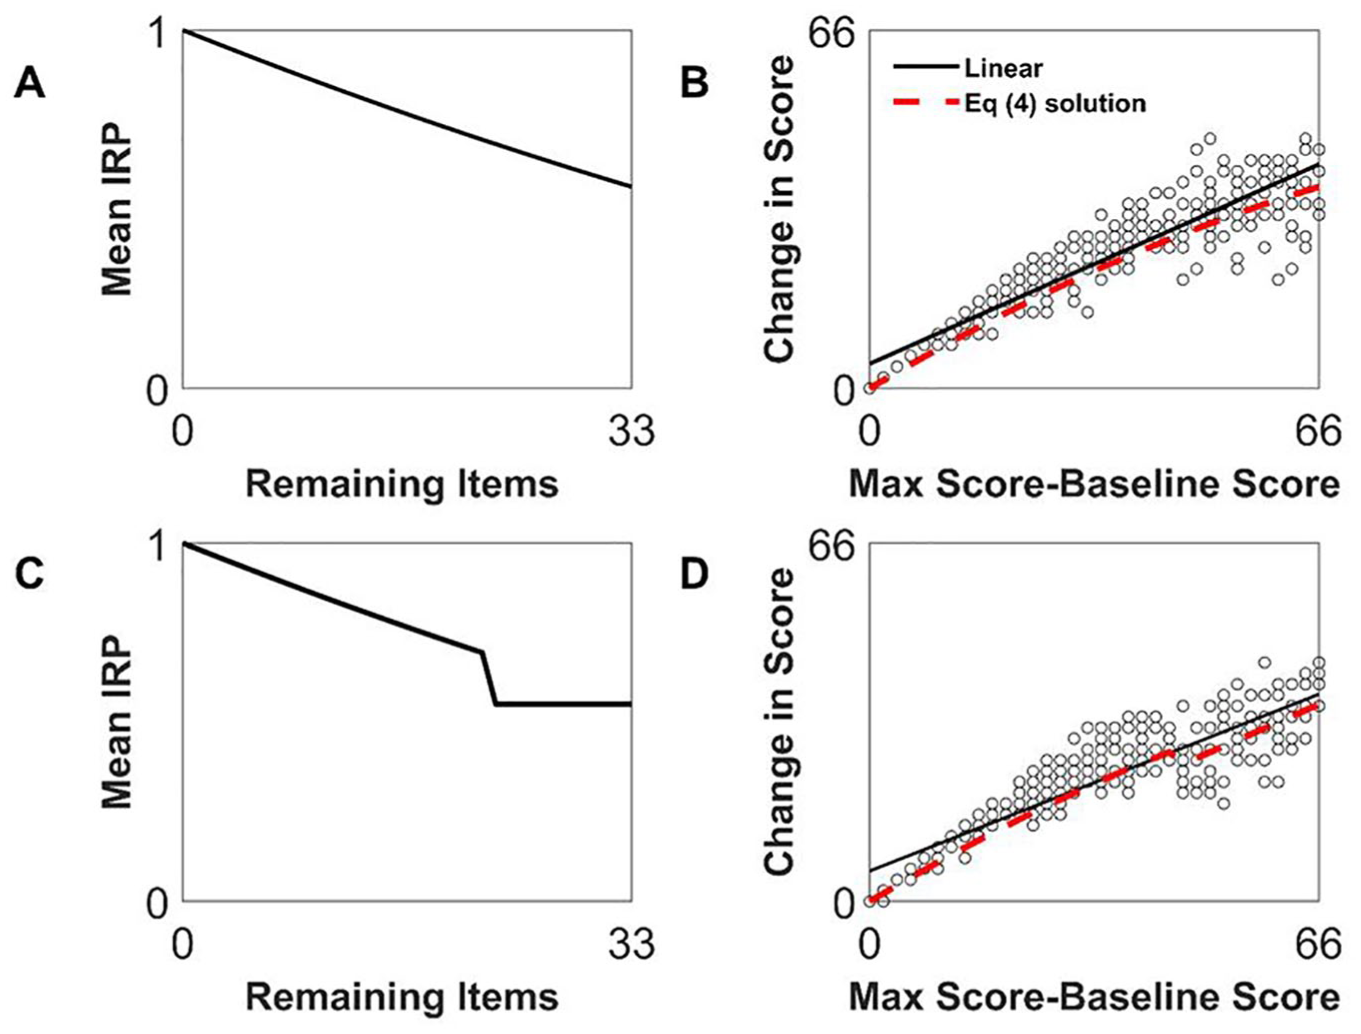
Bending and breaking proportional recovery. Shown is the relationship of average item recovery probability function (IRPF, left column) and recovery (right column). In the top row, the average IRPF is smooth but not constant, and produces a nonlinear relationship that is nevertheless well fit by a linear regression (solid line, R2 = 0.88). The red dashed line shows the predicted fit from Equation 4. In the bottom row, the average IRPF is discontinuous, but the resulting recovery relationship does not look discontinuous, but rather just somewhat nonlinear, and again is still well fit by linear regression (R2=0.83), although the local slope varies as Equation 4 (red dashed line).
If
It is well established in statistics that it is difficult to discern local slope variations with noisy data and/or a limited sample size. Furthermore, global linear regression, which is the only method that appears to have been applied to detect PR, is ill-suited for detecting nonlinearity. 15 We therefore suggest that the proportionality of PR, besides arising from mathematical coupling, is also an approximation that arises partly because of the smoothness of the average IRPF, and partly because global linear regression cannot detect local slope variations.
We used local linear regression to estimate if the local slope of PR varies for different impairment levels. The local slope is the slope of a line fitted to a subset of the data, where the subset of data is selected as the data points (ie, patients) that fall in a window of size 20 along the x-axis. We shifted the window along the x-axis to estimate the slope for different data subsets.
Figure 4 shows that the local slope estimate varies from 0.0 to 1.0, in a similar pattern for 2 different data sets and is not constant as would be expected for exact proportionality across impairment levels (Equation 3). Note that the local slope estimated in the windows over impairment level of 46 to 66 (ie, initial UFEM < 20) is smaller (Figure 4C). This is consistent with the expectation that average recovery probability
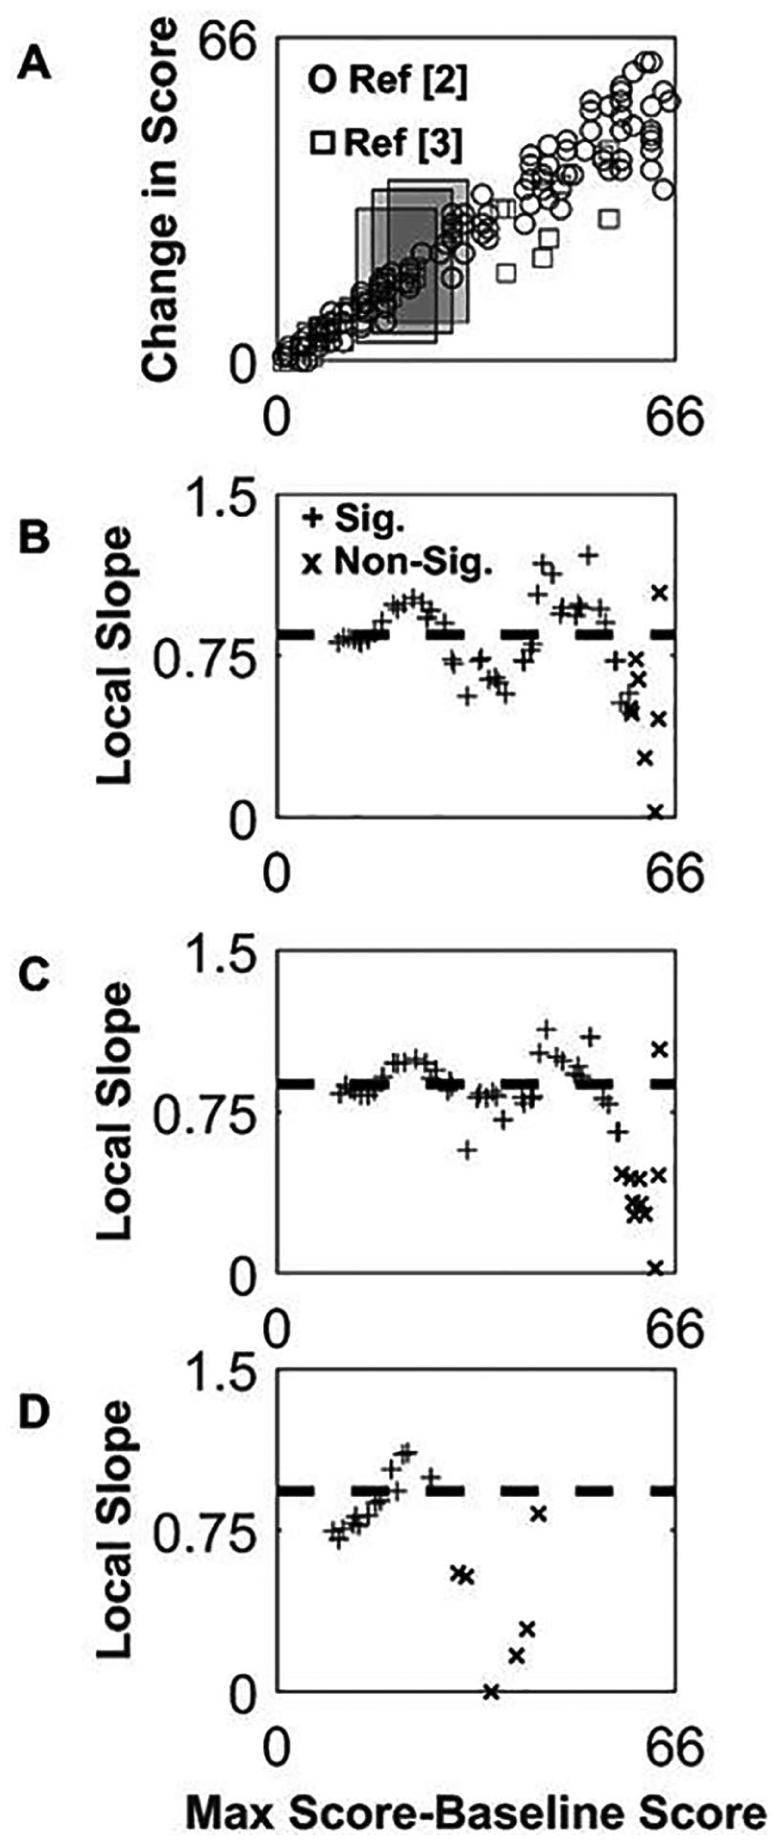
Estimating the local slope of recovery using local linear regression. (A) Upper extremity Fugl-Meyer (UEFM) recovery data from Winters et al 2 (circles) and Byblow et al 3 (squares) shown with sample windows (20 UEFM points wide) used to create the local estimate of slope (gray rectangles). For the data points (ie, subjects) falling within each window, we performed a regression to estimate the slope for those data points alone (ie, the “local slope”). (B) Local slope estimated with the linear regression over each window for the data combined from.2,3 (C) Local slope from Winters et al 2 alone, with window size of 20 UEFM points. (D) Local slope from Byblow et al 3 alone, with a window size of 20 UEFM points. Plus (+) signs show points for which the P-value of the local regression <.05, and “×” where the P >.05. Horizontal dashed line shows slope from global regression. Note that the global regression slope result is dictated by the data from the individuals with higher baseline scores because their data are less variable.
Breaking PR: Nonfitters
What are the mathematical conditions needed to create nonfitters who break the PR rule, given the various statistical factors working positively toward creating an appearance of PR? Working with our simulator, we found that if we set recovery probabilities for a substantial number of items to a low value for a specific set of subjects with a baseline score below some score (ie, we made a set of items extremely difficult for those low-level subjects, Figure 5A and C), then those subjects recovered poorly in the simulation, and they appeared as nonfitters (Figure 5B and D).
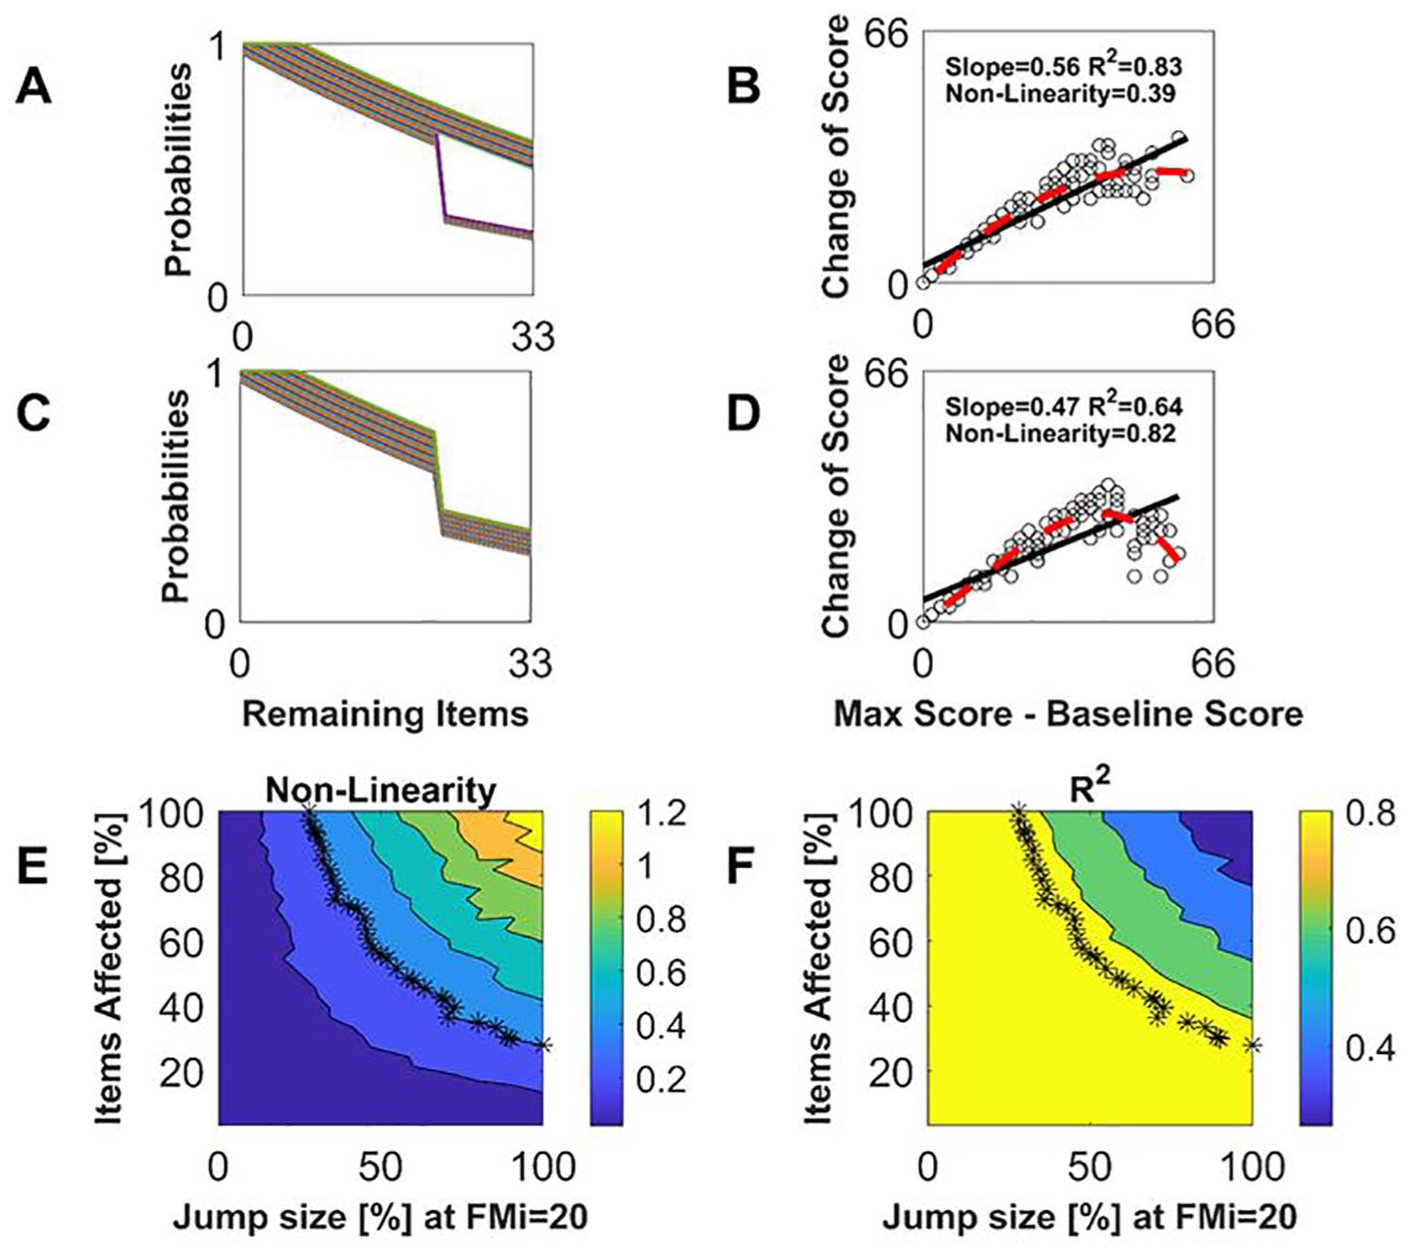
Relationship between item recovery probability function (IRPF) nonlinearities and nonfitters. A great enough jump nonlinearity in a great enough number of the IRPFs creates a nonlinearity in the proportional recovery (PR)–type relationship, even though the nonlinearities are smoothed by the summation associated with calculating a total score. (A) Sample IRPFs with 50% jump nonlinearities in 30% of the items. (B) PR plot resulting from IRPFs in A. The nonlinearity measure was quantified as
To quantify how substantial the IRPF discontinuities have to be to produce a visible nonlinearity, we simulated the situation were P% of the IRPFs, starting with the most difficult items, exhibited a jump decrease by D% at
Achieving an NL = 0.4 required at least ~50% jumps in at least ~50% of the items (Figure 5B and E). R2 values were always greater than 0.8 for simulations with NL = 0.4 (Figure 5F), confirming that linear regression statistics were poor at signaling the emerging nonlinearity. 15
Very Difficult UEFM Items for Nonfitters
Given that very difficult items can “break” PR, what are the very difficult items for the nonfitters of the UEFM at follow-up? As observed above, 99% of patients with a UEFM score less than 40 in the chronic stage are nonfitters. We used UEFM measurements from 319 chronic stroke patients reported in several studies18-25 to rank-order items from low to high probability of scoring on that item (either 1 or 2), using the estimated probabilities at UEFM = 40 to create the rank ordering. We found that individuals with chronic UEFM < 40 (ie, nonfitters) had the lowest probabilities on the items that required distal coordinated movement (Figure 6). These “very difficult” items tested the ability to move distal joints (wrist circumduction, wrist stability, forearm pronation/supination, wrist flexion/extension, grasp A—that is, “pretend you are holding the handle of a brief case” and grasp B—that is, abducting the thumb to grasp a piece of paper), to actively flex the shoulder through the extreme of its range of motion (shoulder flexion from 90° to 180°) without bending the elbow, and to make repeated high-speed targeted reaching movements without vision (ie, the finger-to-nose movement item of the UEFM test). The 2 remaining wrist/hand items were easy/medium, but the easy one only required mass flexion of the hand, and the medium one required flexion of the wrist, without requiring control over other joints or active extension of the fingers or wrist. That is, “in-synergy” UEFM items were relatively easy for these nonfitters to achieve, in contrast to the items requiring distal coordinated movement (Figure 6).
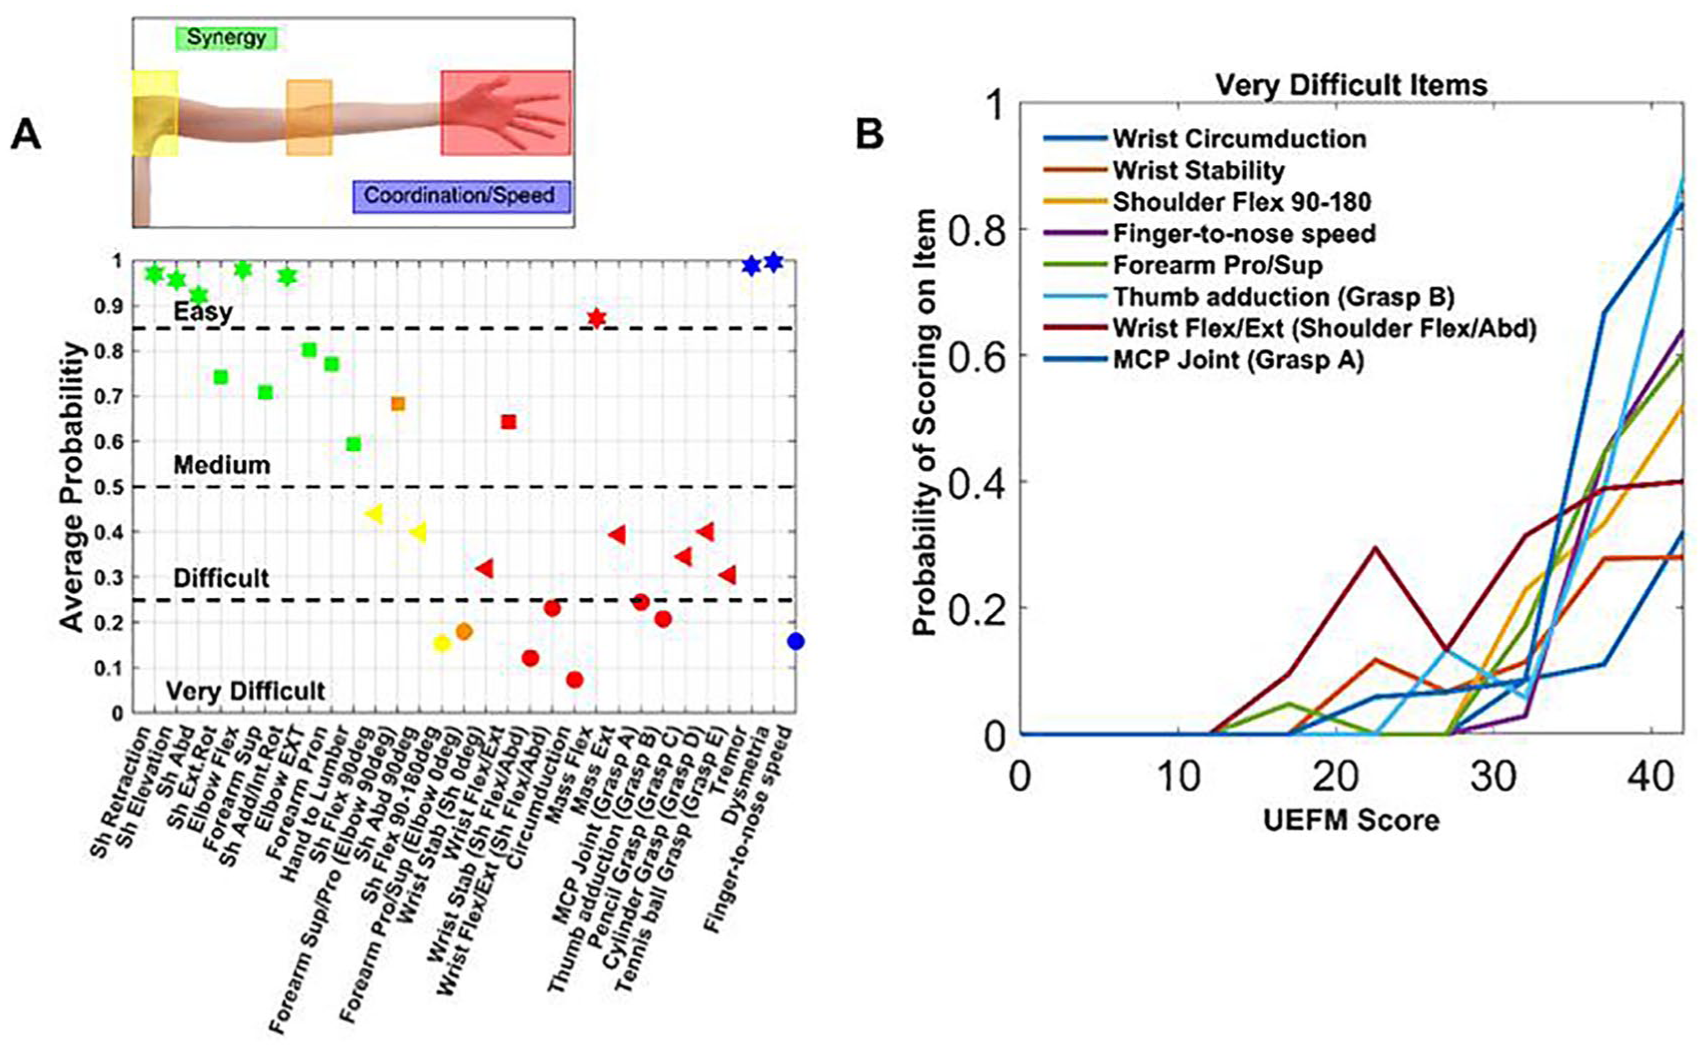
Analysis of difficulty on scoring on items of the upper extremity Fugl-Meyer (UEFM) assessment. (A) Average probability of scoring either 1 or 2 on each UEFM item for nonfitters taken as a group (ie, subjects with follow-up UEFM scores <40). The 3 reflex test items were excluded as all recorded subjects scored 1 or 2 on these items. We categorized item difficulty based on the probability of scoring on the item. We also highlight the type of movement tested: synergistic movement (green), shoulder (yellow), elbow (orange), wrist + hand (red), and UE tremor/coordination/speed (blue). (B) Probability of scoring on the very difficult items as a function of chronic UEFM score. Items are listed from most difficult to easiest in the legend, top to bottom.
Summary
To summarize, we derived a new interpretation of the slope of PR: It is the average probability of scoring across remaining scale items at follow-up. The proportionality of PR, besides arising from mathematical coupling, is also an approximation that arises because of the smoothness of the average IRPF, and because global linear regression cannot detect local slope variations. The local slope estimate varies substantially in a consistent pattern for 2 different published UEFM recovery data sets—a result not predicted by mathematical coupling, but understandable from the scale construction perspective. Finally, what is required to overcome these mathematical phenomena that encourage the appearance of PR is that a patient must exhibit discretely lower probability of scoring on a substantial subset of test items at follow-up. We showed that UEFM nonfitters are most unlikely to score on test items related to wrist/hand dexterity, extreme active shoulder range of motion, and finger-to-nose speed at follow-up. This is consistent with the idea that nonfitters lack sufficient CST, since CST is thought to be the neural substrate for these types of hand and arm movements.26,27
How Do Nonfitters Respond to Rehabilitation?
One possible implication of PR is that rehabilitation therapy does not matter because patients follow the PR prediction despite varying amounts of therapy.3,28 However, Hawe et al 5 highlighted that there is substantial variability in UEFM recovery even for the fitters. The number of fitters displaying ≈70% recovery is near chance levels. Nonfitters have even greater variability of recovery (Figure 1), leading us to hypothesize that they are particularly responsive to the varying amounts of movement training they receive during rehabilitation.
To test this hypothesis, we returned to an analysis of UEFM response to robotic UE therapy in the chronic phase of stroke. 29 We grouped patients based on UEFM scores at study entry that fell into 3 zones: [0-21], [22-40], or [41-66]. Interestingly, these groups correspond to poorly recovered nonfitters, better-recovered nonfitters, and fitters, respectively, in the acute phase studies (Figure 7A, data taken from Winters et al 2 and Byblow et al 3 ). Here we make the assumption that people who qualified for a robotic therapy study in the chronic phase and had a UEFM score <40 would have been classified as nonfitters had they been tracked from the acute phase. It may be that there is a different pattern of upper extremity recovery that has not yet been identified for the type of patient who would not have qualified for PR studies, but then qualified for a chronic robotic therapy study (see Supplemental Material). However, in examining the inclusion/exclusion criterion for the chronic robotic therapy studies, we found they were similar to the PR studies (Table S1, Supplemental Material). Where the criteria deviated (such as not requiring a first-ever anterior circulation stroke), a recent study examining a broader, more clinically relevant sample of patients with stroke, including those with intracerebral hemorrhage and previous stroke found the same pattern of upper extremity PR (the pattern of fitters and nonfitters) and the same predictive value of MEP. 4 Thus, we feel the assumption that participants with chronic UEFM score <40 would have been classified as nonfitters is reasonable, although it should be verified in future research.
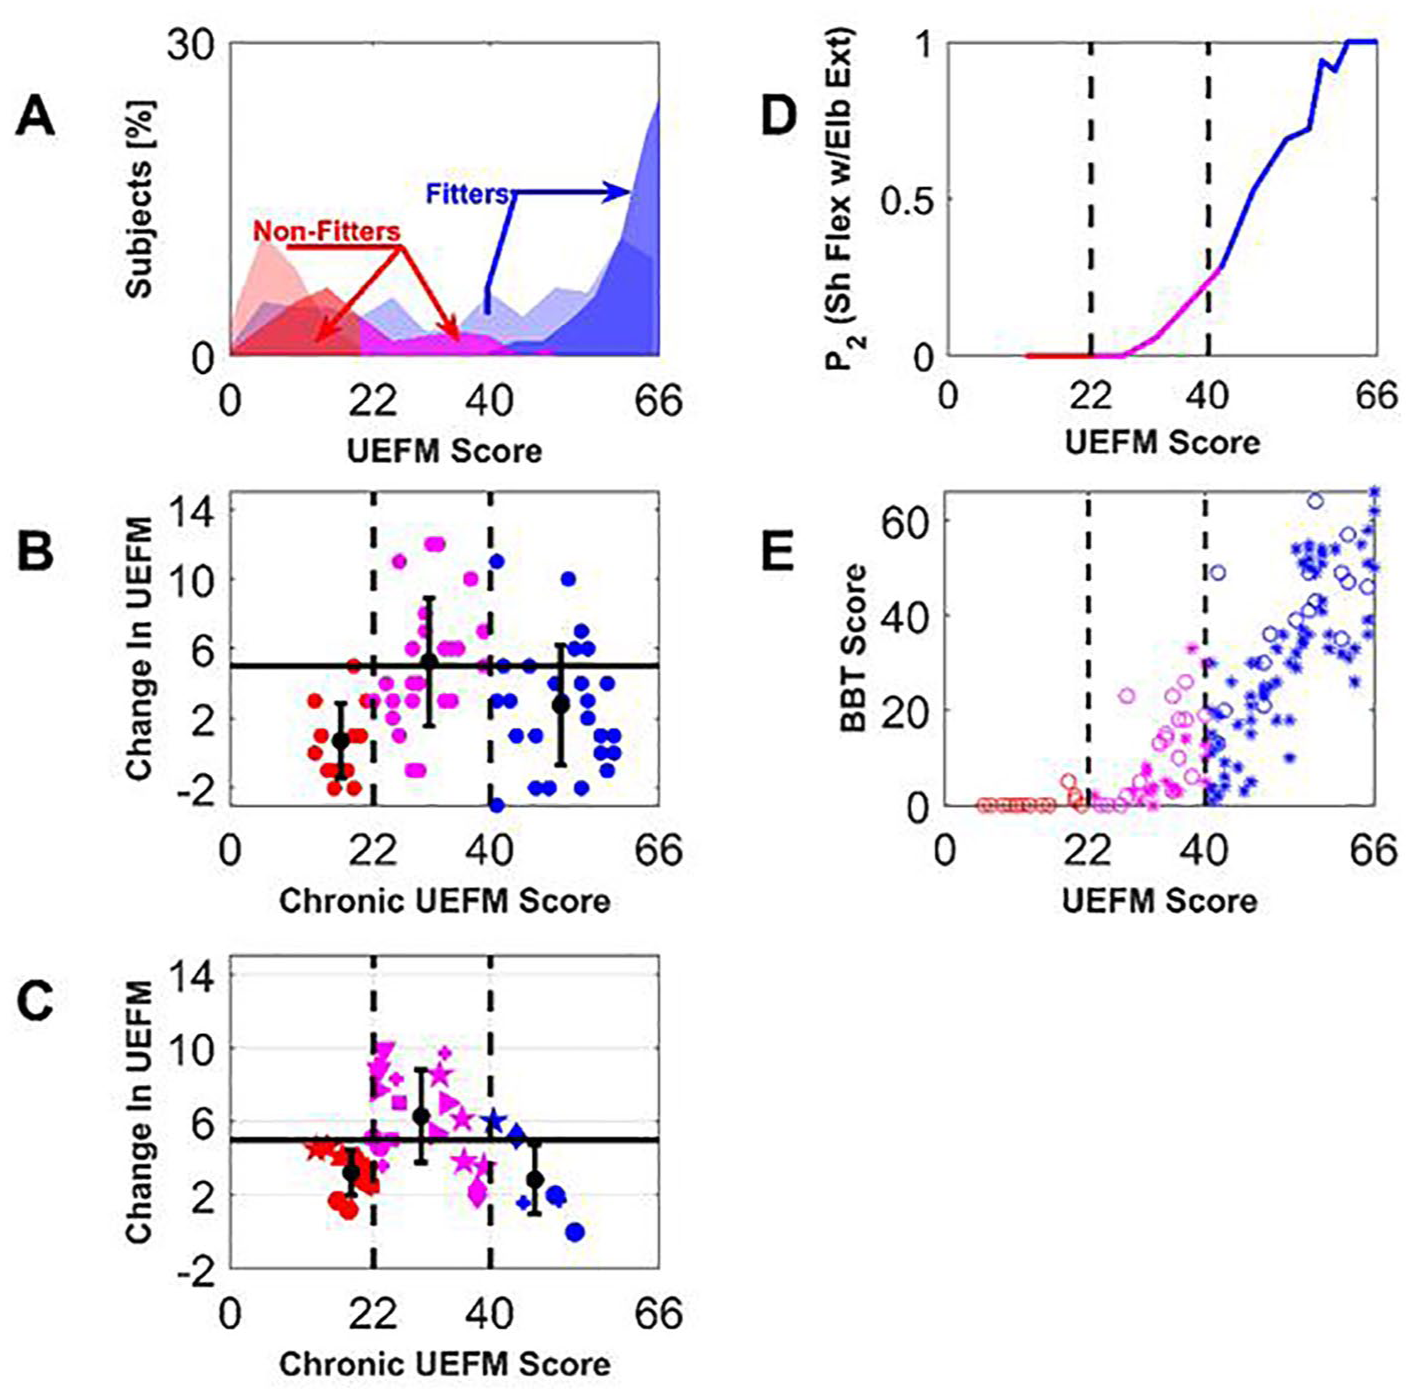
Analysis of a special group of nonfitters who respond better to intensive upper extremity (UE) movement training provided in the chronic phase of stroke. (A) Distribution of patients (% out of total 214 patients reported in Winters et al 2 and Byblow et al 3 ) at baseline (light colors) and follow-up (dark colors), “fitters” (blue) and “nonfitters” (red, poor recovery; magenta, better recovered). (B) Change in upper extremity Fugl-Meyer (UEFM) score after UE robotic movement training as reported in our previous work. 29 The better-recovered nonfitters showed an increased UEFM response to robotic movement training (ANOVA, P < .001, with follow-up t tests, group 1-2 comparison P = .001, group 2-3 comparison P = .015; group 1-3 comparison P = .03). (C) Mean change in UEFM score reported for control and experimental groups in 18 robotic rehabilitation clinical trials with chronic stroke patients (studies21,31-47 taken from the systematic review 30 ). Treatment groups included conventional therapy, functional electrical stimulation, and robot-assisted arm training. Matching symbols indicate groups from the same studies. For B and C, the horizontal solid line shows the minimal clinically important difference (MCID) for the UEFM test, the vertical dashed lines denote how we subdivided the subjects into 3 UEFM zones. The groups with mean starting UEFM score in the middle zone again had a significantly higher mean change in UEFM score (ANOVA, P < .001, with follow-up t tests, group 1-2 comparison P < .001, group 2-3 comparison P = .0013; group 1-3 comparison P = .56). (D) Estimated probability to score “2” in the UEFM test item testing shoulder flexion from 0° to 90° with the elbow fully extended, plotted as a function of UEFM score. As described in the text, this is based on data from 319 subjects from several studies.18-25 Subjects with UEFM in the range [22-40] (ie, the rehabilitation responsive nonfitters) are the ones just able to perform this out-of-flexion-synergy movement. (E) Box and Blocks Test (BBT) score as a function of the UEFM based on data from several studies.22,25,50 Subjects with UEFM in the range [22-40] also are the ones predicted to just able to grasp and release blocks on the BBT. Here, we identified the underlying relationship between motor performance on the UEFM and the BBT in order to estimate BBT scores from UEFM scores.
For each group, we calculated the mean reported change in UEFM score due to robotic rehabilitation. Nonfitters with mean baseline UEFM scores in the range [22-40] benefited significantly more from rehabilitation delivered in the chronic phase after stroke (Figure 7B, ANOVA, P < .001, with follow-up t tests, group 1-2 comparison P = .001, group 2-3 comparison P = .015; group 1-3 comparison P = .03).
We sought to test this finding using data from a larger number of studies. We therefore analyzed the rehabilitation response of nonfitters using results from a set of randomized controlled trials of robotic and conventional rehabilitation therapy reported in a systematic review. 30 We considered the studies that enrolled persons in the chronic phase after stroke, leaving 18 trials.20,31-47 We sorted results from these studies into groups with reported mean UEFM scores at study entry that fell into 3 zones: [0-21], [22-40], or [41-66].
These groups again correspond to poorly recovered nonfitters, better recovered nonfitters, and fitters, respectively (Figure 7A, data taken from Winters et al 2 and Byblow et al 3 ).
For each group we calculated the mean reported change in UEFM score due to rehabilitation of any kind (ie, robot or control therapy).
Participants with mean baseline UEFM scores in the range [22-40] (ie, the better-recovered nonfitters) again benefited significantly more from intensive movement practice in the chronic phase after stroke (Figure 7C, ANOVA, P < .001, with follow-up t tests, group 1-2 comparison P < .001, group 2-3 comparison P = .0013; group 1-3 comparison P = .56).
Note that the distribution of patients becomes increasingly bimodal as recovery progresses, with the better-recovered fitters in the “bottom of the well” of this distribution (Figure 7A). Thus, the better-recovered nonfitters are somewhat scarce: they are ~12% of all stroke patients enrolled in the PR trial data we scanned, and 45% of the nonfitters.
As described above, the lowest probability UEFM items for nonfitters are the ones that require hand and arm dexterity, consistent with lack of CST integrity. But perhaps these better-recovered, rehabilitation responsive nonfitters have return of CST integrity. From the perspective of abnormal synergies, a litmus test of CST integrity is the ability to flex the shoulder to 90° while keeping the elbow fully extended48,49—that is, the test of “out-of-flexion-synergy” movement on the UEFM. We plotted the probability of scoring a “2” on the test as a function of UEFM score, again for 319 chronic stroke patients.18-25 Figure 7D shows that this probability becomes nonzero in the UEFM range of better recovered nonfitters, consistent some return of CST function.
Return of CST function should also be associated with return of hand function. The UEFM coarsely grades hand impairment and does not test hand function, so we turned to the Box and Blocks Test (BBT). The BBT requires individuals to pick up small blocks and place them over a divider and is thus a functional measure designed to be sensitive to the return of dexterity. We used published data from 140 subjects22,25,50 with both BBT and FM scores to define the underlying relationship between these 2 motor scales. Using this relationship, we found that the better recovered nonfitters would be expected to exhibit a small amount of hand dexterity on the BBT (Figure 7E). Thus, the putative rehabilitation-responsive nonfitters, who are known to be MEP− at baseline due to the work of Byblow et al, 3 appear to be the patients in the chronic stage who can begin to move the arm out of synergy and pick up small blocks, both markers of some CST integrity.
Discussion: Point of View and Directions for Research
Mathematical coupling, as well as other statistical factors identified here, encourage the appearance of PR, and yet a fraction of stroke patients, the nonfitters, do not exhibit PR. We showed that the local slope of PR relates to test item difficulties. Thus, PR breaks when a patient has a discretely lower probability of scoring on a substantial fraction of test items at follow-up. For the UEFM, the lowest probability items are the ones that test wrist/hand dexterity, extreme active shoulder flexion, and high-speed finger-to-nose movement, consistent with the finding that nonfitters lack CST integrity.3,4,8-10
Winters et al 2 found that lack of finger extension within 72 hours poststroke was the best behavioral predictor of nonfitters. The present results highlight that nonfitters continue to do poorly on tests of hand dexterity, and also arm coordination, and this is why they overcome the influence of mathematical coupling.
However, better-recovered nonfitters appear to exhibit significantly enhanced UEFM response to robotic UE movement training, given the assumption that people who qualified for a robotic therapy study in the chronic phase and had an UEFM score <40 would have been classified as nonfitters had they been tracked from the acute phase (see Supplemental Material for an analysis of this assumption). A related result was recently noted in an analysis of reaching rehabilitation in a rat stroke model in the subacute phase (n = 123 rats). 51 A subset of rats classified as nonfitters responded better to reaching practice. Fitters recovered the ability to recover food pellets regardless of whether they performed reaching practice. Thus, intensive movement practice mattered for the nonfitters but not the fitters.
In the context of the UEFM, what could explain the heightened responsiveness of better-recovered nonfitters to movement practice? One possibility is that the UEFM scale is nonlinear, making it easier to score larger gains when starting from the middle range of the UEFM. Our analysis of the UEFM scale does not support this—it is more difficult to score on items when one starts from the middle range (see Figure 4). Furthermore, the UEFM has a very small floor effect and the ceiling effect is also small52,53 and unlikely to constrain recovery for people with scores in the range 40 to 50, since the UEFM can go up to 66 and is linearly related to BBT in the range 40 to 50 (and beyond see Figure 7E). Yet subjects in this range of 40 to 50 nonetheless showed relatively decreased rehabilitation response (see Figure 7B and C). Another possibility is that individuals in the chronic phase of stroke experience a decay in their UEFM over time due to disuse of the UE. Thus, when people in the chronic phase of stroke were enrolled in the movement training studies analyzed here, they may have simply overcome that decay. Studies that tracked motor function after stroke for years have indeed sometimes found a decay in UEFM or other UE motor scores,54,55 but at other times have not.56,57 Neither of these alternate explanations account for the related finding from the rodent study, since the outcome measure there was not the UEFM (it was pellets retrieved) and the rats received rehabilitation soon after the induced stroke, not in the chronic stage.
Do a subset of nonfitters therefore defy the expectation of a poorer response to UE rehabilitative movement training that has been associated with higher amounts of CST damage.58-60 Perhaps these nonfitters rely on cortical plasticity to make use of residual pathways 10 such as brainstem pathways.48,61,62 Another possibility is that these subjects have some residual CST integrity. Transcranial magnetic stimulation–based assays of CST integrity might miss detecting small amounts of residual CST early after stroke, or, alternatively, some level of neural reorganization might need time to occur and allow a small amount of residual CST to become functional. Our findings regarding the emergence of out-of-flexion-synergy arm movement and hand manipulation in the rehabilitation- responsive, nonfitter population support this idea, as these are behavioral markers of CST integrity. Byblow et al 3 found that 6 of the 11 initially MEP− participants recovered MEPs at later evaluations. Birchenall et al 63 also found recovery of MEP. In the study by Byblow et al, 3 MEP− participants also showed some recovery if fractional anisotropy of the CST was small, suggesting residual CST without initial MEP. This finding is supported by a later study of Buch et al 11 but not that of Doughty et al. 64 Stinear et al 4 also showed that MEP− patients had greater UEFM recovery if they had lower lesion load to the CST, consistent with the results reported by Feng et al. 9
We recently found that chronic stroke patients did not respond to robotic hand movement training if they lacked somatosensory integrity. 65 Somatosensory integrity was indeed the strongest predictor of rehabilitation response in this context, stronger than CST integrity. 66 This highlights the fact that damage to other tracts and systems play a key role in determining response to intensive hand movement training. Somatosensory integrity might be required to effectively carry the feedback necessary to drive CST-related plasticity. In this scenario, perhaps it is the initially MEP− but bettered-recovered and rehabilitation-responsive nonfitters who have this somatosensory integrity.
If a small amount of CST, initially unresponsive to transcranial magnetic stimulation, serves as the basis for an increased response to movement training, it is unclear why people with presumably a greater amount CST integrity—the lower level fitters (with chronic UEFM in the range 40-50)—have a relatively reduced response to intensive movement training. Perhaps fitters make progress through spontaneous limb use, making any applied training appear less effective. In contrast, the special population of nonfitters might need to learn to make use of their small amounts of residual CST by performing especially large amounts of dedicated, practice-based exploration.67,68 Work from our laboratory on robotic exoskeleton training is consistent with this idea, in that it found that people in the chronic phase of stroke who were MEP+, but with smaller rather than larger MEP, responded better to UE robotic movement training. 69 In any case, an important direction for future research is to determine how best to identify this putative special class of nonfitters as early as possible after stroke, since they may be the best candidates for intensive movement training, robotic or otherwise, if one is interested in selecting candidates who will have the largest UEFM change from the training.
Supplemental Material
Supplemental_Material – Supplemental material for Breaking Proportional Recovery After Stroke
Supplemental material, Supplemental_Material for Breaking Proportional Recovery After Stroke by Merav R. Senesh and David J. Reinkensmeyer in Neurorehabilitation and Neural Repair
Footnotes
Declaration of Conflicting Interests
The author(s) declared the following potential conflicts of interest with respect to the research, authorship, and/or publication of this article: David Reinkensmeyer has received payment for consulting and holds equity in Hocoma and Flint Rehabilitation Technologies, manufacturers of rehabilitation technology. The terms of these interests have been reviewed by the U.C. Irvine Conflict of Interest committee.
Funding
The author(s) disclosed receipt of the following financial support for the research, authorship, and/or publication of this article: The research was supported in part by grant NIH-2R01HD062744 from the National Center for Medical Rehabilitation Research at NIH.
References
Supplementary Material
Please find the following supplemental material available below.
For Open Access articles published under a Creative Commons License, all supplemental material carries the same license as the article it is associated with.
For non-Open Access articles published, all supplemental material carries a non-exclusive license, and permission requests for re-use of supplemental material or any part of supplemental material shall be sent directly to the copyright owner as specified in the copyright notice associated with the article.