
Abstract
Background
Resting-state functional magnetic resonance imaging (rsfMRI) reflects spontaneous activation of cortical networks. After stroke, these networks reorganize, both due to structural lesion and reorganization of functional connectivity (FC).
Objective
We studied FC in chronic phase occipital stroke patients with homonymous visual field defects before and after repetitive transorbital alternating current stimulation (rtACS).
Methods
This spin-off study, embedded in the randomized, sham-controlled REVIS trial, comprised 16 chronic occipital stroke patients with visual field defect and 12 healthy control subjects. The patients underwent rsfMRI at baseline, after two weeks of rtACS or sham treatment, and after two months of treatment-free follow-up, whereas the control subjects were measured once. We used a multivariate regression connectivity model to determine mutual prediction accuracy between 74 cortical regions of interest. Additionally, the model parameters were included into a graph to analyze average path length, centrality eigenvector, centrality degree, and clustering of the network. The patients and controls at baseline and the two treatment groups were compared with multilevel modeling.
Results
Before treatment, the patients and controls had similar whole-network prediction accuracy and network parameters, whereas centrality eigenvector differed in perilesional regions, indicating local modification in connectivity. In line with behavioral results, neither prediction accuracy nor any network parameter changed systematically as a result of rtACS rehabilitation compared to sham.
Conclusions
Whole-network FC showed no difference between occipital stroke patients and healthy population, congruent with the peripheral location of the visual network in relation to the high-density cortical core. rtACS treatment in the given setting did not affect FC.
Keywords
Introduction
Homonymous visual field defects (VFD) affect 0.8% of population over 50 years in Western countries. 1 They represent the most common manifestation of posterior cerebral artery stroke 2 and may lead to significant restrictions in daily activities. 3 Spontaneous recovery is highly variable (9–55%) and usually occurs shortly after stroke, up to six months.4,5
Recovery after stroke is suggested to result from reorganization of cortical networks, but its underlying mechanisms remain unknown. 6 A potential tool to study post-stroke plasticity is resting-state fMRI (rsfMRI)—a task-independent method that measures intrinsic slow (<0.1 Hz) blood-oxygenation-level-dependent (BOLD) signal fluctuations. 7 It captures temporally correlated activation of spatially remote brain regions, that is, functional connectivity (FC) of networks. 8 After stroke, several groups have found impaired FC within the lesioned functional network, most often between hemispheric homotops.9–11 Additionally, many studies have observed improvement of intra- or internetwork FC either spontaneously11,12 or after rehabilitation 13 and shown that impaired connectivity correlates with behavioral deficits.9,10,12,14 Recently, similar findings were reported after stroke affecting the visual system. 15 However, most rsfMRI studies on stroke have applied seed-based methods, requiring preselection of specific regions of interest (ROI), which may miss connectivity between other regions of the brain. This shortcoming has been challenged by multivariate methods that combine information from the whole-brain network to predict intrinsic FC and that might at best offer a new disease biomarker. 16
Several interventions, including non-invasive electrical brain stimulation, have been studied in vision restoration after stroke, but the evidence from randomized controlled trials is limited. 17 Others have studied one of the methods, repetitive transorbital alternating current stimulation (rtACS), in patients with optical nerve damage, where it has improved detection ability 18 and strengthened resting-state alpha coherence. 19 ACS comprises weak current of cyclically alternating polarity that has been proposed to modulate the ongoing oscillatory brain activity and related behavioral processes. 20 Concomitant synaptic plasticity would lead to long-lasting changes. Transorbital ACS may stimulate the retino-striatal pathway synchronously and thus interfere with cortical alpha-band oscillations.19,21,22 These oscillations are also disrupted in patients with hemianopia after brain lesions. 23
The multicenter REVIS (Restoration of Vision after Stroke) trial was established to explore rehabilitation of VFD after chronic occipital stroke with different non-invasive electrical brain stimulation methods, including rtACS, in three different centers. 24 In a spin-off study of the Helsinki trial arm, we studied resting-state FC and network topography between occipital stroke patients and healthy population with a method based on a multivariate regression connectivity (MRC) model. 25 Our aim was to discover whether changes in post-stroke FC, previously detected in specific resting-state networks, would also manifest in the whole network. In addition, we investigated whether rtACS treatment led to improved FC, reflecting potential behavioral benefit.
Methods
Subjects
The study protocol followed the REVIS trial,
26
the main results of which have been reported elsewhere.
24
In the Helsinki trial arm, 18 patients with unilateral VFD due to chronic (>6 months) occipital infarction were randomized to receive either rtACS or sham treatment over a two-week period (Figure 1). Behavioral and functional measurements were performed before and after the treatment, and after two-month follow-up. Two patients were excluded from the fMRI study due to contraindication for imaging. In addition, 14 age- and sex-matched control subjects without neurological or ophthalmological diseases underwent a neurological examination, including confrontation perimetry, and baseline fMRI scanning; two were later excluded because of reduced vigilance. All patients gave their written informed consent. The study was approved by the Ethics Committee of Helsinki and Uusimaa Hospital District (49/13/03/01/13, HUS/576/2017) and carried out in accordance with the Declaration of Helsinki. Flow diagram of the fMRI study design. The main inclusion criteria are presented below the groups. HUH, Helsinki University Hospital; VFD, visual field defect; rtACS, repetitive transorbital alternating current stimulation.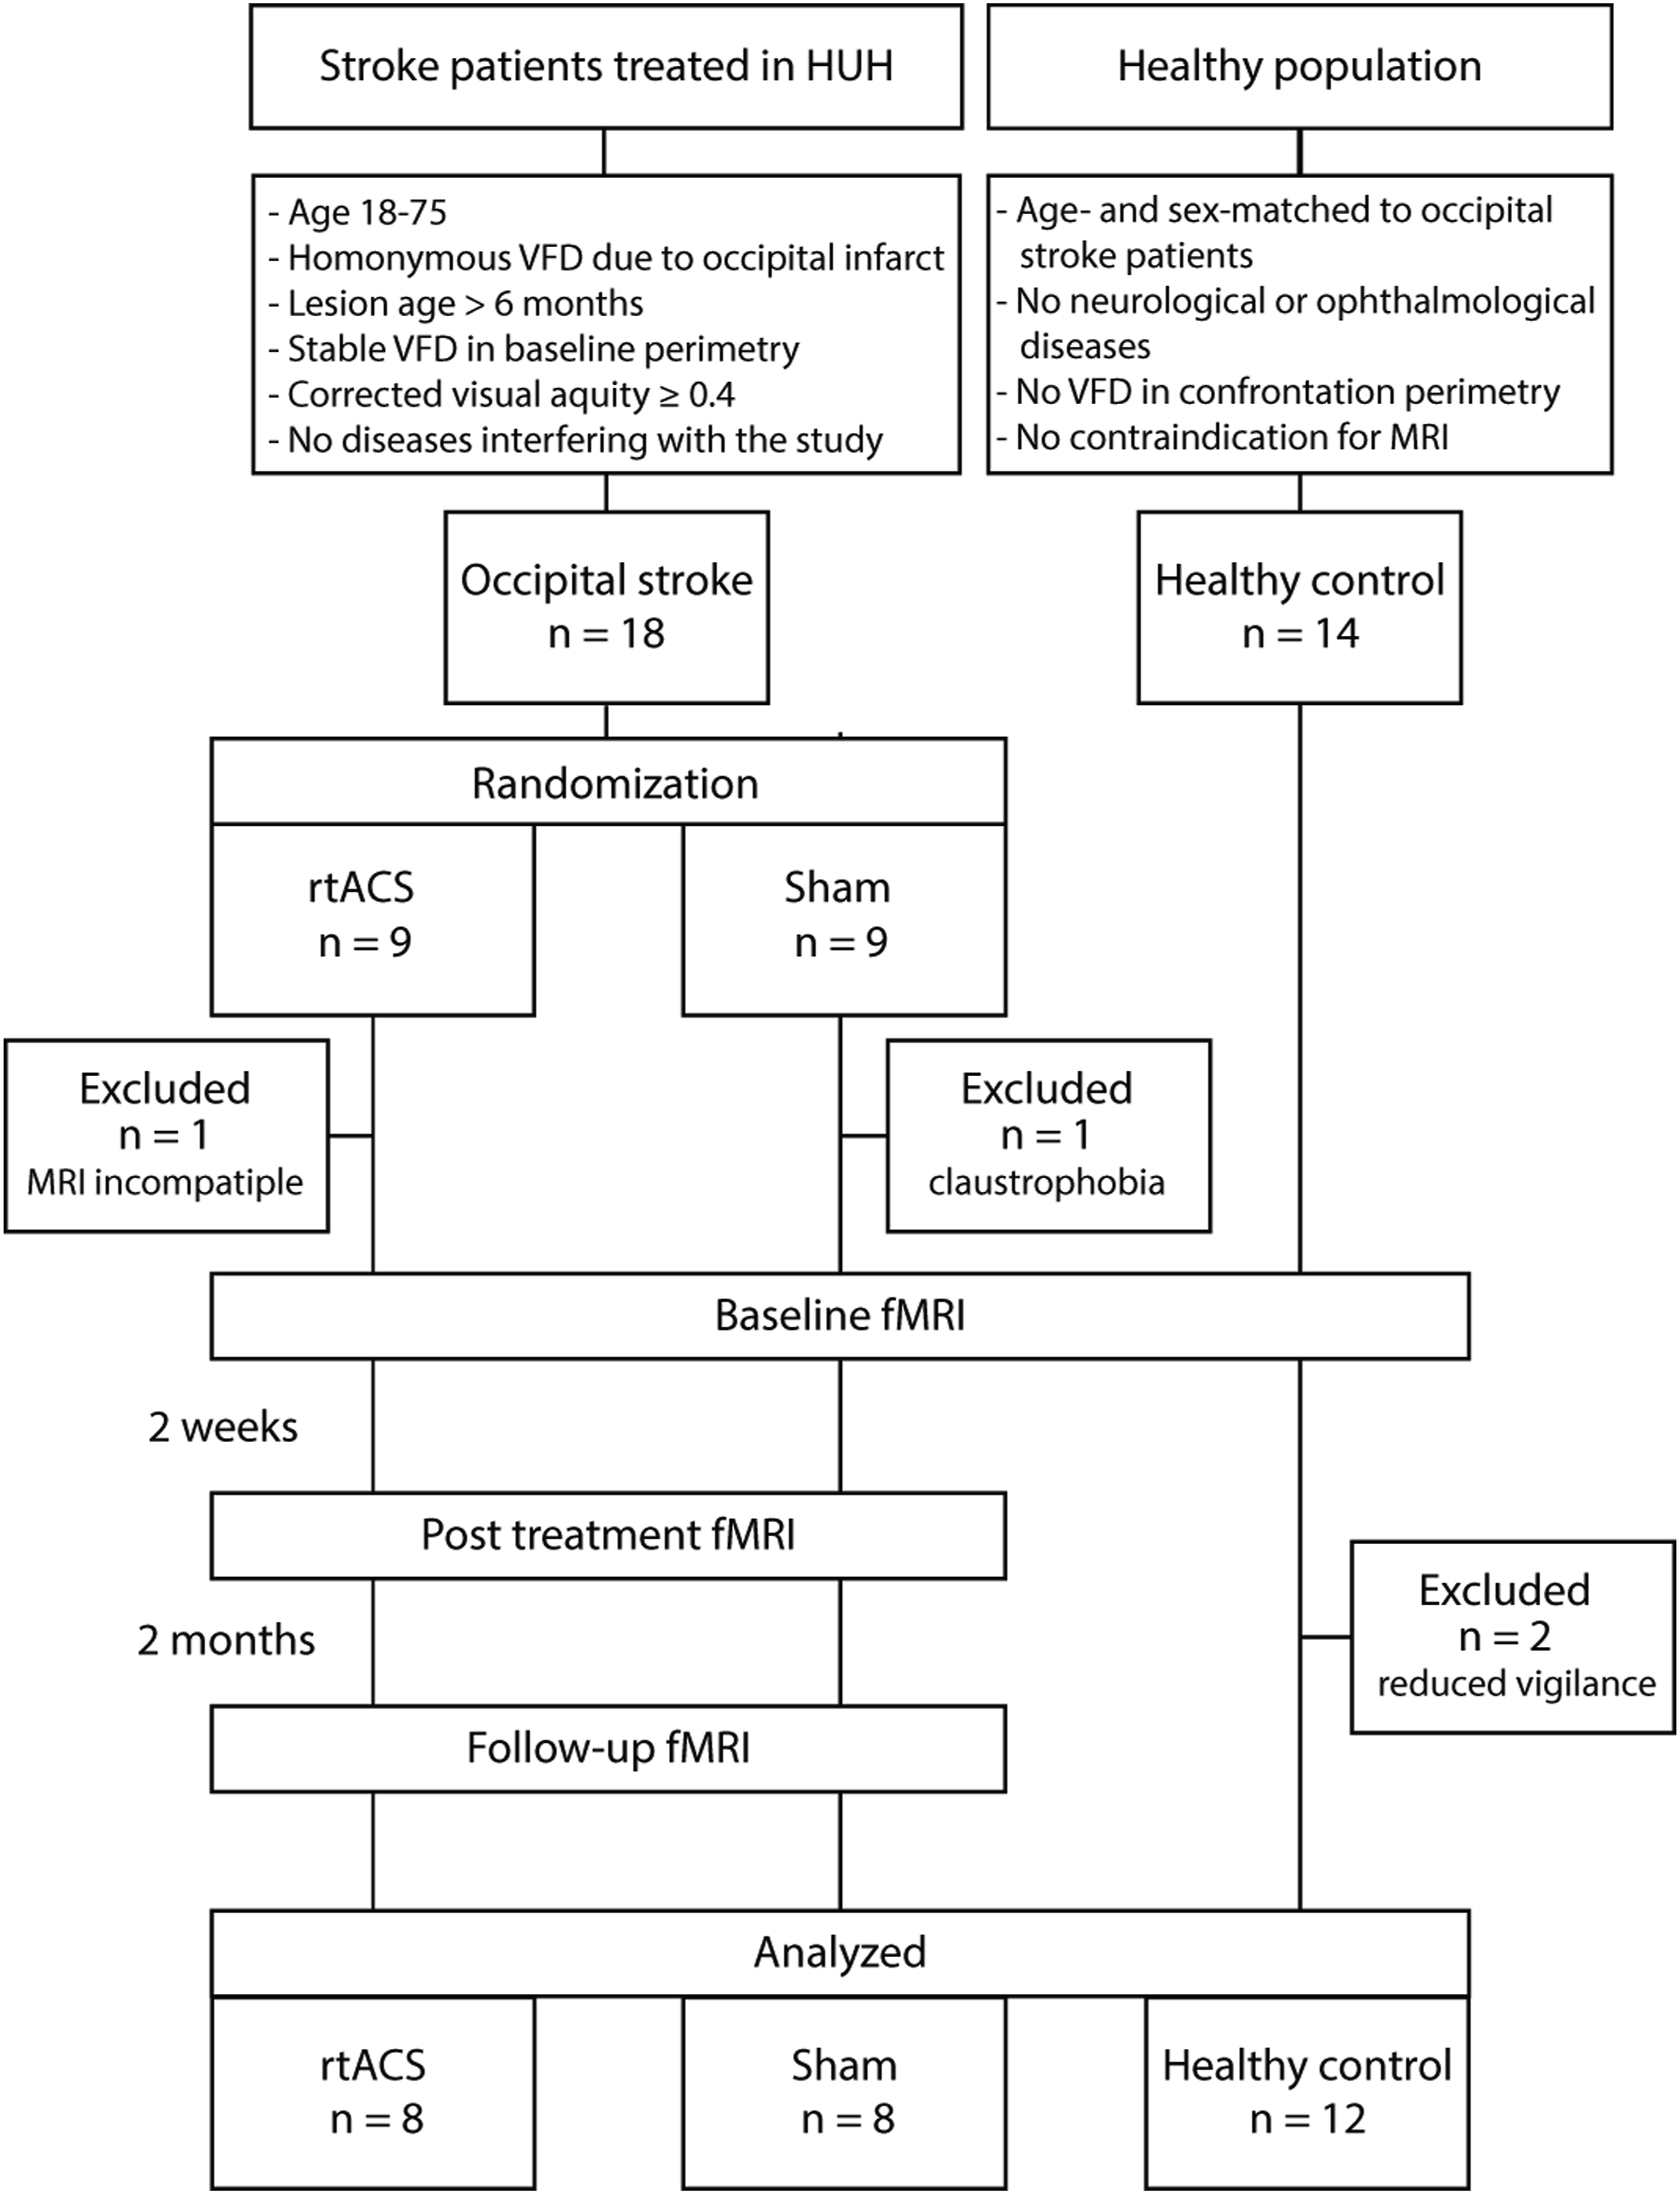
Treatment
The treatment consisted of ten 30–40 min stimulation sessions scheduled for consecutive working days. rtACS was administered with DC-Stimulator (NeuroConn, GmbH, Ilmenau, Germany) sequentially through two 3 × 3 cm electrodes placed supraorbitally while a 5 × 7 cm reference electrode was on the right forearm. During the stimulation, subjects sat in a darkened room with their eyes closed. Stimulation frequency alternated between 5 and 15 Hz, and amplitude (450–1500 μA peak-to-peak) was adjusted above the fusion threshold of flickering light perceptions (phosphene). In the sham group, the electrode placement and treatment duration were identical. To ensure blinding, they received single 10-pulse stimulation bursts (1.5% of the pulses in the rtACS group) to produce few phosphene percepts. Neither group received other rehabilitation during the study.
Behavioral Measurements
Primary behavioral outcomes of the study were mean sensitivity acquired from static perimetry (Octopus 900, Haag-Streit Diagnostics: 59 positions; stimulus: size III, color white, duration 0.2 s, luminance 1270 cd/m2; background luminance 10 cd/m2; fast-threshold strategy) and detection accuracy, as measured with high-resolution perimetry (HRP). The former tests near-threshold light detection at the 30° visual field and the latter super-threshold detection within central 12° field, thus capturing small changes within the VFD border area. Fixation was controlled with online eye tracker in HRP and with automated fixation control and visual monitoring by a researcher performing the measurement in the conventional perimetry. The more detailed methods are presented elsewhere. 24
Data Acquisition
The fMRI measurements were performed with 3T Siemens Magnetom Skyra scanner (Siemens, Erlangen, Germany) at Advanced Magnetic Imaging Centre (Aalto University, Espoo, Finland) with a 30-channel coil (modified from 32-ch Siemens head coil to improve available visual field). Each session included anatomical images (high- and/or low-resolution T1, T2, FLAIR) and two 6-min rsfMRI runs. High-resolution T1-weighted anatomical images (voxel size 1 × 1 × 1 mm) were acquired with magnetization-prepared rapid-acquisition gradient-echo (MPRAGE) sequence with repetition time (TR) 2530 ms, echo time (TE) 3.3 ms, inversion recovery time (TI) 1100 ms, field of view (FOV) 256 mm, slice number 176, slice thickness 1 mm, imaging matrix 256 × 256, and flip angle (FA) 7°. Low-resolution T1 images had voxel size of 1.25 × 1.25 × 1 mm, TR of 1900 ms, TE of 2.98 ms, and TI of 900 ms. rsfMRI scans (184 volumes, voxel size 3.1 × 3.1 × 3.3 mm) were acquired with echo-planar-imaging sequence (EPI) using TR 2000 ms, TE 40 ms, FOV 200 mm, 29 slices, slice thickness 3.3 mm (no gap), imaging matrix 64 × 64, FA 70°, phase encoding anterior to posterior, and fat suppression.
During the resting-state scans, the subjects fixated on a cross on a back-projection screen and were advised to keep their mind empty of thoughts. When necessary, they wore MRI-compatible glasses to correct their vision to the 43-cm viewing distance. We monitored their fixation and vigilance with video connection. All fMRI sequences were optimized for visual cortical areas27,28 and covered the occipital, parietal, and most of the temporal and frontal areas, excluding parts of the inferior frontal and anterior temporal lobe, and the cerebellum. A neuroradiologist revised structural images to evaluate the infarct location and to exclude co-existing pathologies.
Data Preprocessing
We executed preprocessing with tools from FSL,29,30 AFNI, 31 and ITK-SNAP, 32 integrated in a Nipype pipeline. 33 The anatomical images were skull stripped and reoriented to the FSL standard orientation. Gray matter, white matter, and CSF segmentation were performed. We drew lesion masks for occipital infarcts, as well as for old infarcts in some subjects, semi-automatically from the high-resolution anatomical images. All images were transformed to the same high-resolution anatomical space and in two steps, registered to the MNI152 standard space with linear transformation by FSL FLIRT and nonlinear transformation by FSL FNIRT.
During functional preprocessing, we skull stripped the images, transformed them to the FSL standard space, deleted the first six volumes to reach stable magnetization, normalized intensity values, and corrected slice timing. The images were transformed to the high-resolution anatomical space before registration to the MNI152 standard space. Linear transformations included rigid-body transformation with scaling (seven degrees of freedom).
Lesion masks were applied before data analysis to exclude infarcted tissue. Consequently, the median number of voxels per ROI among the patients was 953 (range 37–8250) compared to the controls’ 969 (113–8250; P = .612). Images of individuals with right-sided occipital infarct were horizontally flipped so that all lesions laid on the left side. Finally, we evaluated cortical volume in each ROI with Freesurfer segmentation 34 of the high-resolution anatomical images. We inspected all images throughout the preprocessing to avoid segmentation errors.
Nuisance Modeling and Removal
Variance associated with several nuisance regressors was removed before the connectivity analysis.35–37 The nuisance regressors included temporal filtering at 0.01–0.10 Hz, movement parameters (24; 3 rotations, 3 translations and their temporal derivatives, quadratures, and quadratures of the derivates), and regressors from the white matter (4) and CSF (4), and a global regressor (4). Head movement was assessed as framewise displacement that considers movement in all three translational and rotational planes. 37 Successive time points with framewise displacement over 0.6–0.8 mm were regressed to 0, and those with less motion to 1, resulting in censoring up to 11% of the data, including abrupt fidgeting movements. After nuisance removal, voxel values were closer to 0 mean and normal distribution, suggesting removal of significant bias in the data (Supplementary Figure 1). Average framewise displacement in a run was calculated, and of the two values per session, the higher was used in statistical analyses to model head motion.
Analysis of Prediction Accuracy
We analyzed rsfMRI data with an MRC model, 25 which is based on two independent rsfMRI runs (Data 1 and 2) measured in the same session (Supplementary Figure 2). First, the brain was divided into 74 cortical ROIs according to the Harvard-Oxford atlas, 38 excluding the ROIs outside our scanning area. The support vector regression method averages Data 1 time series of the voxels within the first ROI and then creates a linear model for the activity of the first ROI from the time series of the voxels inside all the other ROIs, excluding lesion masks. Next, this procedure is repeated for every ROI. The resulting model is tested with an independent second run (Data 2).
During the model testing, we calculated prediction accuracy (PA), a correlation coefficient between the observed ROI time series and its model prediction. The model prediction comprises model weights from the first run multiplied by corresponding voxel time series from the second run. The same procedure is repeated with Data 2 working as the model data and Data 1 as the test data. Below, we report the average of the two PAs. For a given ROI, there are as many weight parameters as there are voxels outside the ROI. They are averaged over each ROI, resulting in N-1 weight parameters, where N is the number of ROIs. Thus, both runs produce one vector of N-1 weight parameters for each ROI. A reproducibility value is the correlation coefficient between the two vectors.
According to Craddock et al, 25 the analysis can be conceptually linked to more traditional rsfMRI analyses. PA depicts a measure of integration of a ROI with its functional networks; therefore, poor PA reflects lack of information within the rest of the brain on the time series of the target ROI, implying functional segregation. Model weights of single voxels are analogous to correlation coefficients in seed-based FC analysis.
Analysis of Network Parameters
Finally, we used the model weights from the support vector regression analysis to construct a directed and weighted graph, 39 where the ROIs represent nodes and the averaged model weights edges between them. Below, we report centrality degree (CD), centrality eigenvector (CE), average shortest path (ASP), and clustering (CL). CD describes a sum of edge weights connecting to a node, 40 whereas CE sums connection weights of a node and its adjacent nodes. 41 Therefore, the former represents local centrality, whereas the latter is a more global measure, reflecting connections to highly connected hubs. ASP is defined as a mean of the lowest sum of edge lengths connecting any two nodes in the network, whereas CL is a fraction of a node’s nearest neighbors that are also neighbors to each other. 40 The former is a measure of integration, describing potential for information transfer between distant brain regions, whereas the latter reflects segregation, the brain’s ability to share specialized information within local clusters. We visualized the networks with Circos software. 42
Statistical Analyses
We evaluated normality of the data with histograms and Shapiro–Wilk and Kolmogorov–Smirnov tests. Normally distributed continuous variables were compared between the groups with t test, non-normally distributed with Mann–Whitney U test, and discrete variables with χ2 or Fisher’s exact test. Correlations were calculated with Pearson correlation or Spearman’s rank correlation, when appropriate. We report median and interquartile range (IQR) for variables of non-normal and mean and standard deviation (SD) for variables of normal distribution. Statistical significance was <0.05 (two-sided). All tests were performed with SPSS 25 (IBM Corp, Armonk, NY, USA).
We tested the effect of occipital stroke on the whole-network PA at baseline using multilevel modeling with a linear mixed model. 43 Fisher transformation was applied to PA to enable linear statistical testing and age, voxel count, and head motion were included as confounders. The treatment effect of rtACS was analyzed with a linear mixed model with repeated measures. 43 The dependent variable was Fisher-transformed PA of the treatment groups at post-treatment and follow-up sessions, independent variables session, treatment group, and their interaction, and confounders included PA at baseline, voxel count, and head motion. If the interaction was significant, we tested the between-group difference at post-treatment and follow-up separately and adjusted the results for above-mentioned confounders. Network parameters were analyzed using the same statistical tests as PA. The detailed parameters of all multilevel models are explained in the Supplemental material.
PA and network parameters of single ROIs were compared between the patients and controls and the different treatment groups with Mann–Whitney U test. The within-group analyses of the treatment groups were performed with Friedman test and post hoc pairwise comparisons with Wilcoxon signed-rank test with Bonferroni correction. Multiple comparisons were corrected with false discovery rate correction.
Results
Baseline Characteristics
Demographics of the patients (rtACS and sham group) and controls.
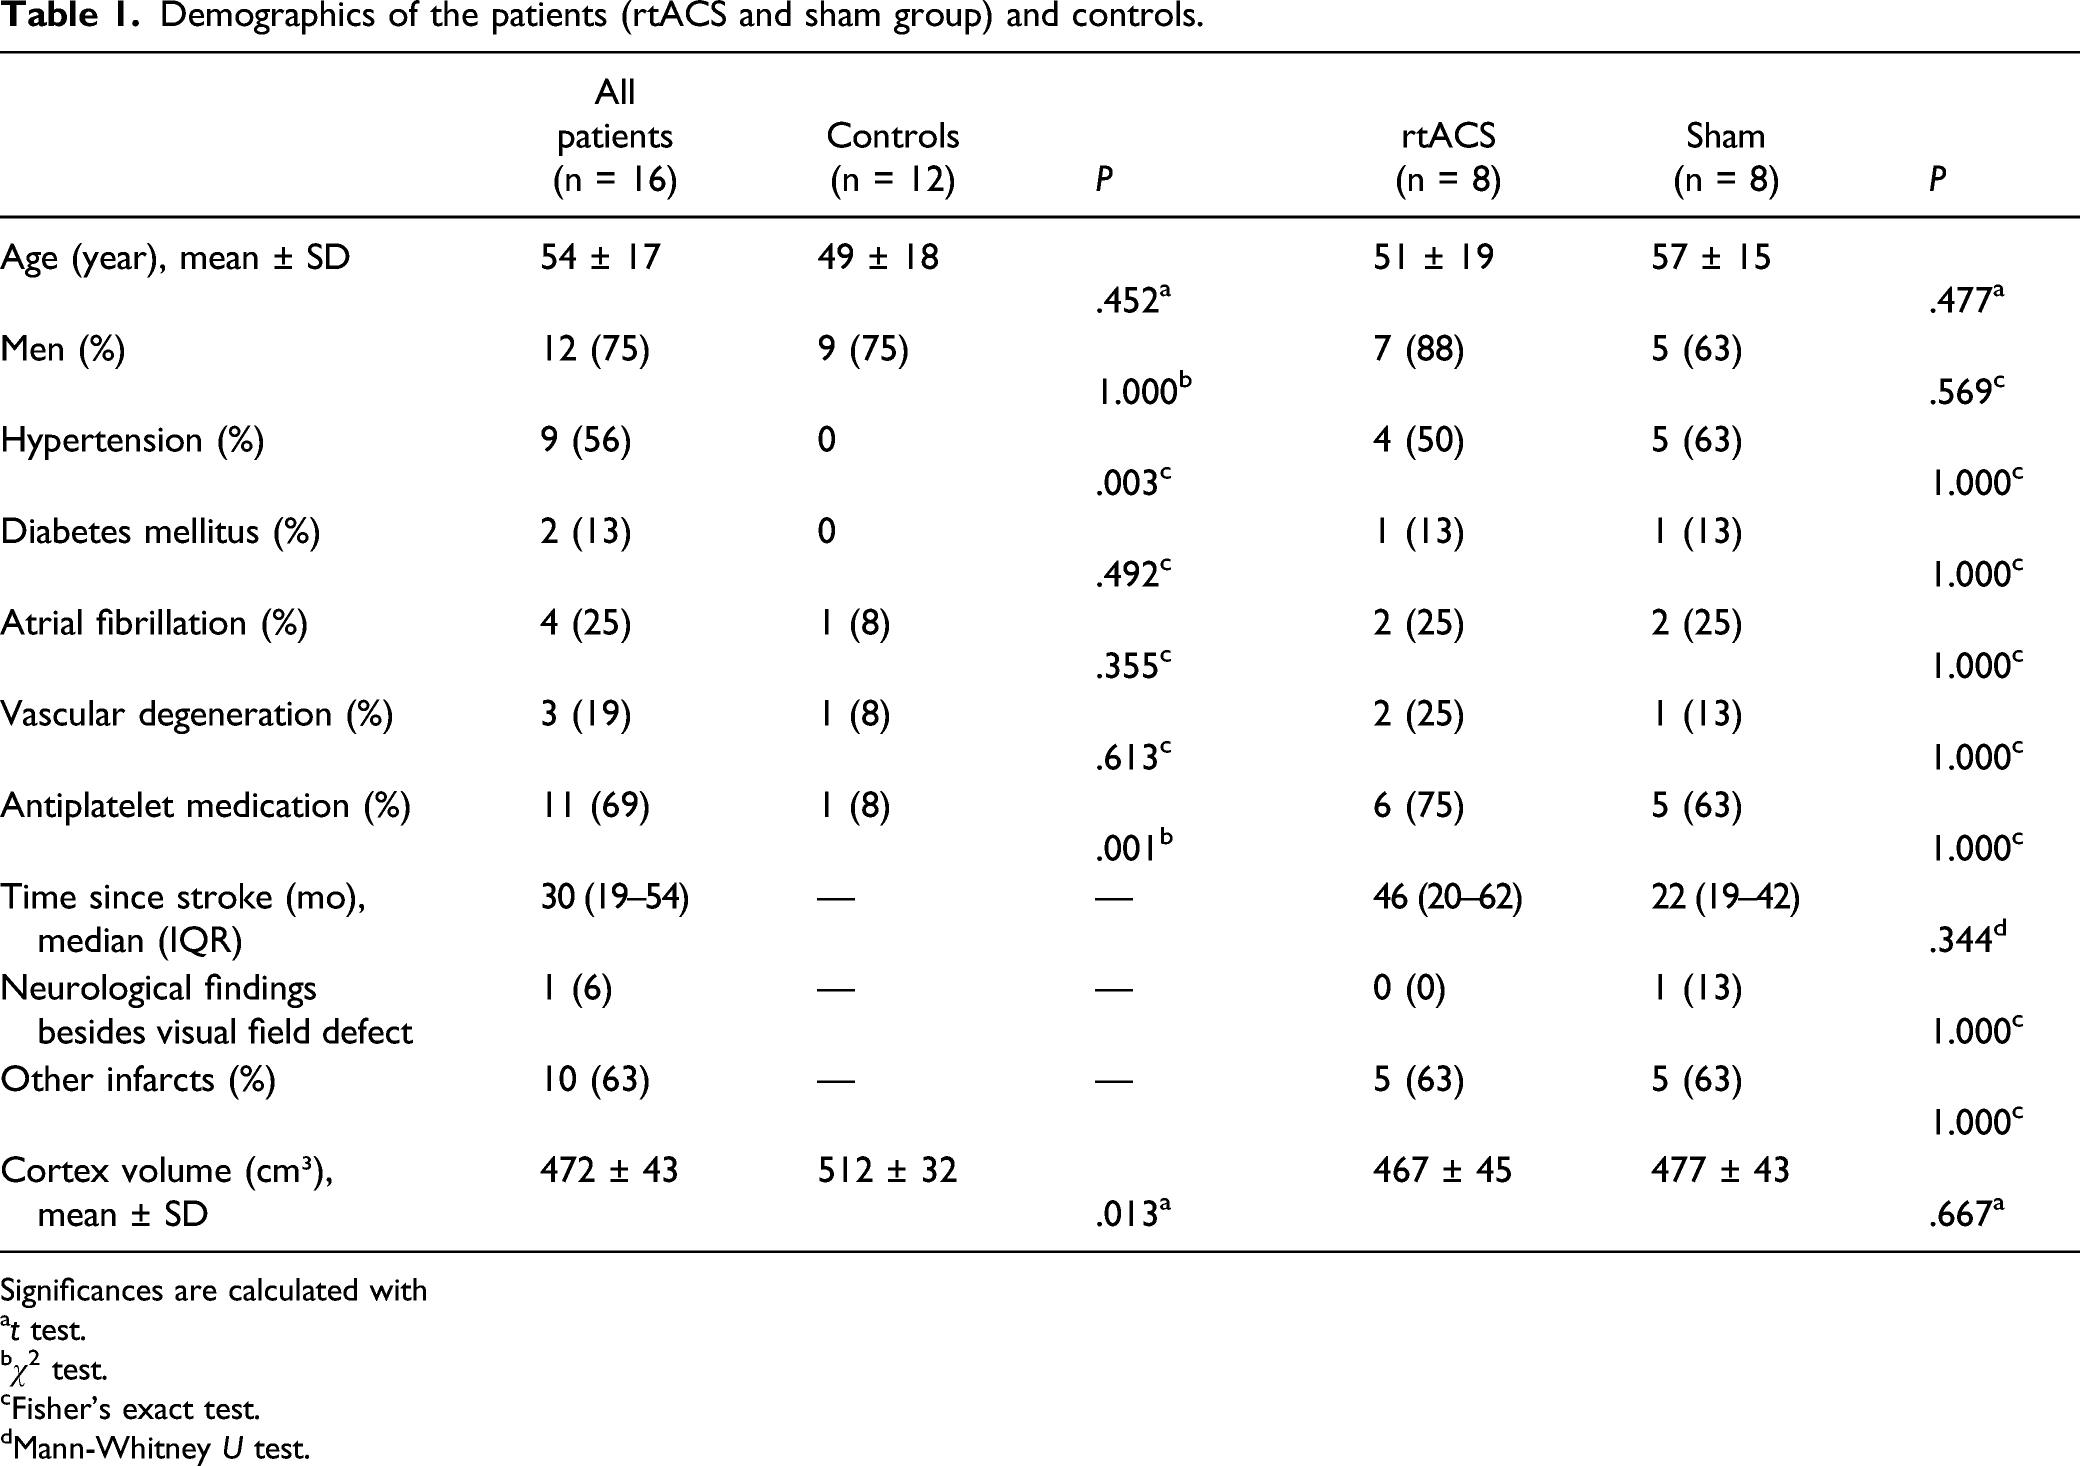
Significances are calculated with
at test.
bχ 2 test.
cFisher’s exact test.
dMann-Whitney U test.
Head Motion, Age, Sex, Cortex Volume, and Voxel Count
There was a difference in head motion between the patients and controls (patients 2.8 ± 0.7 mm; controls 1.7 ± 0.4 mm; P < .001). The treatment groups did not differ in motion at baseline (rtACS 2.7 ± 0.5 mm; sham 2.8 ± 0.9 mm; P = .670) nor at post-treatment (rtACS 2.5 ± 1.0 mm; sham 3.7 ± 2.3 mm; P = .187), but the sham group moved more at follow-up (rtACS 2.2 ± 0.6 mm; sham 4.0 ± 1.6 mm; P = .016). The head motion was included as a covariate into the statistical analyses.
Neither head motion (P = .722), nor cortex volume (P = .200) correlated with median PA nor was there difference in median PA between the sexes (P = .728). However, there was a trend for a correlation between age and PA (P = .059). ROI-wise voxel count, in contrast, correlated with PA (Spearman’s rho 0.27, P < .001), and with CD, ASP, and CL, but not with CE (P = .162) (Supplementary Table 1).
Behavioral Variables of Patients
Median PA correlated with both the detection accuracy (Pearson’s r 0.56, P = .023), and the mean sensitivity averaged over both eyes (Pearson’s r 0.79, P < .001) (Supplementary Table 1). In a linear regression model, PA emerged as a predictor of mean sensitivity (P = .002), but not that of detection accuracy (P = .108), when the results were adjusted for voxel count (Supplementary Table 2). None of the network parameters correlated with the behavioral results.
Patients Versus Healthy Controls
In contrast to the work of Craddock et al 25 who reported subject-wise median PA of 0.81–0.91 and reproducibility of 0.25–0.36, the results of our subjects were lower and less clustered with median PA of 0.55–0.80 and reproducibility of 0.15–0.31 among patients and 0.56–0.77 and 0.12–0.29 among controls (Supplementary Figure 3), suggesting less correlation between ROIs in our data. Results of an individual patient are demonstrated in Supplementary Figure 4 and 5.
There was no difference either in the whole-network PA between the patients and controls (median 0.64, IQR 0.56–0.78 vs 0.68, 0.55–0.78; adjusted P = .552), nor in ASP (median 6.17, IQR 5.21–7.27 vs 5.98, 5.21–6.98; adjusted P = .419), CD (median 19.0, IQR 15.9–22.4 vs 19.4, 16.7–22.5; adjusted P = .415), CE (median 0.11, QR 0.10–0.13 vs 0.10, 0.09–0.12; adjusted P = .835), or CL (median 0.10, IQR 0.09–0.12 vs 0.10, 0.09–0.12; adjusted P = .376) (Supplementary Table 3). In addition, no PA of the individual ROIs were significantly different between the two groups (Figure 2). Median ROI-wise prediction accuracy of the patients and controls. Lines represent IQRs and dots outliers over ± 1.5 IQR. ROIs are organized in anterior to posterior gradient according to the anatomical location. Ipsilesional hemisphere is the left hemisphere of the controls.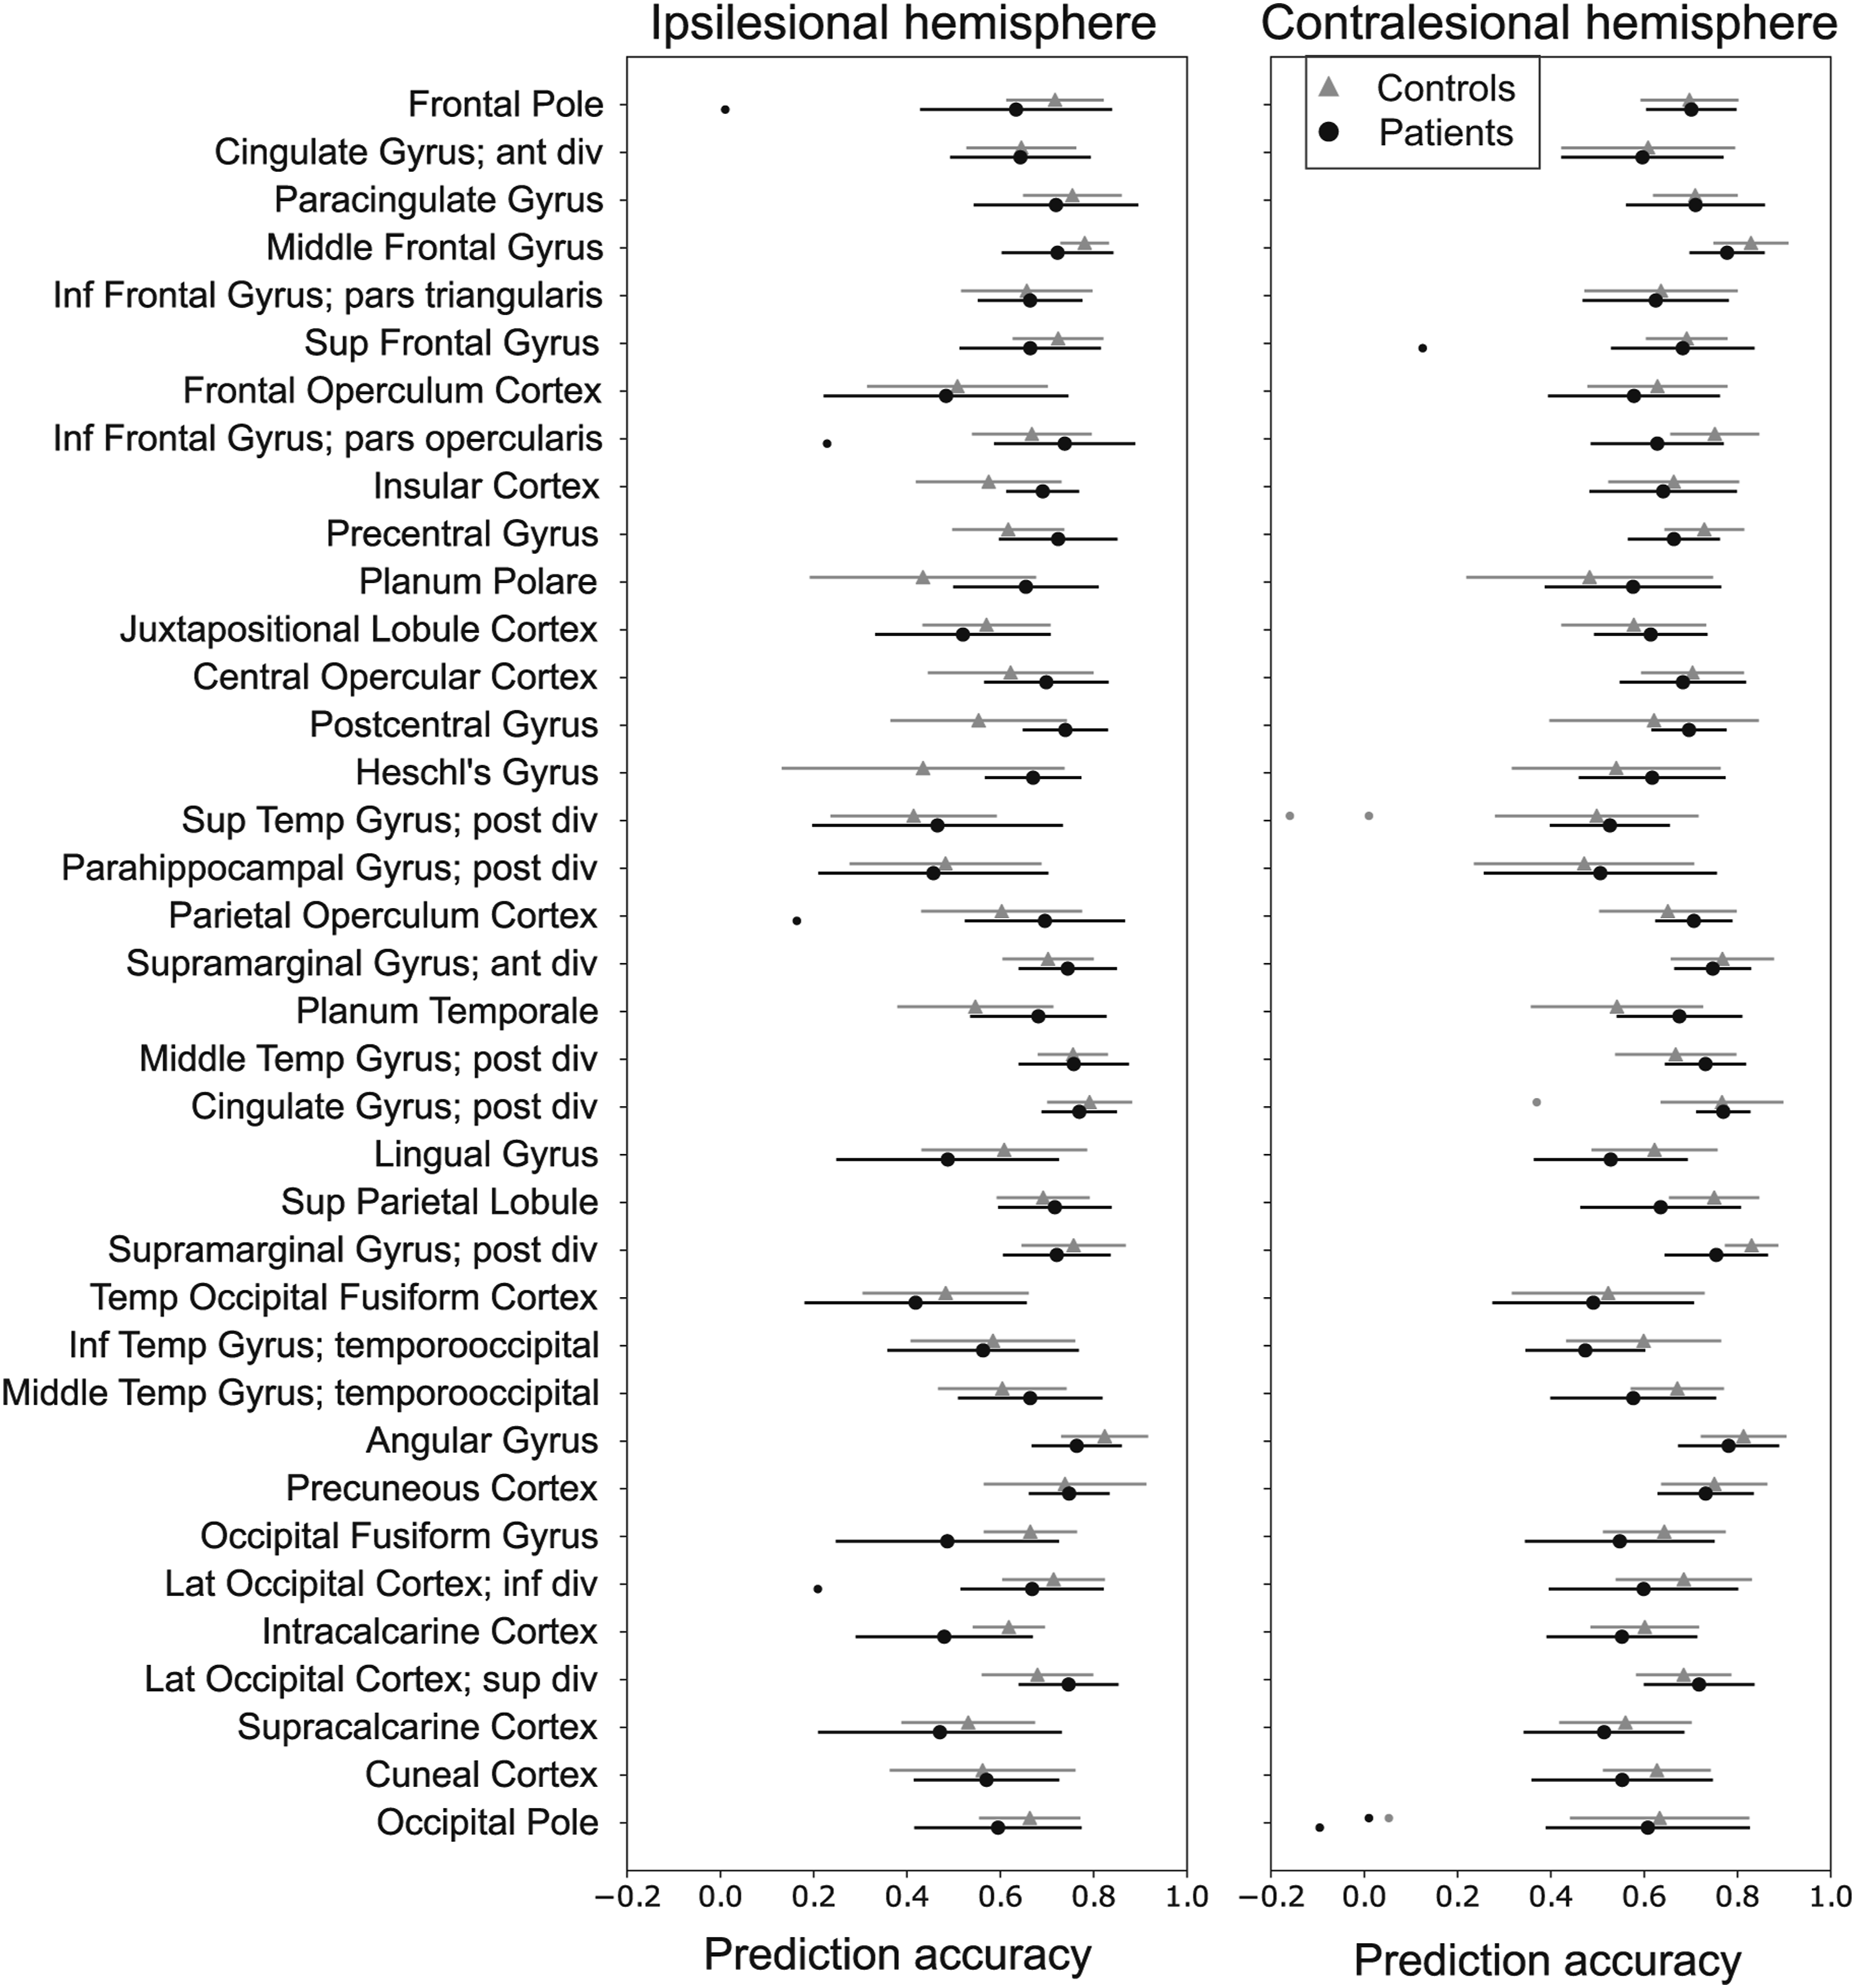
However, the network analysis revealed alterations in local connectivity: CE was lower among the patients in the ipsilesional lingual gyrus (median 0.12, IQR 0.10–0.13 vs 0.14, 0.14–0.15; corrected P = .015) and in the ipsilesional intracalcarine cortex (median 0.12, IQR 0.10–0.13 vs 0.14, 0.14–0.15; corrected P = .003) but higher in the superior division of the ipsilesional lateral occipital cortex (median 0.14, IQR 0.13–0.16 vs 0.12, 0.11–0.13; corrected P = .046) (Supplementary Figure 6). The latter two showed similar results for CD and ASP, and the intracalcarine cortex also for CL, but they were no longer significant after correction for multiplicity. When only 16 occipital ROIs (Figure 3) were analyzed jointly, CE remained lower among the patients when adjusted for voxel count and head motion (median 0.12, IQR 0.10–0.13 vs 0.13, 0.11–0.14; P < .001). Aberrant connectivity is reflected in Figure 3 that demonstrates two patients with fewer occipital connections above a given threshold in their lesion side compared to two controls. Connectograms of two patients (column 1 and 2) and two control subjects (column 3 and 4). ROIs are presented as nodes on the outer circle and red (positive) and green (negative) line weights (thin, medium, and thick) reflect model weights between ROIs. The first row shows all connections. A threshold of 20 (second row) and 50 arbitrary units (third row) were applied to improve visibility. Insert: the small line segments on the four inner circles at the top row represent ROI-wise network parameters whose color scales are depicted on the left.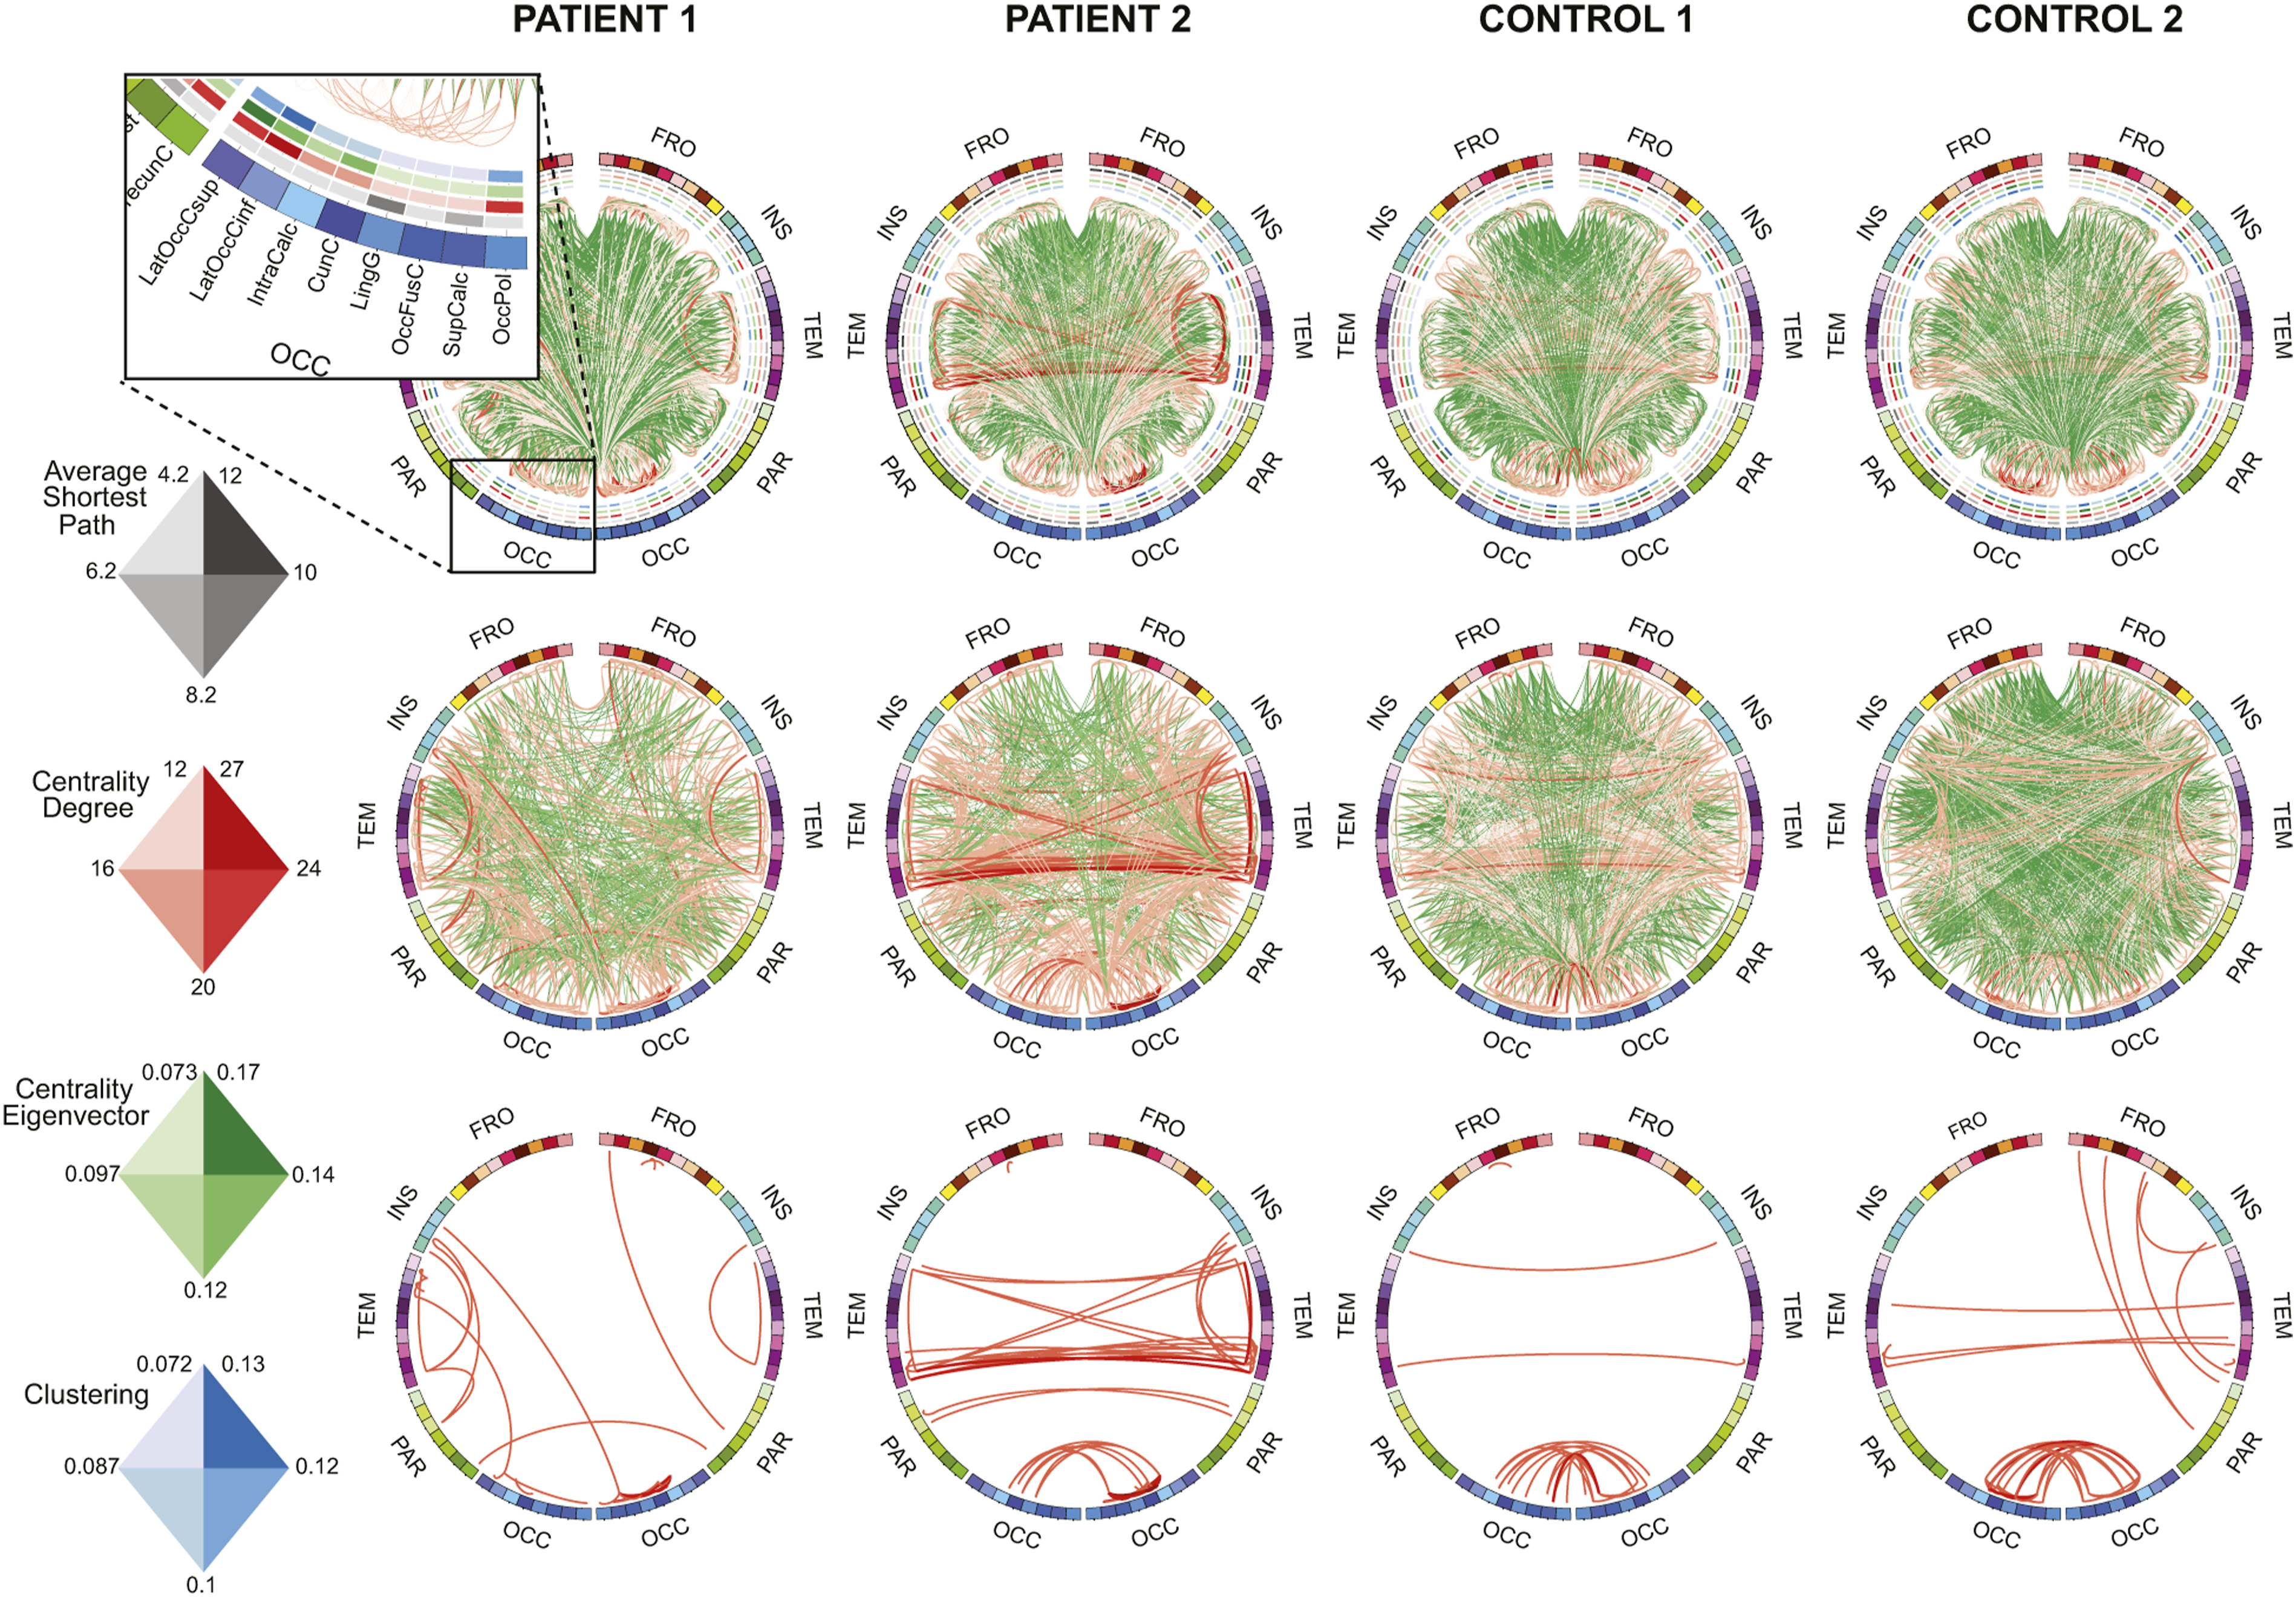
rtACS Versus Sham Group
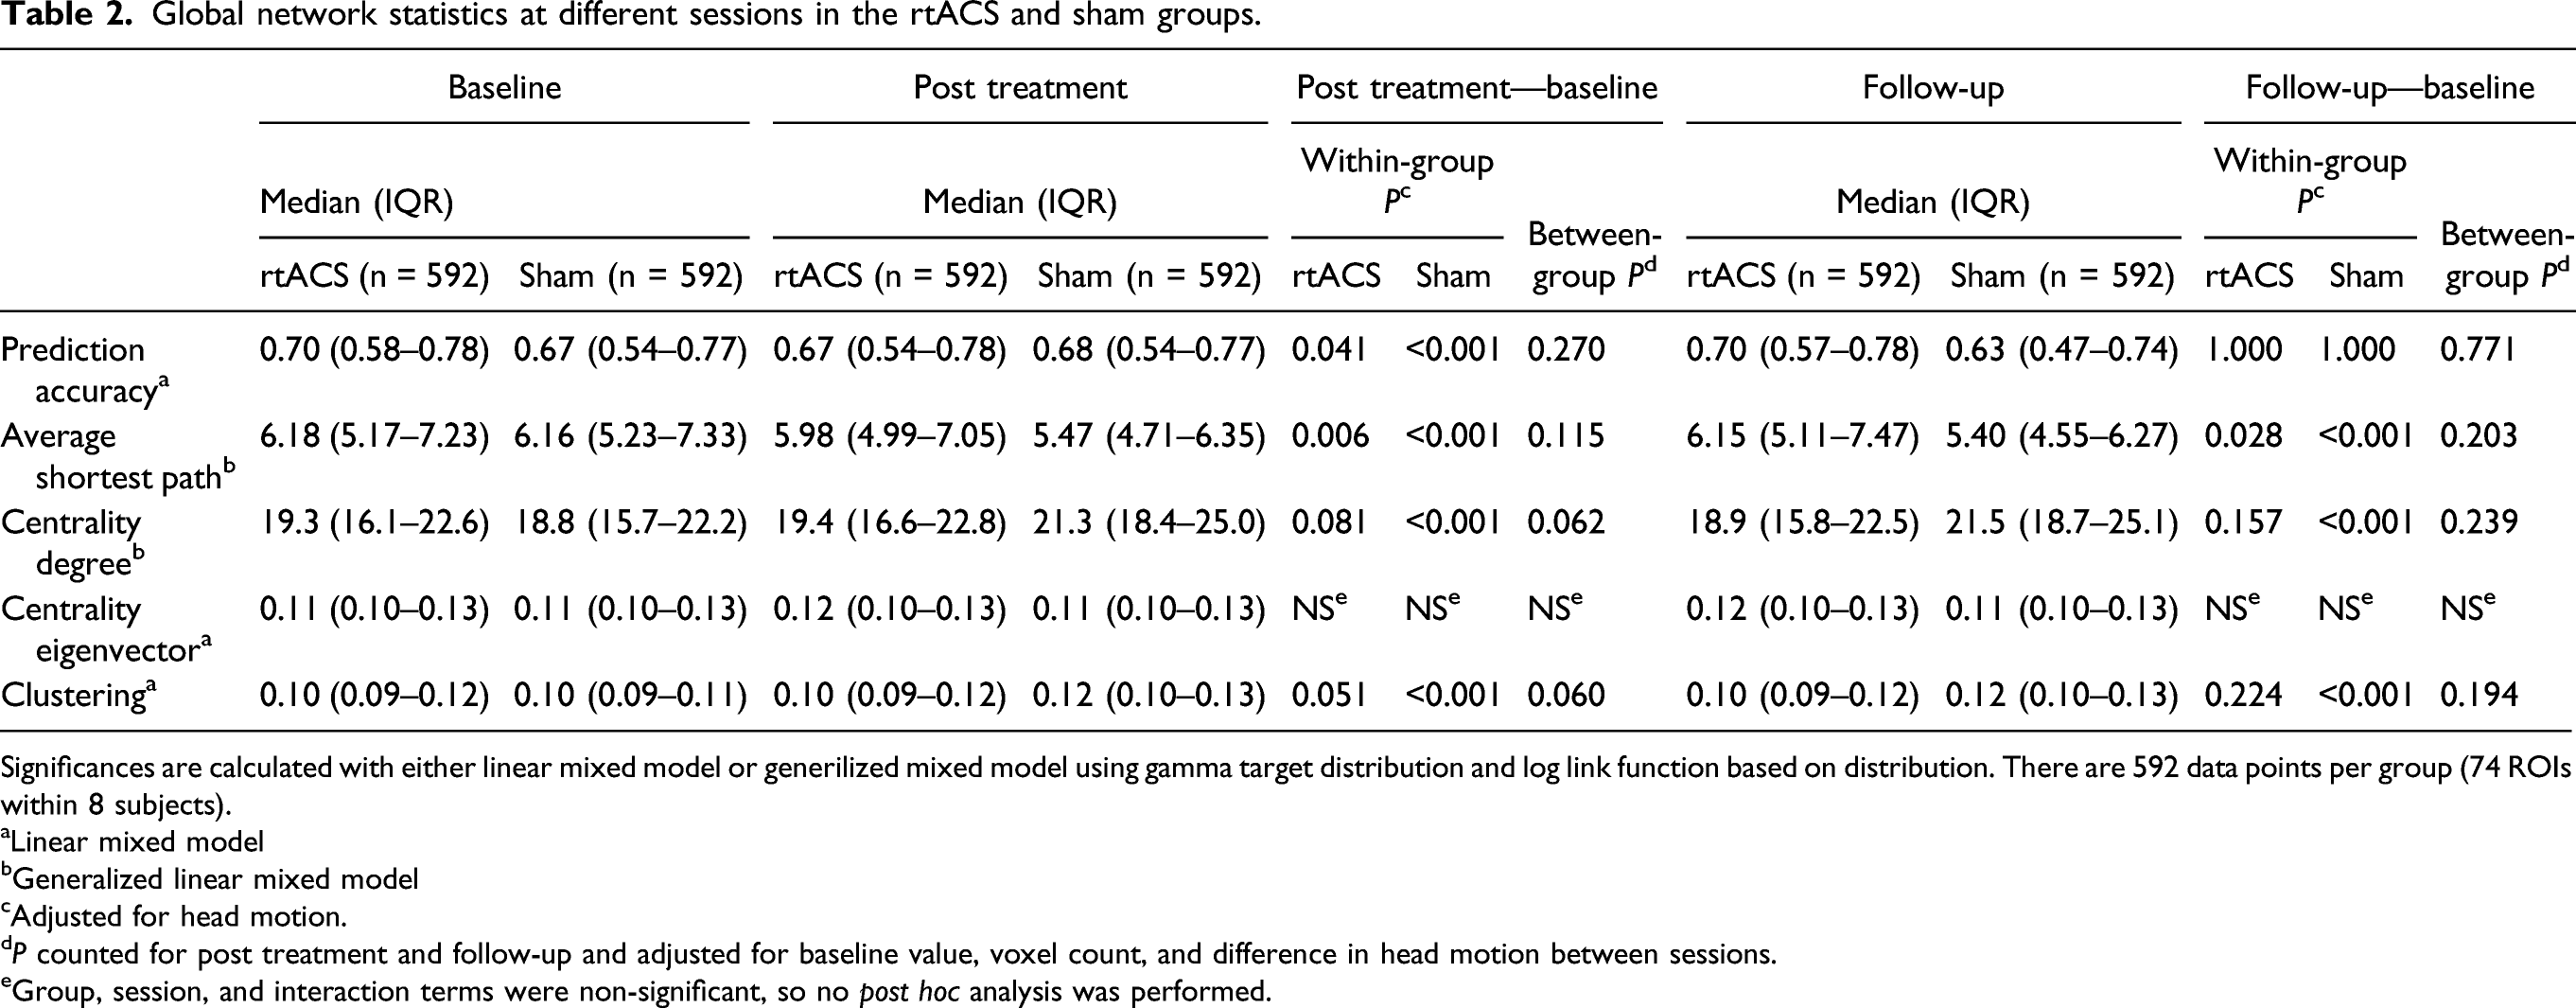
We found no between-group effect in the whole-network PA either at post-treatment or follow-up (Figure 4; Table 2). There was a small but statistically significant within-group decrease between baseline and post treatment in the rtACS group and an increase in the sham group. ASP of both groups decreased between baseline and post-treatment and remained significantly shorter at follow-up (Figure 4; Table 2). None of the other variables changed significantly within the rtACS group. CD and CL increased within the sham group and remained elevated compared to the baseline level. There were no local changes associated with either treatment arm. Boxplots of whole-network prediction accuracy and network parameters of rtACS and sham groups in different sessions. Thick lines represent medians, boxes IQRs, whiskers ± 1.5 IQRs, dots (>1.5 IQR), and asterisks (>3 IQR) outliers. There are 592 data points per group per session (74 ROIs within 8 subjects). Evolution of median prediction accuracies of individual subjects is depicted in a line chart at the top right. Global network statistics at different sessions in the rtACS and sham groups. Significances are calculated with either linear mixed model or generilized mixed model using gamma target distribution and log link function based on distribution. There are 592 data points per group (74 ROIs within 8 subjects). aLinear mixed model bGeneralized linear mixed model cAdjusted for head motion. dP counted for post treatment and follow-up and adjusted for baseline value, voxel count, and difference in head motion between sessions. eGroup, session, and interaction terms were non-significant, so no post hoc analysis was performed.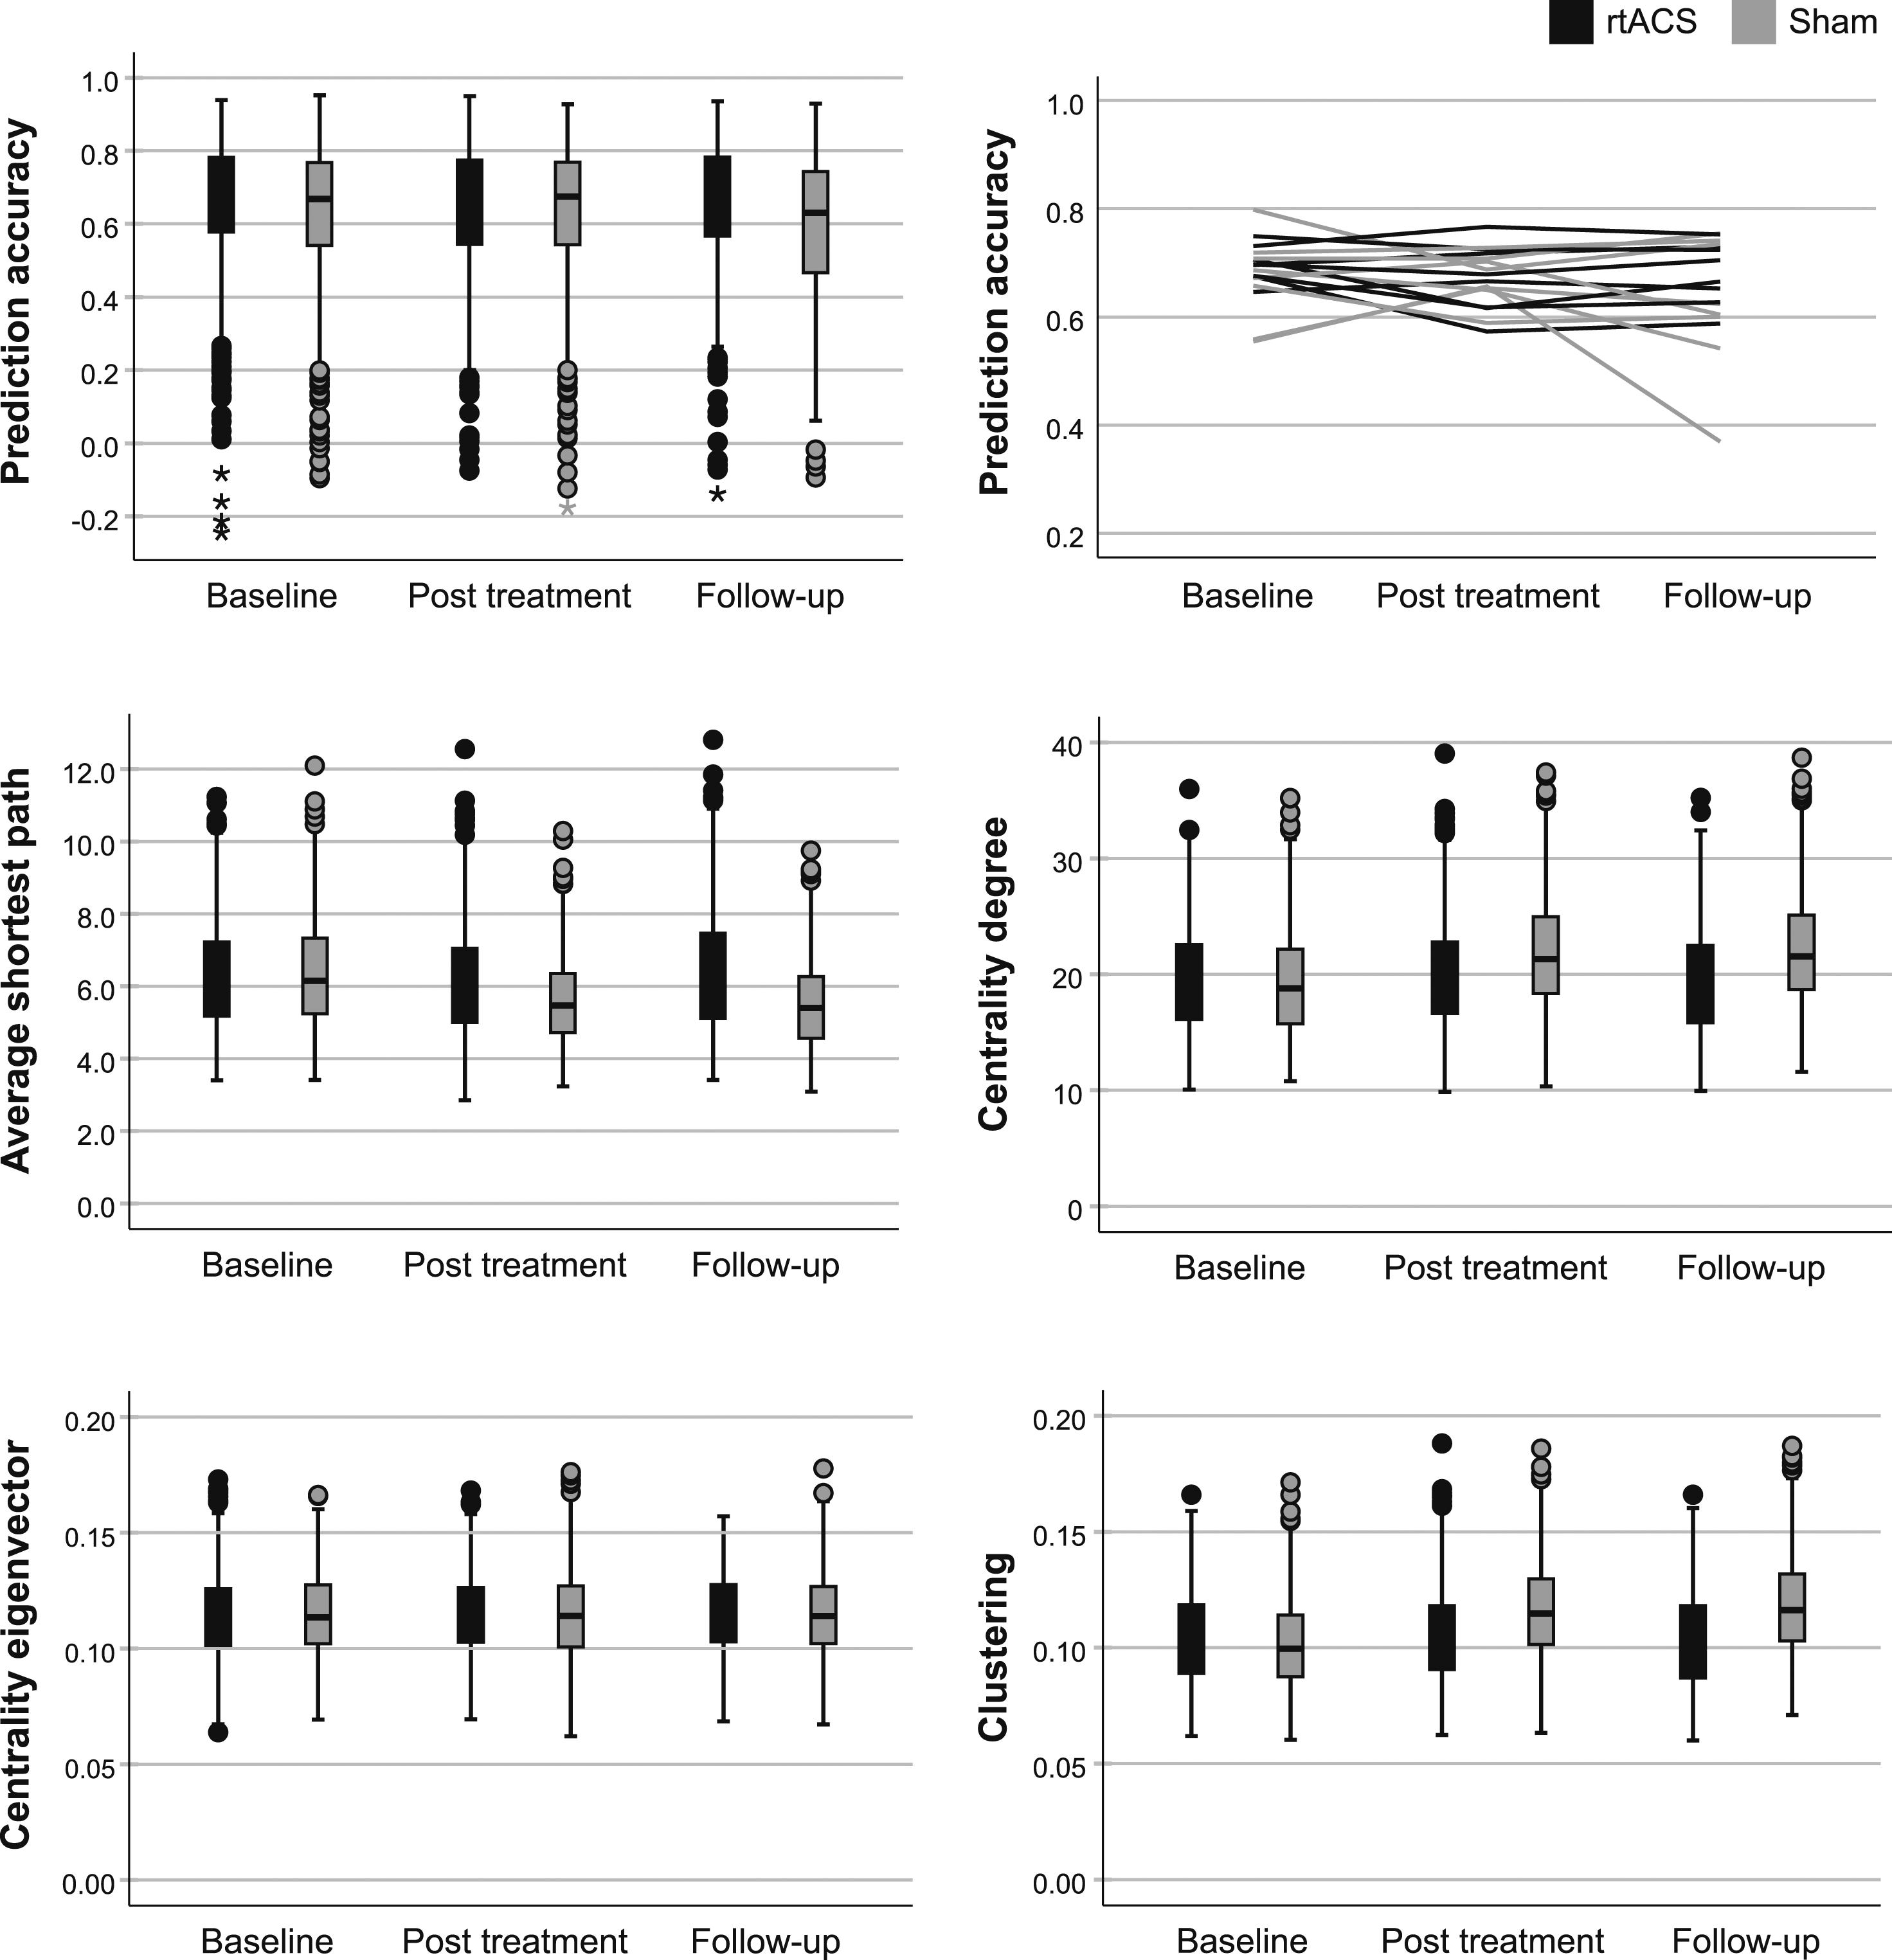
Discussion
We studied brain functional connectivity in patients with chronic occipital stroke and found no difference in the whole-network PA or network parameters between the patients and healthy control subjects. Despite the negative result at the global level, we discovered a few perilesional ROIs with altered CE among the patients. There was no systematic change in PA or any of the network parameters as a result of rtACS rehabilitation compared to sham.
Patients Versus Healthy Controls
Our results imply that chronic occipital stroke does not lead to detectable changes in connectivity of the global cortical networks. This agrees with the findings of Siegel et al, 44 who studied FC and lesion topography after stroke and constructed models to predict impairments in different behavioral domains. They showed that visual deficits are better predicted by lesion location than by disrupted FC, the former explaining 50% and the latter only 13% of behavioral variance. In contrast, associative functions were more reliably predicted by changes in FC. Moreover, the local alterations in FC were mostly confined within the visual resting-state network. As Siegel et al suggest, 44 this is in line with the primate cortical connectivity graph that depicts sensory and motor networks as peripheral nodes in the whole-brain network, 45 and is also supported by computational lesion models. 46 Therefore, our findings may be due to the peripheral position of the visual areas in the forebrain network.
Other factors are likely to have contributed to the lack of difference in both the global and local PA. First, the varying location of occipital infarcts may have caused inter-individual variability in spatial distribution of disturbed FC. Second, our timing could have affected the results. Since most previous studies have shown changed FC in the more acute phase of stroke and their reversal along time,11,12,15,47 we might have been late to observe disrupted FC. Kim et al 15 studied acute stroke patients with VFD and discovered that decreased interhemispheric FC between the visual areas improved mostly within one month, after which it no longer differed from healthy control subjects. This is in concordance with the often partial clinical recovery, which occurs predominantly within the first few months.4,5 However, a few studies on non-occipital stroke report changed FC also in the chronic phase.14,48,49 Notably, an alleviation of network disturbance has been associated with clinical recovery,12,13,15,47 suggesting that changed FC among patients with persistent VFD might have remained until the study period. To support that, PA was associated with VFD within 30° in our study. Nevertheless, the other visual variable, detection accuracy, did not predict PA after adjustment for reduced voxel count, implying that the focal structural lesion remains a significant confounder in the rsfMRI analysis after occipital stroke.
Similarly to PA, our study revealed no difference in the global functional network metrics between the patients and control subjects. This agrees with the findings of Zhang et al 50 who discovered altered structural, but not functional global network topography in patients with subacute subcortical stroke. Furthermore, Gratton et al 51 reported that damage to global hubs connecting brain areas of different functional networks causes more widespread changes in the network topography than one affecting local hubs at the peripheral part of a network. These “connector hubs” have been localized in the high-level cortical areas, whereas the low-level sensory and motor cortices are mostly connected within a single network.45,52
Despite the neutral global-level results, we found differences in local CE in the ipsilesional lingual gyrus, intracalcarine cortex, and superior division of the lateral occipital cortex. The results cannot be solely explained by the reduced number of voxels in the ROIs overlapping infarct lesions, because CE did not correlate with voxel count and a difference to the control group remained in the adjusted analysis of the 16 occipital ROIs. Our findings suggest that while stroke lesions affect less the local connections, they cause a systematic shift in FC to the more connected nodes of the visual network. This may reflect a reduced role of the ventral occipitotemporal areas close to infarction with a compensatory increase in the role of some posterior dorsal stream areas of the network. This is in line with V1 inactivation studies in monkeys, which describe silencing of ventral stream areas, while firing rates of some areas in the dorsal stream are left relatively intact. 53
rtACS Versus Sham Group
The primary behavioral outcomes of the trial did not reveal difference between the rtACS and sham groups in the Helsinki arm. 24 Accordingly, we found no between-group differences in FC after the intervention. The congruence of the rsfMRI and behavioral results prompts us to believe that it reflects a true lack of robust effect on FC. As the reasons for inefficacy of rtACS on vision restoration after stroke have been discussed elsewhere, 24 we here concentrate on its impact on resting-state networks.
There are no previous rsfMRI data on rtACS, but EEG studies have revealed increased occipital alpha power19,22 and improved network synchronization between the occipital lobes and between frontal and occipital areas after rtACS for optic nerve injury. 19 Alpha power has been shown to correlate negatively with rsfMRI connectivity between the occipital regions and the rest of the brain; 54 yet, network effects of transcranial ACS at alpha frequency have been variable. ACS at somatosensory alpha peak frequency over the sensory cortex has decreased the region’s whole-brain connectivity, 55 whereas occipitally applied alpha-ACS has increased FC between the visual and other resting-state networks. 56 We observed a small decrease in the whole-brain FC after rtACS, which, however, did not sustain to follow-up or result in between-group difference to sham. Unlike the previous rsfMRI studies observing immediate effects of ACS, we recorded fMRI a few days and two months after the end of the treatment, so our results rather reflect lack of long-lasting plasticity-mediated network changes than that of immediate entrainment-driven effects. However, without concurrent EEG data, our findings cannot be compared to potential changes in brain oscillations.
Despite the lack of between-group differences after treatment, there were several global within-group changes, which were surprisingly more frequent within the sham group. In a recent fMRI study, task-dependent activation patterns changed after sham treatment similar to our sham condition. 57 Moreover, a sham group in another REVIS trial arm experienced slight improvements in visual variables compared to the group receiving rtACS. 24 This implies that infrequent ACS pulses may affect the brain networks more than repetitive ACS. Biological mechanisms for this finding are unclear but could be due to stronger inhibition for stronger stimuli, as found for center-surround interactions. 58 Future studies need to address the stimulation parameter space around our sham protocol to replicate this unexpected finding.
Methodological Considerations
The strengths of the study include its randomized, controlled design with no patient dropout. We studied FC with a method previously little used in clinical studies that provides a network model and does not require preselection of ROIs, which is important considering that changes in FC may extend beyond the clinically affected subnetwork. 49
Our data differ to some extent from the results of Craddock et al 25 who introduced the MRC analysis: the median PAs of our subjects were lower with more inter-individual variance. The distinction may emerge from differences in the duration of the runs, spatial selection of ROIs, preprocessing, or from older and less healthy population. Interestingly, we achieved the lower values only after careful modeling of the nuisance variables, particularly the residual motion.35–37 Because motion varied between our groups, causing a potential caveat even after the preprocessing, it was included in the statistical model. Thus, thorough modeling of motion remains a critical step in the rsfMRI analysis.
Our study possessed several limitations. Our sample size was small, which decreases the test–retest reliability of network metrics and may have affected the longitudinal network changes after the treatment. 59 Overall, the modest test–retest reliability is an issue impeding the accuracy of all rsfMRI studies, 60 even if multivariate connectivity methods may have better reliability compared to univariate seed-based approaches. 61 Nevertheless, the lack of trend for behavioral improvements after rtACS does not suggest that a clinically relevant network effect would emerge in larger samples of occipital stroke patients. 24
Additionally, because our resting-state scans did not include parts of the basal frontal and anterior temporal lobe, nor the subcortical structures, we might have missed connectivity changes to those areas. Moreover, the control subjects did not undergo perimetry, so undiagnosed visual impairments cannot be excluded. Finally, a few patients had other old infarcts, which may have caused additional variance. These infarcts had not, however, resulted in permanent deficits and therefore might no longer impact the resting-state networks. 47
Conclusions
Our multivariate regression analysis of rsfMRI data did not reveal global network dysfunction in patients with chronic VFDs after occipital damage. However, some perilesional ROIs showed altered functional connections to the more highly connected nodes of the network, presumably downstream from the affected areas. The whole-network FC did not change as a result of rtACS rehabilitation compared to sham. In context of the negative behavioral result, this suggests that rtACS does not induce robust alterations in FC measured with fMRI. It remains, however, open whether other ACS protocols affect the FC or behavioral outcome.
Supplemental Material
sj-pdf-1-nnr-10.1177_15459683211062897 – Supplemental Material for Resting-state Functional Connectivity After Occipital Stroke
Supplemental Material, sj-pdf-1-nnr-10.1177_15459683211062897 for Resting-state Functional Connectivity After Occipital Stroke by Silja Räty, Riikka Ruuth, Katri Silvennoinen, Bernhard A. Sabel, Turgut Tatlisumak and Simo Vanni in Neurorehabilitation and Neural Repair
Footnotes
Acknowledgments
We thank Lic. Sc. (Tech.) Hanna Halme and MSc Karoliina Tapani for designing the fMRI pipeline, PhD Heli Silvennoinen for revising the anatomical MRI scans, Marita Kattelus for help with the MRI acquisition, and MSc Paula Bergman for advice with the statistical analyses.
Declaration of Conflicting Interests
BS is a shareholder of SAVIR-Center, a vision rehabilitation outpatient clinic, where non-invasive brain stimulation methods are used. Other authors have no disclosures.
Funding
The author(s) disclosed receipt of the following financial support for the research, authorship, and/or publication of this article: The study and the REVIS consortium were supported by grants from Academy of Finland (grant no. 263200) to TT and from the German Federal Education and Research Ministry (Grant no. BMBF 01EW1210) to BS through a European Joint Call, grants from Biomedicum Helsinki Foundation, the Finnish Medical Foundation, and Päivikki and Sakari Sohlberg Foundation to SR, from Maire Taponen Foundation to SR and KS, Finnish state funding for university-level health research to SR and SV, and by University of Helsinki infrastructure funding to SV.
Supplementary Material
Supplemental material for this article is available online.
References
Supplementary Material
Please find the following supplemental material available below.
For Open Access articles published under a Creative Commons License, all supplemental material carries the same license as the article it is associated with.
For non-Open Access articles published, all supplemental material carries a non-exclusive license, and permission requests for re-use of supplemental material or any part of supplemental material shall be sent directly to the copyright owner as specified in the copyright notice associated with the article.