
Abstract
Background
The Predict Recovery Potential algorithm (PREP2) was developed to predict upper limb (UL) function early after stroke. However, assessment in the acute phase is not always possible.
Objective
To assess the prognostic accuracy of the PREP2 when applied in a subacute neurorehabilitation setting.
Methods
This prospective longitudinal study included patients ≥18 years old with UL impairment following stroke. Patients were assessed in accordance with the PREP2 approach. However, 2 main components, the shoulder abduction finger extension (SAFE) score and motor-evoked potentials (MEPs) were obtained 2 weeks poststroke. UL function at 3 months was predicted in 1 of 4 categories and compared with the actual outcome at 3 months as assessed by the Action Research Arm Test. The prediction accuracy of the PREP2 was quantified using the correct classification rate (CCR).
Results
Ninety-one patients were included. Overall CCR of the PREP2 was 60% (95% CI 50%-71%). Within the 4 categories, CCR ranged from the lowest value at 33% (95% CI 4%-85%) for the category Limited to the highest value at 78% (95% CI 43%-95%) for the category Poor. In the present study, the overall CCR was significantly lower (P < .001) than the 75% reported by the PREP2 developers.
Conclusions
The low overall CCR makes PREP2 obtained 2 weeks poststroke unsuited for clinical implementation. However, PREP2 may be used to predict either excellent UL function in already well-recovered patients or poor UL function in patients with persistent severe UL paresis.
Background
Stroke is a leading cause of death and disability worldwide, 1 and upper limb (UL) impairment has been reported in 48% of stroke survivors in the acute phase 2 and in 30% to 66% of stroke survivors in the chronic phase.3,4 UL impairment is related to subsequent functional limitations affecting activities of daily living.5,6 Accurate prediction of UL function can provide patients and therapists with realistic expectations for UL prognosis, help set individual goals for rehabilitation, and may result in more effective utilization of health resources.7-9
In 5 prospective longitudinal studies published in 2014-2017, researchers measured UL motor impairment within 2 weeks of stroke and at 3 or 6 months after stroke.10-14 These studies showed that most patients recover 70% to 80% of their maximum possible UL motor function within 3 to 6 months after stroke.10-14 However, increased scores on clinical assessments demonstrated at a group level have little individual prognostic value due to great variation between individuals 15 and which patients will regain UL function cannot be safely predicted from clinical measures alone.11,12
In patients with severe UL impairment, the use of a biomarker may improve prediction accuracy for motor recovery.8,16,17 A biomarker is an indicator of disease state that can be used clinically to reflect underlying molecular events and/or predict outcomes associated with recovery from stroke. 18 A biomarker widely used to assess corticospinal excitability is motor-evoked potentials (MEPs). MEPs are motor contractions elicited by pulses of transcranial magnetic stimulation (TMS). 19 Patients in whom TMS elicits MEPs in muscles of the paretic limb generally achieve better and faster motor recovery than patients without MEPs.8,12,20 In a recent review, MEPs at rest was the only biomarker predicting motor outcome in individuals with severe UL impairment following stroke. 16
Several prediction algorithms for UL function have been proposed and evaluated in clinical trials.8,9,11,21-23 However, the majority of these algorithms are most accurate for predicting recovery in patients with mild to moderate UL impairment.9,12,24 The Predict Recovery Potential (PREP2) algorithm stands out as its overall predictive value is reported to be 75%. 25 Especially in patients with severe paresis its accuracy exceeds that of previous prediction algorithms.7-9 The first version of the PREP2 algorithm increased therapist confidence and rehabilitation efficacy. 26 Hence, research indicates that PREP2 is a promising tool for clinical application. The PREP2 combines clinical assessment with the shoulder abduction finger extension (SAFE) test with information about MEP status. For some patients, additional information on either age or the National Institutes of Health Stroke Scale (NIHSS) score is included.
A recent study by Kier et al 27 revealed that knowledge of prognosis seems to be relevant for most therapists in their clinical work. At the same time, prediction models for UL function after stroke are not yet a part of daily practice in Danish stroke rehabilitation. 27 A main obstacle for implementing PREP2 in clinical practice is the fixed time points of the initial assessment with SAFE and TMS, which are days 1 to 3 and 3 to 7, respectively. In several countries, including Denmark, patients needing inpatient rehabilitation are transferred from the acute stroke units to various subsequent rehabilitation services during the first days or weeks poststroke. The stay at the acute stroke unit is usually short, which leaves little time for prognostic evaluation. As most recovery occurs within the first 3 months after stroke, it is essential that all patients are assessed at a fixed point in time after stroke. 28 Based on the clinical reality we experience in our health system we decided to make the prediction 2 weeks poststroke to include as many patients in the subacute phase as possible who had not been available for earlier assessments. Furthermore, this point in time was considered relevant for targeted rehabilitation. Predictions made 2 weeks poststroke may support the choice of adequate therapeutic approaches, can be used inform clinicians and patients about future potential UL function and may influence length of stay. The knowledge obtained may be used to guide choice of UL intervention and treatment. If the PREP2 algorithm could be applied 2 weeks poststroke with satisfactory accuracy, this would facilitate its implementation. The aim of this study was to assess the prognostic accuracy of PREP2 when applied in a subacute neurorehabilitation setting 2 weeks poststroke.
Methods
Study Design
This was a prospective longitudinal study. We followed the STROBE (Strengthening the Reporting of Observational Studies in Epidemiology) guidelines for reporting observational data and the recommendations for standardized measurement of sensorimotor recovery in stroke trials.28,29
Setting and Patients
The study took place at a neurorehabilitation hospital in Denmark. Approximately 500 adult patients with stroke are admitted annually from various stroke units. Patients are admitted if they are considered to benefit from inpatient neurorehabilitation and approximately two-thirds arrive within 14 days poststroke. For the present study patients were included consecutively from June 2018 to October 2019.
Patient inclusion criteria were first or recurrent ischemic or hemorrhagic stroke, admitted to the rehabilitation hospital within 2 weeks poststroke, level of UL function defined as a SAFE score <10, age ≥18 years, and ability to cognitively comply with examinations defined by a Functional Independence Measure cognitive score ≥11 in combination with the rehabilitation team considering the patient able to participate. Exclusion criteria were subarachnoid hemorrhage or prior UL impairment, for example, from a previous stroke or injury, as that would impede the potential for full recovery. In addition, patients were excluded if the information necessary for prediction could not be obtained at baseline.
Procedure
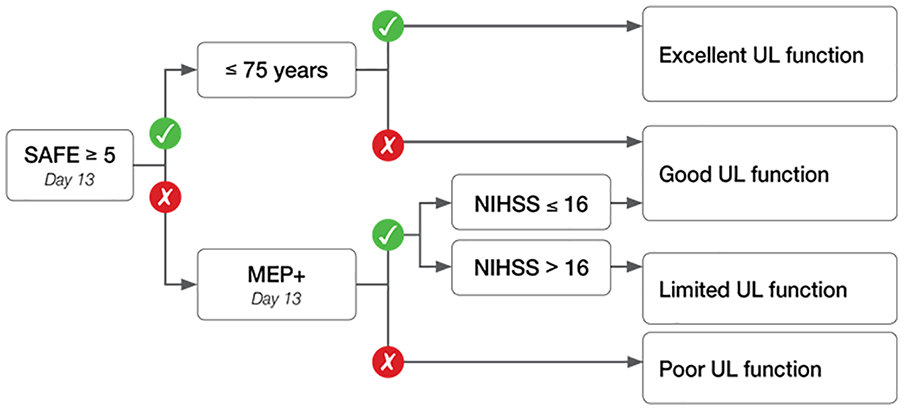
Included patients were examined according to the PREP2 (Figure 1), and UL function in 1 of 4 categories was predicted.
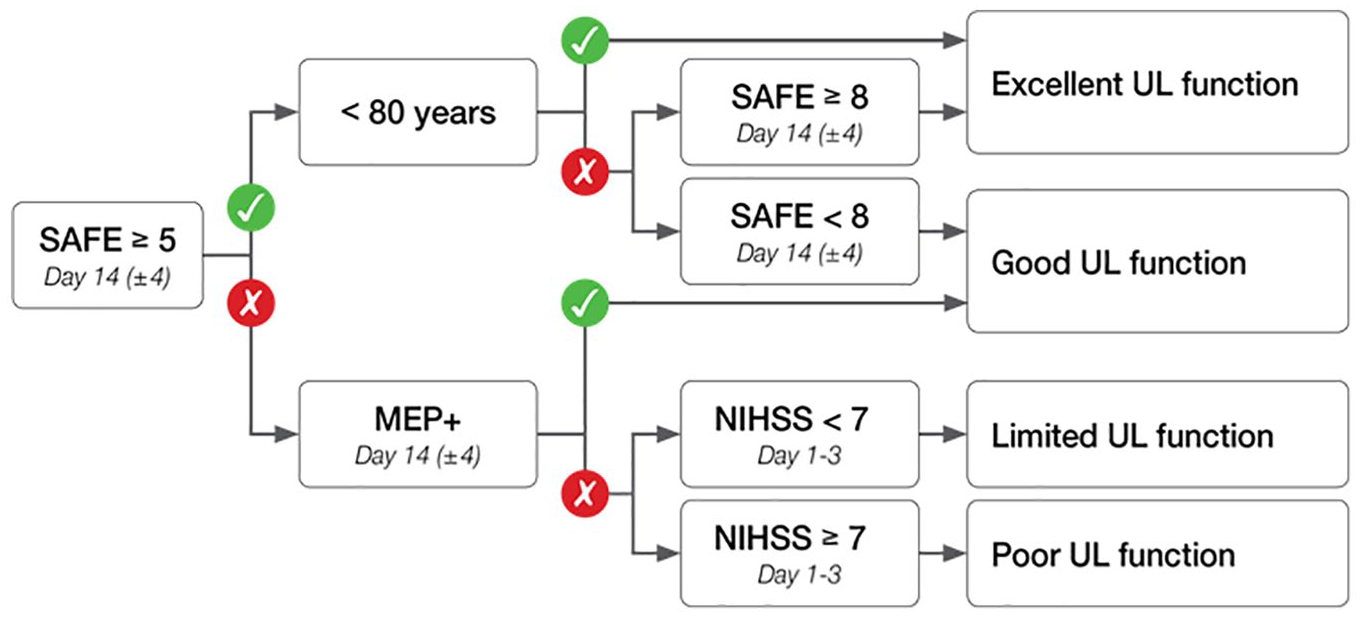
The Predict Recovery Potential algorithm performed 2 weeks poststroke: SAFE, Shoulder Abduction and Finger Extension; <80 y, less than 80 years old; MEP+, motor-evoked potentials present; NIHSS, National Institutes of Health Stroke Scale. Excellent: Potential to make a complete or near complete recovery of hand and arm function within 3 months. Good: Potential to use their affected hand and arm for most activities of daily living within 3 months. Limited: Potential to regain some movement in their hand and arm within 3 months. Poor: Unlikely to regain useful movement in their hand and arm within 3 months.
The first step in the PREP2 is a calculation of the SAFE score by scoring shoulder abduction and finger extension strength separately between a minimum of 0 and a maximum of 5 (best) 8 . The scores are added to form the SAFE score ranging from 0 to 10 (best). The second step depends on the SAFE score. For patients with SAFE score ≥5, information on age is used, and a prediction of either Excellent or Good UL function is made. For patients with a SAFE score <5, TMS is used to establish MEP status. If MEPs are present (MEP+), the patient is predicted a Good UL function. If MEPs cannot be elicited (MEP−), then a measure of stroke severity, the patient’s NIHSS score, is used; and UL function will be predicted as either Limited or Poor, if the NIHSS score is <7 or ≥7, respectively.
UL function was measured with the Action Research Arm Test (ARAT).28,30-32 The ARAT reflects a broad range of arm and hand activities. Patients can score from a minimum of 0 to a maximum of 57 (best). In line with the PREP2 procedures, the outcome was predicted in 1 of 4 categories, each reflecting a range of scores on ARAT. The category “Excellent” comprises the ARAT scores of 51 to 57, “Good” 34 to 50, “Limited” 13 to 33, and “Poor” 0 to 12.
In the study by Stinear et al, 8 the SAFE score was obtained within 3 days and MEP from 3 to 7 days poststroke. Information on age and NIHSS scores within 3 days poststroke was obtained from medical records. In the present study, both the SAFE score and MEPs were obtained 2 weeks poststroke (see Figure 1). Information on age and NIHSS score or the comparable Scandinavian Stroke Scale (SSS) score was routinely recorded in the acute units within 3 days poststroke and could be collected from the medical record as originally proposed by Stinear et al. 8
The TMS procedure was performed in line with international recommendations 19 and screening for contraindications and application of TMS were in accordance with the protocol from Stinear et al.33,34 Absolute contraindications were epilepsy, metal implants in the head, implanted electronics (cardiac pacemaker, defibrillator, cochlear implant, medication pump), skull fracture or serious head injury, brain surgery, and pregnancy. 19
Patients were seated with the affected UL resting on a table in a relaxed position with elbow flexion. Electromyographic activity was recorded from the first dorsal interosseous and the extensor carpi radialis muscle of the affected UL, using standard surface electrodes (Neuroline 720, Ambu A/S). Recording electrodes were placed in a belly-tendon montage, while the reference electrode was placed over the lateral epicondyle of the humerus. Signals were sampled at 4 kHz, amplified (150 V/V gain), band-pass filtered (10-500 Hz), and acquired with a 16-bit data acquisition board (USB-6341, National Instruments) for offline analysis. The acquired data were visually inspected and stored with a custom-made LabVIEW (National Instruments) software (Mr. Kick, Knud Larsen, Aalborg University, Denmark). Magnetic stimuli consisted of monophasic pulse waveforms that were delivered using a 70-mm figure-of-eight coil connected to a MagStim 200 unit (Magstim Co LtD). The coil was oriented to induce posterior-to-anterior current flow in the ipsilesional M1. Stimulus intensity began at 50% of the maximal stimulator output (MSO), and was increased in 10% MSO steps, delivering approximately 3 to 5 stimuli at each intensity and scalp location. The experimenter moved the coil in approximately 1-cm steps (anterior, posterior, medial, lateral) to find the optimal location for producing MEPs. Stimulus intensity was increased until MEPs were consistently observed in one or both muscles or until 100% MSO was reached. If 100% MSO was reached and no MEPs were observed, the patient was asked to make a firm fist with the nonparetic hand and to attempt to do so with the paretic hand as this may facilitate MEPs.
The patient was classified as MEP+ if either passive or active MEPs were observed with a peak-to-peak amplitude ≥50 µV at consistent latency in response to at least 5 consecutive stimuli. The expected latencies for the MEPs in the first dorsal interosseous muscle were ≈20 to 30 ms, and extensor carpi radialis muscle ≈15 to 25 ms.19,33,35 If this criterion was not met with stimuli delivered at 100% MSO intensity, the patient was categorized as MEP−. 33
Electromyographic recordings were further evaluated offline and MEP status was established by one of the authors (FGA), who was blinded to the results of the clinical assessment.
Supplementary Assessments
To describe the population and enable comparison with other stroke populations a range of supplementary assessments were performed. UL impairment was assessed with the Fugl-Meyer motor assessment upper extremity (FM) at baseline and follow-up.30,36 FM is found to be reliable and valid.30,36 Moreover, UL limb pain, light touch, proprioception, neglect, and walking ability were assessed at baseline.
Follow-up Assessment
Patients were tested at 3 months poststroke by experienced research therapists trained in assessment procedures and blinded to both baseline scores and predicted categories. The research therapists were not involved in patient care.
The primary outcome was the achieved UL function in 1 of the 4 categories based on the ARAT scores. ARAT is found to be reliable and valid, and is internationally widely applied and recommended.28,30 To ensure reliability, the assessors received a thorough introduction on how to administer ARAT and a comprehensive manual was provided based on previous research. 32 Before commencing the study several patients were assessed by all assessors and their results discussed until agreement was achieved. After 3 months, this calibration process was repeated. In cases of doubt on how to score a certain item, the principal investigator was contacted.
Inclusion in the present study did not affect patient rehabilitation or choice of UL treatment. Length of stay, contents and intensity of the rehabilitation were individually organized and determined by the rehabilitation team, patient and relatives. Amount of standard rehabilitation included 45 minutes of physiotherapy and 45 minutes of occupational therapy 5 days a week. For patients with severe brain damage the amount was double. The team members were blinded to predictions and clinical assessments.
Statistical Analysis
The required number of patients in the study was 73 assessed by a power calculation assuming a correct classification rate (CCR) of 75% with a CI 95% of 65% to 85%. A CCR of 75% was chosen as this was in line with the accuracy found in the original PREP2 study. 8 Allowing for a 20% dropout, it was decided to include at least 90 patients.
Data were analyzed with STATA 16. Data were visually inspected to determine the distribution of normality. Continuous baseline characteristics, stroke details, baseline and follow-up scores were summarized by mean, standard deviation (SD), minimum (min), and maximum (max) when normally distributed; otherwise by median, interquartile range (IQR), min, and max. As ARAT is an ordinal scale and data were nonnormally distributed, within group difference from inclusion to follow-up was tested with the nonparametric Wilcoxon signed rank test.
The overall accuracy of the PREP2 was quantified by comparing predicted and actual ARAT categories using the CCR. In addition, CCR, sensitivity and specificity were calculated for each of the four categories. To differentiate between patients who would need additional information on MEP status, CCR was calculated for those with a SAFE score <5 or ≥5.
To examine if CCR of the PREP2 obtained 2 weeks poststroke could be improved, a classification and regression tree (CART) analysis was carried out using pruning and cross-validation according to Hastie et al. 37 CART analysis produces a decision tree without the user determining which variable to include or their order in the tree.37,38 Available for the CART analysis were the components of PREP2: SAFE score, age, NIHSS score, and MEP status. For patients with a SAFE score >5, MEP+ status was assumed in the analysis.
Ethical Considerations
The study was reported to the Danish data protection agency and approved by the regional ethics committee for the Central Denmark Region with the number 628213. All participants provided written informed consent in accordance with the Declaration of Helsinki.
Results
The inclusion criteria were fulfilled by 131 patients of whom 36 were excluded, leaving 95 patients for whom a baseline prediction of UL function could be obtained. Of these, 91 patients were available for follow-up and included in the analysis (Figure 2). Patients’ demographic and clinical characteristics are reported in Table 1.
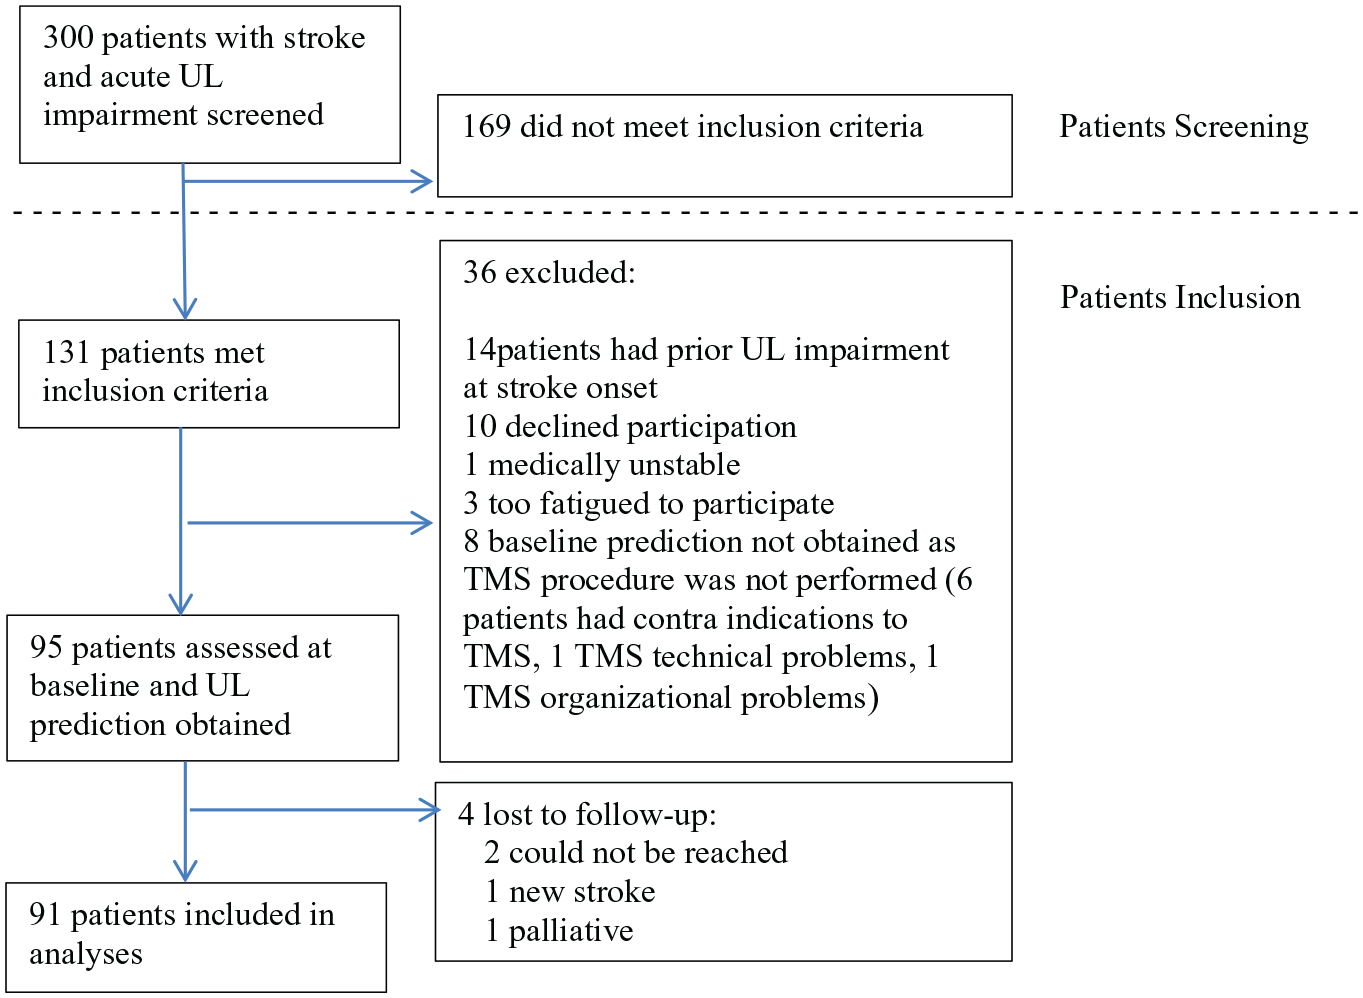
Flowchart of patients included.
Participants’ Characteristics and Stroke Details (n = 91). a
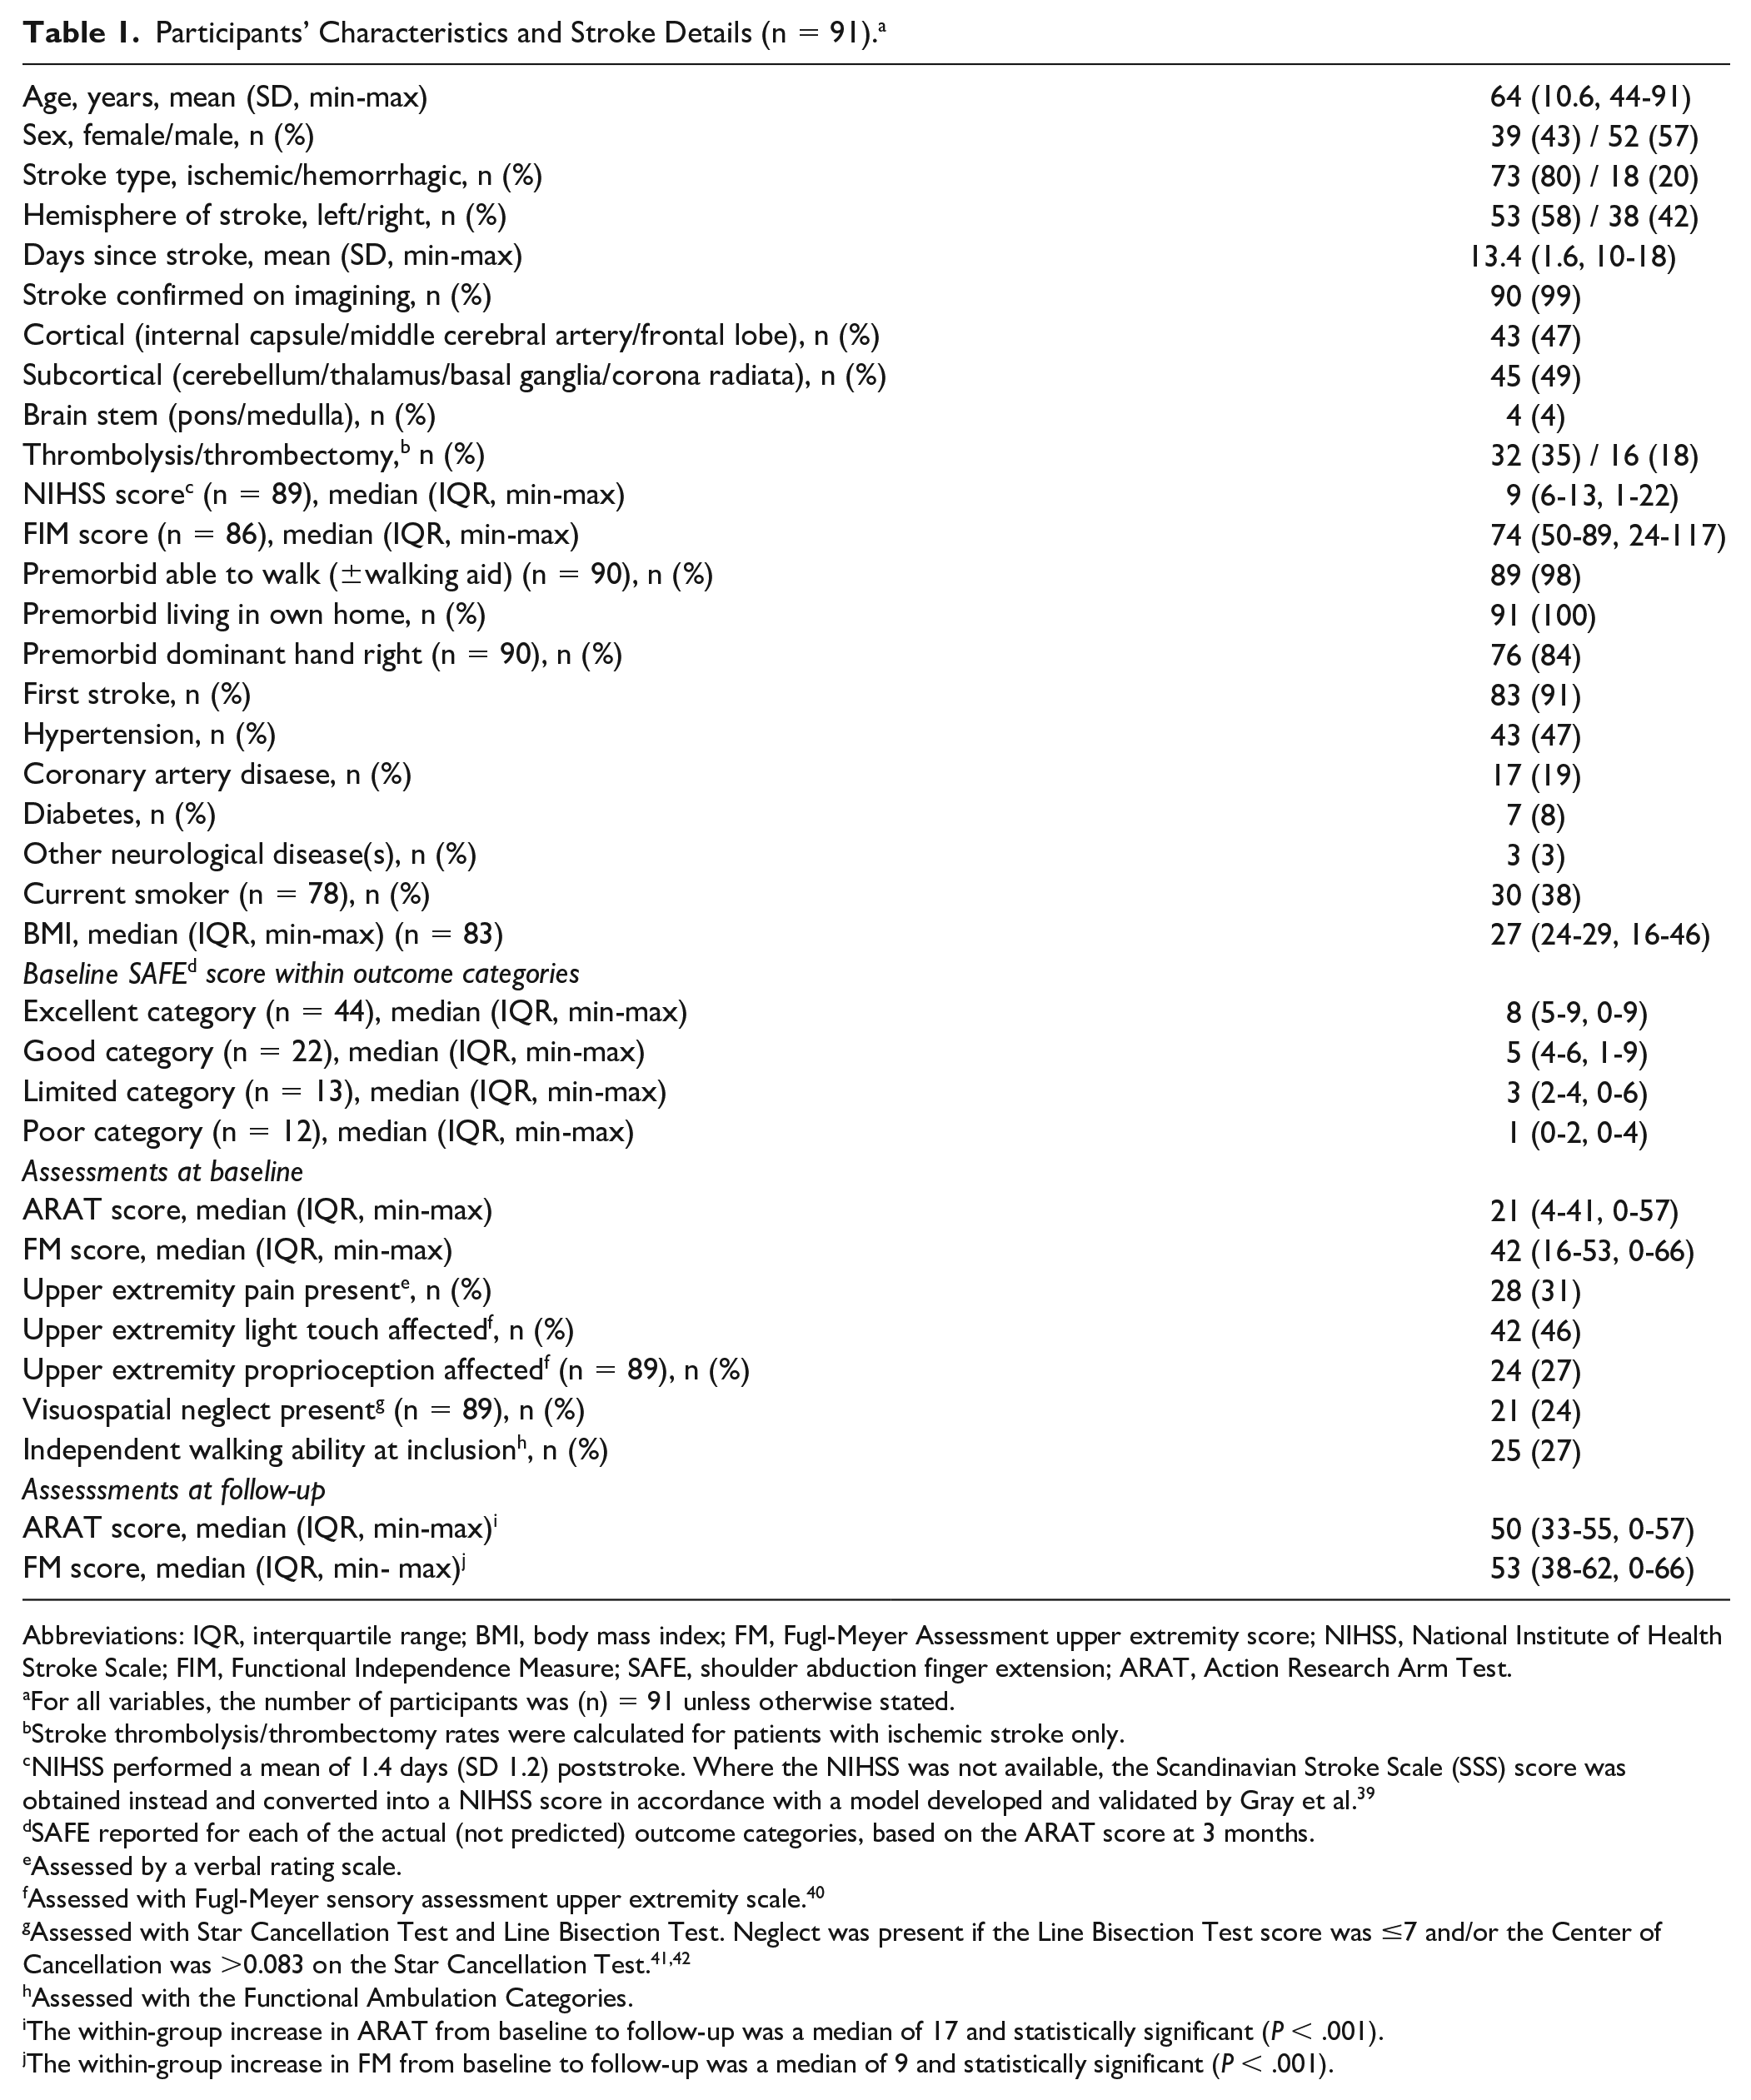
Abbreviations: IQR, interquartile range; BMI, body mass index; FM, Fugl-Meyer Assessment upper extremity score; NIHSS, National Institute of Health Stroke Scale; FIM, Functional Independence Measure; SAFE, shoulder abduction finger extension; ARAT, Action Research Arm Test.
For all variables, the number of participants was (n) = 91 unless otherwise stated.
Stroke thrombolysis/thrombectomy rates were calculated for patients with ischemic stroke only.
NIHSS performed a mean of 1.4 days (SD 1.2) poststroke. Where the NIHSS was not available, the Scandinavian Stroke Scale (SSS) score was obtained instead and converted into a NIHSS score in accordance with a model developed and validated by Gray et al. 39
SAFE reported for each of the actual (not predicted) outcome categories, based on the ARAT score at 3 months.
Assessed by a verbal rating scale.
Assessed with Fugl-Meyer sensory assessment upper extremity scale. 40
Assessed with Star Cancellation Test and Line Bisection Test. Neglect was present if the Line Bisection Test score was ≤7 and/or the Center of Cancellation was >0.083 on the Star Cancellation Test.41,42
Assessed with the Functional Ambulation Categories.
The within-group increase in ARAT from baseline to follow-up was a median of 17 and statistically significant (P < .001).
The within-group increase in FM from baseline to follow-up was a median of 9 and statistically significant (P < .001).
Baseline Algorithm Measures
The SAFE score was obtained 13.4 days after stroke (SD 1.6, min 10, max 18). At baseline, the mean SAFE score was 5 (SD 2.8, min 0, max 9).
Corticospinal tract integrity was examined in 38 of 91 patients (42%), a mean of 13.4 days after stroke (SD 1.7, min 11, max 18). Twenty-six patients were MEP+ and 12 were MEP-. For the latter, the NIHSS scores were included with a median of 13 (IQR 7-15, min 9, max 21).
At baseline, 9 patients (10%) were predicted Poor UL function at 3 months, 3 patients (3%) were predicted Limited UL function, 29 (32%) were predicted Good UL function, and 50 (55%) were predicted Excellent UL function (Table 2).
Predicted and Actual Action Research Arm Test (ARAT) Categories and Agreement Between Them. a
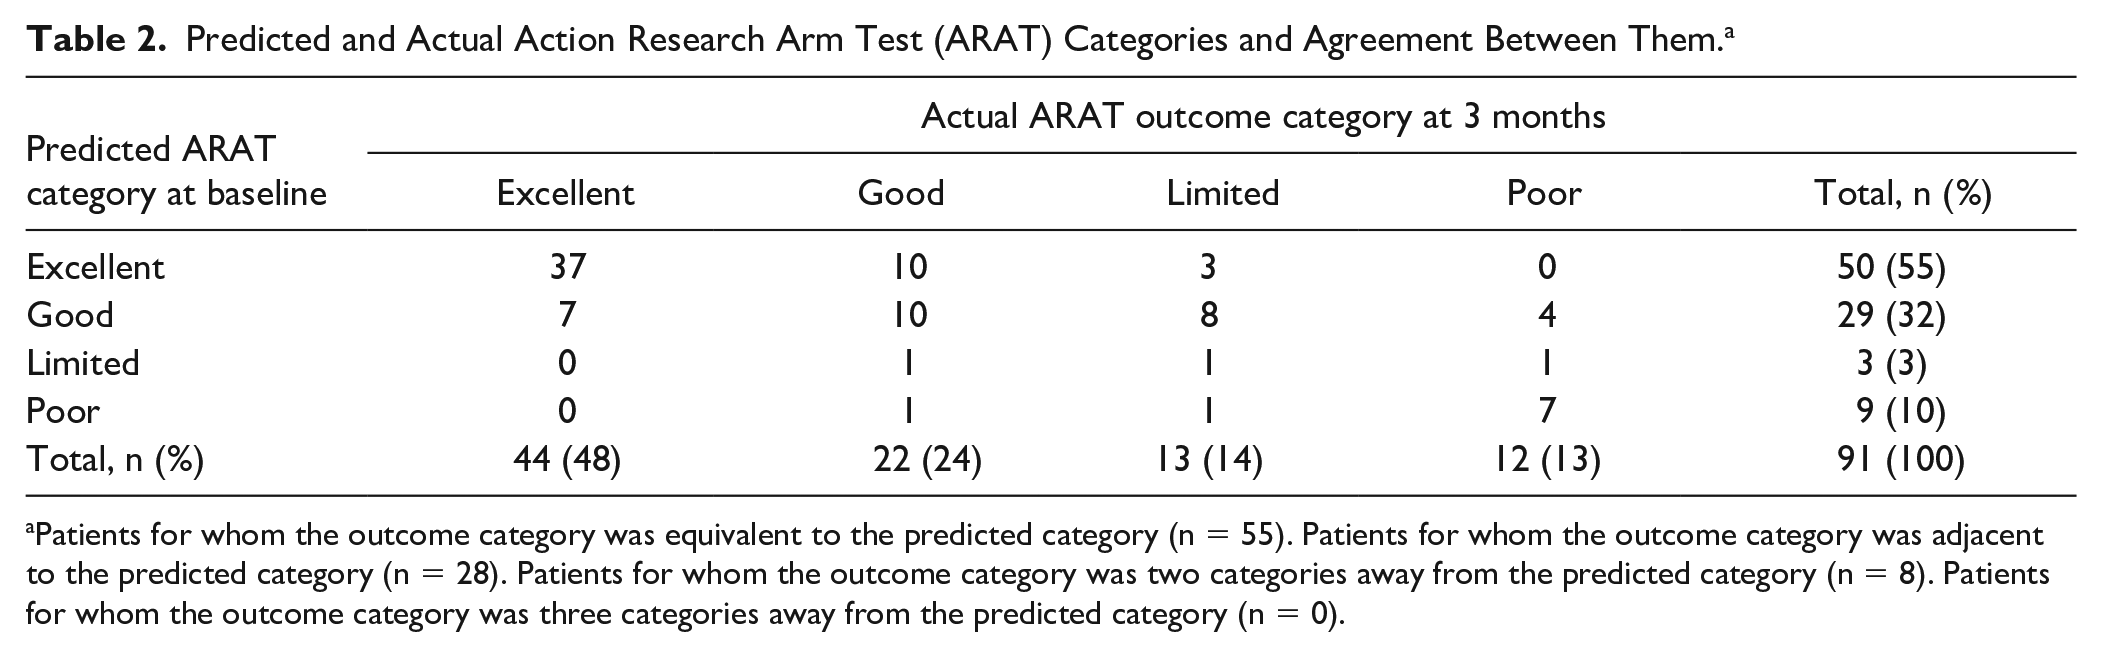
Patients for whom the outcome category was equivalent to the predicted category (n = 55). Patients for whom the outcome category was adjacent to the predicted category (n = 28). Patients for whom the outcome category was two categories away from the predicted category (n = 8). Patients for whom the outcome category was three categories away from the predicted category (n = 0).
Outcome 3 Months After Stroke
Follow-up assessments were performed a mean of 91 days after stroke (SD 3.8, min 84, max 99). The median ARAT score at follow-up was 50 (IQR 33-55, min 0, max 57). The within group increase in ARAT scores from baseline to follow-up was 17 (IQR 3-27, min −4, max 57) and statistically significant (P < .001).
Based on the actual ARAT score at follow-up, 12 patients ended in the category Poor, 13 in Limited, 22 in Good, and 44 in Excellent (Table 2). In the category Poor, the median ARAT score was 0 (IQR 0-2, min 0, max 6), in Limited 31 (IQR 24-32, min 17, max 33) in Good 42 (IQR 39-49, min 24, max 50) and in Excellent 55 (IQR 54-56, min 51, max 57).
UL Prediction Accuracy
Overall, CCR was 60% (95% CI 51-71) (Table 3). In 26 of 91 patients (29%), the prediction was too optimistic, and the patients did not achieve the predicted UL function. In 10 of 91 patients (11 %), the prediction was too pessimistic and the actual UL function at 3 months exceeded the predicted function. Most patients (n = 28, 31%) for whom the prediction was inaccurate achieved an actual outcome category adjacent to the predicted category, for example, predicted as Good, but ending up in the outcome category Limited (Table 2).
Accuracy of the Prediction Algorithm.
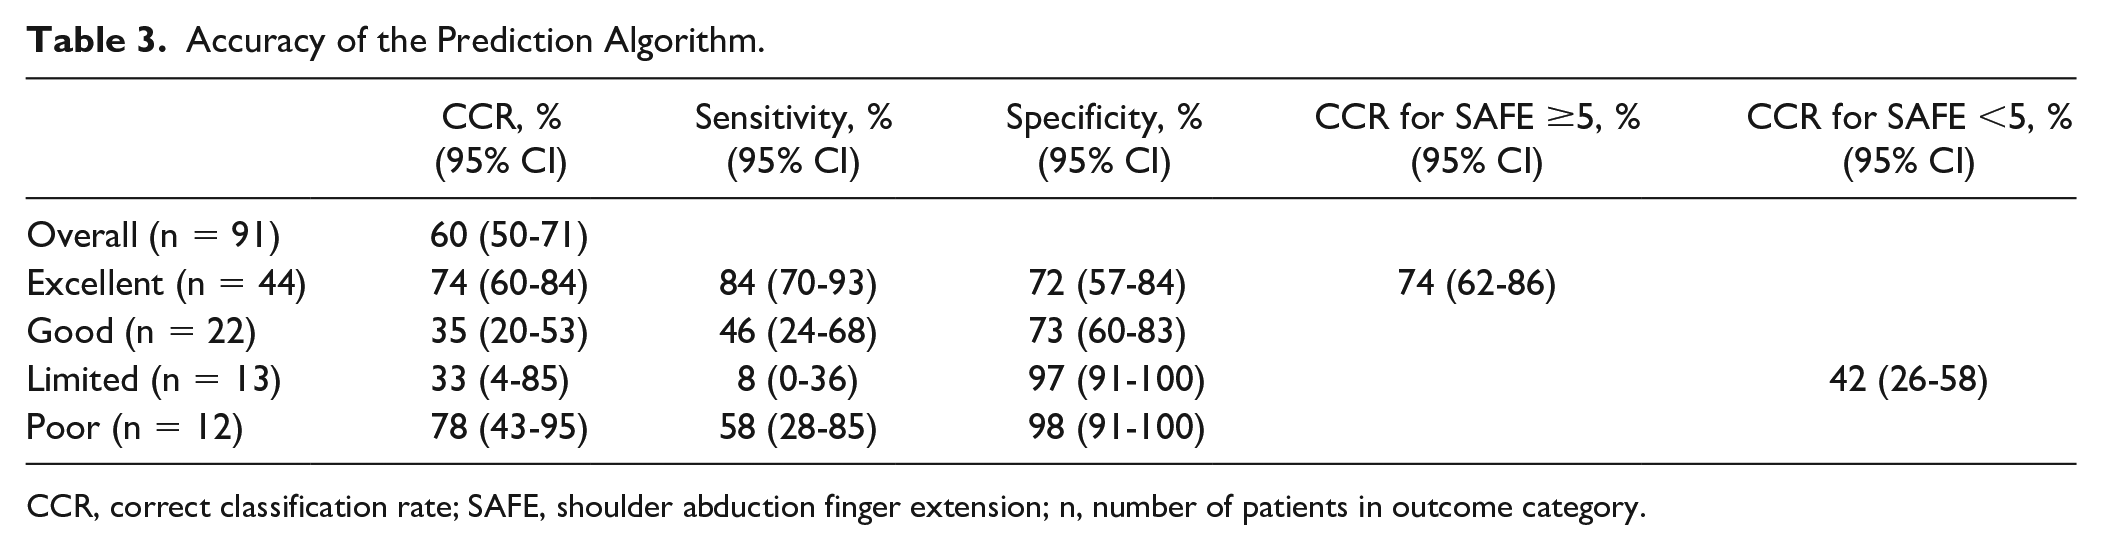
CCR, correct classification rate; SAFE, shoulder abduction finger extension; n, number of patients in outcome category.
For each of the 4 categories, CCR was a highest 78% (95% CI 43%-95%) for patients with a prediction of Poor UL function followed by 74% (95% CI 60%-84%) for those predicted Excellent UL function. For patients predicted Good UL function, CCR was 35% (95% CI 20%-53%); and for those predicted Limited UL function, CCR was 33% (95% CI 4%-85%) (Table 3).
For the 53 patients with a SAFE score ≥5, CCR was 74% (95% CI 62%-86%). For the 38 patients with a SAFE score <5, CCR was 42% (95% CI 26%-58%) (Table 3). The low CCR for patients with a SAFE score <5 was mainly due to the 26 patients who were MEP+ and hence predicted Good UL function (Figure 2). In this category, there was considerable variability in outcome categories (Table 2). On the contrary, patients who were MEP− and predicted a Poor UL function generally achieved the outcome category Poor (Table 2).
CART Analysis
The CART analysis produced a decision tree with an overall CCR of 66% (95% CI 56-76) for PREP2 obtained 2 weeks poststroke (Figure 3). The SAFE score was found to be the most important predictor. Patients with a SAFE score ≥5 were predicted either Excellent or Good UL function based on age ≥75 years. For patients with a SAFE score <5, the NIHSS score with a cut point of 16 was needed for patients who were MEP+. Patient who were MEP− were predicted Poor UL function. The CART analysis was based on 89 of the 91 patients, as 2 patients did not have a NIHSS score.
CART model for prediction of UL function. Available for the CART analysis were the PREP2 components: SAFE score, MEP status, age, and the NIHSS score. CART, classification and regression tree; UL, upper limb; PREP2, Predict Recovery Potential algorithm; SAFE, shoulder abduction finger extension; MEP, motor-evoked potential; NIHSS, National Institutes of Health Stroke Scale.
For each of the 4 categories, CCR was 80% (95% CI 66%-89%) for the category Excellent, 45% (95% CI 28%-63%) for Good, 60% (95% CI 20%-90%) for Limited, and 67% (95% CI 37%-87%) for Poor. For patients with a SAFE score ≥5, CCR was 78% (95% CI 67%-89%); and for patients with a SAFE score <5, CCR was 50% (95% CI 34%-66%).
Discussion
When PREP2 was applied in a subacute rehabilitation setting and the SAFE score and MEP status were obtained day 13 (SD 1.6), the overall CCR was 60% (95% CI 50%-71%). However, CCR differed greatly for each of the 4 UL prediction categories. CCR was low for patients predicted Limited (33%; 95% CI 4%-85%) or Good (35%; 95% CI 20%-53%) UL function. In contrast, CCR was high for patients predicted Poor (78%; 95% CI 43%-95%) or Excellent (74%; 95% CI 60%-84%) UL function. The overall CCR of 60% seems too low to be clinically relevant. However, the high accuracy for patients predicted Poor or Excellent UL function might still be valuable to clinicians and patients.
A CART analysis revealed that by changing the sequence of the algorithm and the cut-points for age and NIHSS, the CCR could be increased to 66%. In the CART model, the cut-point for age was lowered to 75 years and the cut-point for NIHSS score was set to 16 for patients who were MEP+. Despite the overall increase in accuracy, the CCR produced by CART was 67% or lower for 3 of the 4 categories and the CART model did not improve PREP2 used 2 weeks poststroke.
Comparison With Previous Findings
Stinear et al 8 found an overall accuracy of the original PREP2 algorithm of 75%. The overall CCR of 60% (95% CI 50%-71%) found in the present study was significantly lower (15% difference, 95% CI 3%-27%, P < .001, chi-square test).
There could be several possible explanations for the lower CCR in the present study compared to the study by Stinear et al. 8 First, although Stinear et al developed the PREP2 algorithm using pruning and cross validation to avoid overfitting, the CCR of 75% was still computed from the training data used for developing it and may hence be difficult to obtain in other data sets.43,44 Second, the population in the present study differs from the population in the original study who were in the acute to early subacute stage of stroke. Some of these patients would have been either too low- or too high-functioning to be referred to an in-patient rehabilitation ward 2 weeks poststroke. This difference in populations may contribute to the lower CCR. 43 A third explanation for the overall lower CCR in the present study, especially the large number of patients for whom the algorithm was too optimistic, is that the PREP2 algorithm was designed to convert 3- to 7-day information into 3-month predictions. The fact that most spontaneous biological recovery occurs early after stroke, may have resulted in patients closer to their maximally achievable UL function when assessed at day 13 than when assessed day 3 to day 7 poststroke. Consequently, the room for increases in UL function scores declines during the course of recovery. In other words, a SAFE score of, for example, 6 on day 3 is more promising than the same score on day 13, and the chance of achieving a Good or Excellent outcome will be greater.
Results from the EPOS cohort study support that timing of the initial assessment can influence the accuracy of UL prediction. 3 In this study, it was shown that UL function could be predicted by shoulder abduction and finger extension measured within 72 hours after stroke. 3 Retesting the model on days 5 and 9 showed that the probability of regaining dexterity remained 98% for those with some finger extension and shoulder abduction, whereas the probability decreased from 25% to 14% for those without this voluntary control. 3 Similarly, our study with assessments 2 weeks poststroke indicates that the longer the severe impairment lasts, the lesser is the chance to regain UL function.
An essential part of PREP2 is the use of MEP as a biomarker. A number studies have shown that the presence of MEP+ days 3 to 7 after stroke indicates a good prognosis and improves the prediction accuracy for UL function.8,12 However, this was not the case in the present study, where patients with MEP+ on day 13 may or may not improve their UL function. An explanation for this discrepancy in findings may be the aforementioned spontaneous biological recovery. On the other hand, MEP− obtained on day 13 seems just as informative as MEP- obtained on days 3 to 7. When MEP− is obtained within the first days of stroke, 15% to 20% of the patients go on to experience a certain degree of recovery.45-47 In the present study, 3 of the 12 MEP− patients (25%) had an outcome category exceeding the predicted outcome. These findings suggest that at least some regeneration of the corticospinal tract or some compensation for the loss of its functionality may occur.
The use of TMS to assess the state of corticomotor pathways can provide objective information that cannot be obtained by clinical measures alone. 19 However, reproducibility of TMS should be considered. In the present study, MEP presence was established using a belly-to-tendon placement of electrodes. Generally, this configuration will not only capture MEPs from only one specific muscle, but from several muscles from the forearm.35,48 Nonetheless, recording muscle activity for the UL in general rather than from a specific hand flexor is in line with the purpose of the present study and was not regarded a limitation. Also, using a setup similar to the one used in this study, a number of studies suggest that MEP amplitudes and latencies to single TMS pulses have adequate reliability for both healthy volunteers 49 and certain patient populations. 50 Nonetheless, it is reported that MEPs are highly susceptible to numerous sources of variability, for example, individual physical features as age and height 51 and MEPs cannot be obtained if patients have contraindications to TMS. 19 In the present study, 6 patients had contraindications to TMS, which prevented to obtain their MEP status and subsequent UL prediction. 51 Finally, TMS can be relatively expensive, and it requires trained staff.
Strengths and Limitations of the Present Study
A strength of the present study is that patients were assessed at set time points in relation to stroke onset to account for underlying recovery processes. 28 To further minimize risk of bias, patients were assessed with FM and ARAT, 2 reliable and valid UL assessments recommended for use in clinical trials. 28 Additional strengths to be noted are that the present study was based on a relatively high number of patients, had very few dropouts, blinded obtainment of MEP status, blinded assessment at follow-up as well as patients and treating therapists being unaware of the UL prediction.
A limitation of the present study was that only 12 patients were MEP− and the predictions Poor or Limited UL function were consequently based on a small number of patients. Longitudinal assessments of corticospinal tract integrity, preferably for the entire group, could have provided more information on potential changes in cortico-motor pathways during the course of recovery, but were beyond the scope of this study. Another limitation of the present study concerns the NIHSS score used to differentiate between the categories Poor and Limited UL function. The NIHSS is not used universally in acute units in Denmark. The NIHSS is mainly used for patients with ischemic stroke, while the SSS is used routinely for all stroke patients. According to Grey et al. the total scores for NIHSS and SSS may be interconverted with good precision. 39 In the present study, the SSS score was converted if the NIHSS score was unavailable. However, these 2 instruments only partly measure the same items. 39 Consequently, the CCR of PREP2 in the present study may have been higher if a true NIHSS score could have been used. However, only 6 patients obtained their prediction based on a converted SSS score.
The patients in the present study were all in need of in-patient rehabilitation, which implies that their impairments were complex and not restricted to the UL. Thus, the results may not be generalizable to all patients at 2 weeks poststroke.
Other factors than those included in the PREP2 algorithm may influence future UL function. Winters et al 52 found, that patients with paresis mainly restricted to the upper limb, no visuospatial neglect, and sufficient somatosensory function were likely to show at least some return of upper limb capacity at 6 months poststroke. In the present study, many patients had somatosensory deficits, visuospatial neglect, and UL pain. Moreover, the majority were not able to walk independently due to an affected lower limb. The influence of these factors on UL function was not examined in the present study; nor was the influence of length of inpatient rehabilitation, UL treatment, or dose, or treatment modality.
Clinical Implications
Based on the present study, the PREP2 algorithm should not be implemented in the clinic when the SAFE score and MEP status are obtained 2 weeks poststroke. However, components from the PREP2 may be used for certain patients. Patients with a SAFE score of at least 5 who are younger than 80 years will most probably achieve an excellent UL function at 3 months. Furthermore, in patients with a SAFE score <5 who are MEP−, no useful UL function can be expected and UL rehabilitation may focus on preventing pain and learning compensatory strategies. Other factors that may improve prediction of UL function 2 weeks after stroke should be examined.
Supplemental Material
sj-pdf-1-nnr-10.1177_1545968320971763 – Supplemental material for Accuracy of the Upper Limb Prediction Algorithm PREP2 Applied 2 Weeks Poststroke: A Prospective Longitudinal Study
Supplemental material, sj-pdf-1-nnr-10.1177_1545968320971763 for Accuracy of the Upper Limb Prediction Algorithm PREP2 Applied 2 Weeks Poststroke: A Prospective Longitudinal Study by Camilla Biering Lundquist, Jørgen Feldbæk Nielsen, Federico Gabriel Arguissain and Iris Charlotte Brunner in Neurorehabilitation and Neural Repair
Footnotes
Acknowledgements
We thank the patients and staff at Hammel Neurorehabilitation Centre for participation.
Supplementary material for this article is available on the Neurorehabilitation & Neural Repair website along with the online version of this article.
Declaration of Conflicting Interests
The author(s) declared no potential conflicts of interest with respect to the research, authorship, and/or publication of this article.
Funding
The author(s) received no financial support for the research, authorship, and/or publication of this article.
References
Supplementary Material
Please find the following supplemental material available below.
For Open Access articles published under a Creative Commons License, all supplemental material carries the same license as the article it is associated with.
For non-Open Access articles published, all supplemental material carries a non-exclusive license, and permission requests for re-use of supplemental material or any part of supplemental material shall be sent directly to the copyright owner as specified in the copyright notice associated with the article.